|
pdf Download
Have your own site? Offer free content to your visitors with TRIGGER$ Public Edition!
Sell TRIGGER$ from your site and grow a monthly recurring income!
Contact [email protected] for more information - (free ad space for participating affiliates).
HOTTEST TIPPING POINTS |
|
|
Theme Groupings |
|
We post throughout the day as we do our Investment Research for:
LONGWave - UnderTheLens - Macro
 Scroll TWEETS for LATEST Analysis Scroll TWEETS for LATEST Analysis
|
"BEST OF THE WEEK "

MOST CRITICAL TIPPING POINT ARTICLES TODAY
|
|
|
|

FRIDAY FLOWS
Liquidity, Credit & Debt
|
FLOWS - Liqudity, Credit & Debt
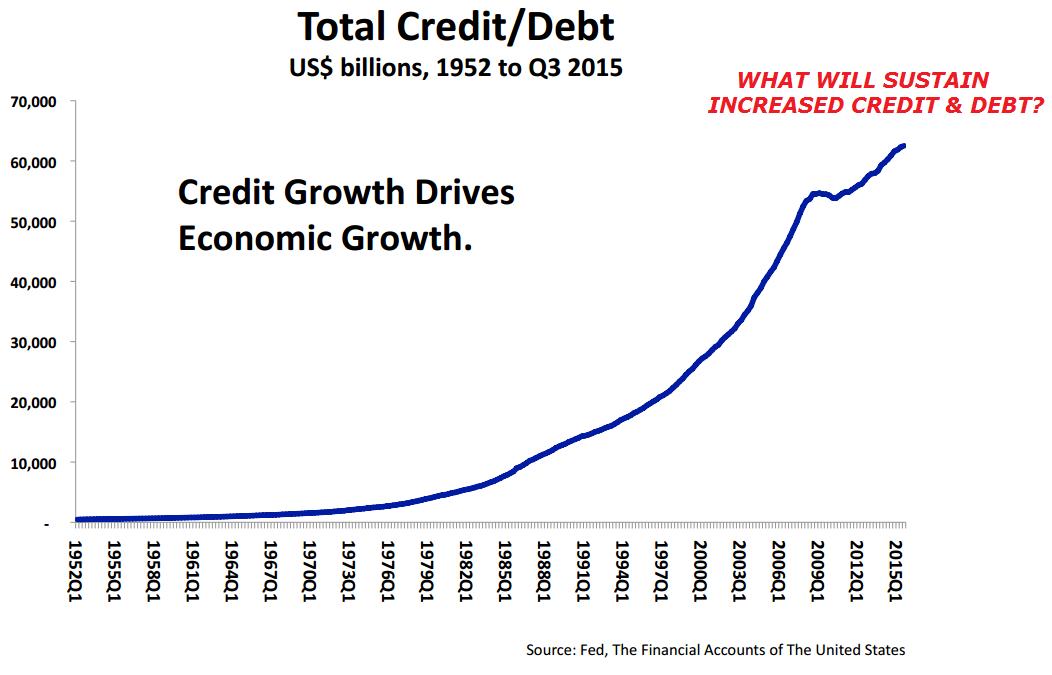
LIQUIDITY: Central Bank Liquidity Increases has slowed or Stopped
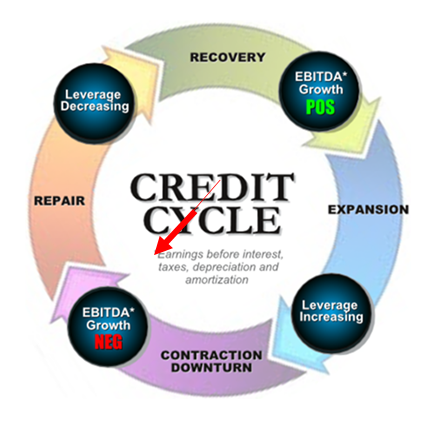
>> CREDIT: Cycle has turned
DEBT: Defaults/ Bankruptcies Will Emerge
|
01-01-16 |
THEMES |
|
A "WITCH'S BREW" BUBBLING IN BOND ETF'S
We believe the Credit Cycle has turned and with it will come some massive unexpected shocks. One of these will be the fall out in the Bond Market, centered around the dramatic growth explosion in Bond ETFs coupled with the post financial crisis regulatory changes that effectively removed banks from making markets in corporate bonds. It is a 'Witch's Brew' with a flattening yield curve bringing it to a boil.
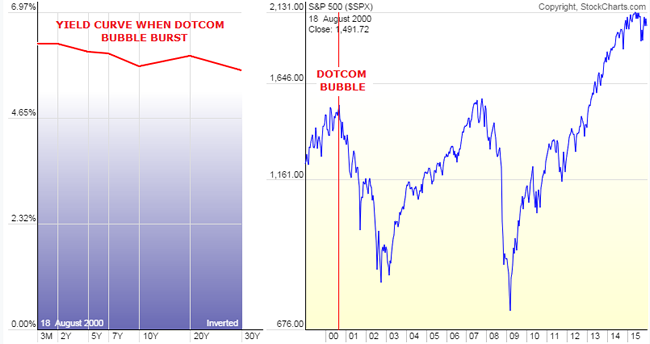
2000 - Flat to Inverted Yield Curve
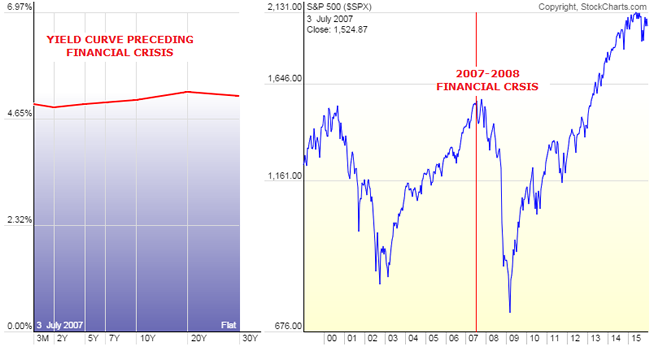
2007 - Flat Yield Curve
TODAY - Signalling a Flattening at Seriously Lower Bound!
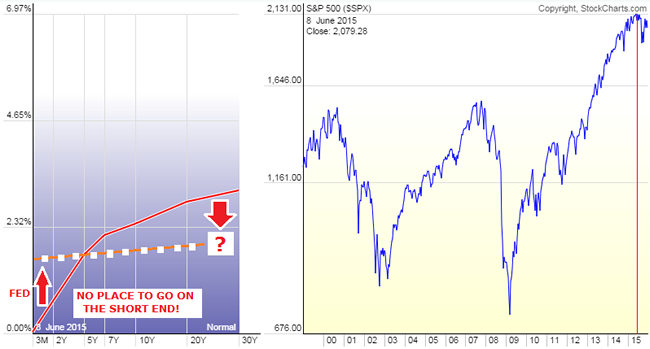
PRESSURES FLATTENING THE YIELD CURVE
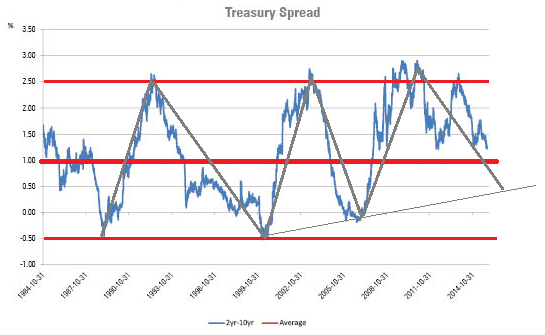
In the last six weeks, the spread between the Ten Year and the Two year treasuries has flattened exactly 25 basis points, which is EXACTLY the same amount that the Fed just moved the Fed Funds target rate this past Wednesday. With investors starved for yield many are being forced further out on the yield curve taking rates down further and pushing prices up.
Dan Norcini at http://traderdan.com lays it out pretty clearly:
This horrific predicament, compliments of our masters at the Central Banks, is forcing money to chase yield meaning that it is going further out along the curve to the long end. The more money that enters any bond market, the LOWER yields go since bond prices move inversely to the yield. When demand for anything increases, its price rises. Bonds, bills, notes, are no exception. As the money flows increase into the long end of the curve, at a faster rate than the money flows might be increasing into the shorter end of the curve, the price of the longer dated bonds rises faster than the price of the shorter dated bonds ( bills, notes,. etc). That means a flattening curve.
Secondly, and something that is extremely relevant to what is going on here – FOREIGN INVESTORS are sending monies overseas to chase yield as well. Think of where interest rates are in both Japan and in the Eurozone compared to comparable dated government debt here in the US. Those foreign flows do two things. They boost the price of the longer dated Treasuries as well as boosting demand for US Dollars.
This phenomenon tends to support both the Dollar’s value on the foreign exchange markets as well as keeping prices for those longer dated Treasuries well supported. Again, bond prices move inversely to yields thus the more money flows into the longer dated treasuries, the more those yields tend to move lower.
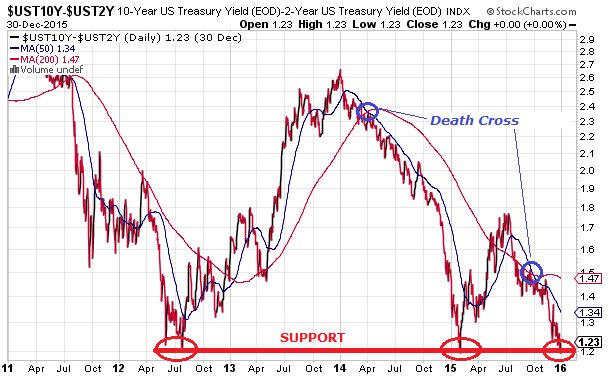
Look at what the result of both of these above factors have done to the yield on the Ten Year Treasury. Its yield was 2.170% on the last day of 2014. Today, its yield is 2.19%. We are only a short two weeks away from ending this year and we are basically back to where we started this year. We have essentially gone nowhere on yields.
What is perhaps even more alarming is that the curve is flattening further. The low point on this spread occurred in early February of this year when it reached 1.19%. Today, it closed at 1.22%. We are talking about a mere 3 basis points from the curve having flattened to a 2015 low!
Clearly, this is NOT A VOTE FOR STRONG ECONOMIC GROWTH laying ahead.
Perhaps this is the reason that the equity markets are beginning to show signs of wobbling.
What some analysts have been saying is that once the Fed started to raise rates, the stock market would come under pressure because the move would be a signal that the Fed has begun the process to slowly drain the liquidity that has fueled its monster seven year rally. I personally take issue with that in the sense that the Fed has not made any move towards actually reducing liquidity that I am aware of. After all, while they did increase the short term target rate by 1/4%, one can hardly say that the interest rate environment is not accomodative. Furthermore, the size of its balance sheet remains the same as it has been in some time nor have I seen any talk coming from the Fed that it intends to reduce that balance sheet.
Here is a chart of the Fed Balance Sheet beginning in October of 2013 ( I chose this month at random). Notice how constant the line has remained over the last year. As you can see, there has been no shrinking of the Balance sheet.
What I think appears to be causing concerns in the stock market is the fact that the yield curve is signaling that economic growth is not going to be increasing. That has gotten some stock investors nervous that perhaps stocks are overvalued. After all, it is hard to make the case that the equity markets should be hitting new lifetime highs when the yield curve is collapsing.
THE "WITCH'S BREW"
Many including Morningstar have hyped "The Great New Yield Opportunity"
Thanks yet again to innovation in the realm of exchange-traded funds, the walls have come down and individual investors now have efficient access to tools that enable them to implement a strategy that only the big boys on the block could implement. Without the benefit of such scale and low relative trading costs, the cost hurdle was far too high for most individual investors and advisors trying to implement this strategy using individual bonds.
Then came along a new breed of fixed-income fund that combines the diversification and accessibility of an ETF with the precision of an individual bond. While an index, for example, typically maintains a fairly stable maturity range, these ETFs have specified maturity dates upon which cash is distributed back to investors. That means, just like an individual bond, the duration of these ETFs will steadily decrease as it approaches maturity.
.....
These ETFs are typically pitched as a way to build bond ladders in order to match cash flows with future liabilities. But thanks to their precise exposure and individual bondlike characteristics, defined-maturity ETFs--which are relatively cheap to trade--are also great tools for executing customized "roll down" strategies to enhance fixed-income total returns.
Even for relatively large investors, the wide bid-ask spreads and dealer mark-ups or commissions incurred when buying and selling individual bonds present a high hurdle. Moreover, the minimum investment that would be required could be another barrier to entry. Often, investors will be dealing in "odd lots," which typically trade at wider spreads, as they are considered less liquid.
One of the attractive traits of an individual bond is the visibility of its cash flows and knowing exactly how much principal is due to you at maturity. Contrast that against a bond index, which does not mature and will see slight variations in its cash flows as it rebalances or reconstitutes over time. In the case of an actively managed portfolio, the payout will fluctuate as the portfolio manager buys and sells bonds. While there are several ETFs that target a relatively narrow portion of the yield curve, they still lack the precision and flexibility of defined-maturity bond ETFs.
This is another example of ETFs democratizing the investment landscape. Armed with these innovative solutions, investors have yet another arrow in their quivers to manage their fixed-income allocation amid a low-interest-rate environment. Be sure to monitor the steepness of the yield curve when executing the strategy, and keep in mind that the "roll down" strategy will lose a lot of steam if the yield curve flattens more than expected. As great as it sounds on paper, this strategy is still not a free lunch. The buy-and-hold investor sees price volatility steadily decease as his bond nears maturity. However, the price volatility in the "roll down" strategy stays relatively high, given that it reinvests in longer maturities, which tend to experience larger price fluctuations. The premium earned via the strategy can be considered compensation for assuming slightly longer duration and higher levels of volatility.
What has been sold to many investors, speculators and even desperate Fund Managers is using Bond ETF's to play the old "Roll Down the Yield Curve" Strategy. Here is how it works in case you are not familiar with the strategy.
ROLLING DOWN THE YIELD CURVE
The strategy of "rolling down the yield curve" targets investing in bonds at the steepest part of the curve. After a year or two, the bond is sold and the proceeds are reinvested back up the curve into higher-yielding, longer-maturity bonds. By selling the position well ahead of the actual maturity date, the strategy aims to capture the price increase that results when a bond's yield drops as it "rolls down" the curve (that is, it moves closer to maturity). From there, the process repeats.
To illustrate, we can look at an example based on the yield curve in Exhibit 1. Consider an investor who buys a five-year Treasury paying a 1.5% coupon rate at par value. Fast forward two years, and that original five-year Treasury still yields 1.5%, but at that point it would have three years left to maturity. As can be seen in the yield-curve chart, the Treasury yield at a three-year maturity is 1.05%. Therefore, the price of the originally purchased five-year Treasury (which now also has a maturity of three years) would increase in order to ensure that its yield to maturity aligns with the current yield curve. (Note that, for the sake of simplicity, this example assumes that the yield curve remains stable over the observation period.)
If the Treasury paid a 1.5% coupon at a face value of $100, then after two years the price would have actually risen to $101.35 so that its yield to maturity matches the prevailing market. Recall that the three-year Treasury has a coupon yield of 1.05%. The original five-year Treasury in this example maintains its annual coupon yield of 1.5%, but then faces annual price declines of about $0.45 over the remaining three years until it matures. The yield to maturity balances out to 1.05% after factoring in those future price declines, which of course is equivalent to the yield to maturity that an investor could earn at that time from buying a newly issued three-year Treasury at par.
A buy-and-hold investor who bought at $100 would collect 1.5% per year in coupon payments and receive $100 at maturity. That comes out to a total of $7.50 in interest payments. The "roll down" strategy described in our example, on the other hand, could generate $10.90 in total returns during the same period thanks to locking in price gains and reinvesting into higher-yielding bonds.
YRA HARRIS WARNS "ALL HELL MAY BREAK LOSS!"
Legendary trader Yra Harris who we recently interviewed at the Financial Repression Authority has been pounding the table for some time but just issued this warning:
The flattening of the yield curves in 2016 may lead to all hell breaking loose. WHAT DID I MEAN BY THIS? Grab a glass of scotch or Chuckie B., or some medicinal California and think about what I am going to say. (And, to paraphrase Danny Devito in the War of the Roses, when a person who charges $5,000 an hour offers free advice you might want to listen [humor intended].) In July 2012–the 24th to be exact–the U.S. 2/10 curve was flattening when it appeared that Europe was in a deep crisis. The two-year yields on EU sovereign debt were rapidly rising as the market feared about the viability of the EU and the EURO currency.
The European 2/10 curves were also flattening and when ECB President Mario Draghi issued his famous, NO TABOOS AND WE WILL DO WHATEVER IT TAKES to preserve the EU and the euro, the two-year yields began dropping and the 2/10 curves reversed course and began to steepen. The July 24 low was 117.25 positive slope. This was also the low made in January 2015 when the ECB and the SNB were busy revealing their plans about the EUR/CHF peg and the ECB‘s new QE policy (again, 117.25). As the year comes to an end, the flattening of the U.S. 2/10 curve continues and today we made an intraday low of 119.80. Now I will warn again that because of the lack of liquidity the last few weeks of the year prices can be easily manipulated and/or distorted.
BUT IF THE MARKETS RESUME FLATTENING IN RESPONSE TO GLOBAL ECONOMIC WEAKNESS AMID CHINESE SLOWING OR SOME GEO-POLITICAL EVENT ALL HELL WILL BREAK LOOSE. WHY? Last time the yield curves dramatically flattened in 2007 or 2012 in Europe the central banks, like John Mayall, HAD ROOM TO MOVE. When the U.S. curve inverted in early 2007, the FED FUNDSrate was at 5.25% so the FED could swiftly cut rates in response to an incipient crisis. In Europe,the yields on the two-year notes of the so-called PIIGS were more than 7.0% and thus a dramatic drop in rates could be a positive signal to the markets.
WITH INTEREST RATES AT ZERO IN ALL THE DEVELOPED ECONOMIES WHAT WILL THE KEY POLICY MAKERS DO? A FLATTENING CURVE AT THIS JUNCTURE WOULD PUSH THE FED INTO NEW TERRITORY AND PUT FEAR INTO THE MARKETS.Thus, “ALL HELL WILL BREAK LOOSE” is an inference that the flattening of the curve at the zero bound will signal that the central banks have lost “control.” Will it be on the first close below 117.25? Most probably not but it is certainly an area for investors and traders to be very aware of. That was my point and it needed explanation beyond the alloted time of the Santelli spot. I await any questions or responses.
CONCLUSION
What Yra doesn't say is we now have $2.2 Trillion of troubled High Yield bonds peddled to yield starved investors since the financial crisis which matches 2/3’s of the $3.5 Trillion increase in the Federal Reserves balance sheet during the same period. Additionally, there are well north of $60 Trillion of Bond ETFs out there with anyone guess on how many are playing the "Rolling Down the Yield Curve" Strategy now up against the warning Morningstar so clearly disclaimed: " the "roll down" strategy will lose a lot of steam if the yield curve flattens more than expected."
With serious liquidity issues evident it should be interesting as a potential positioning scramble ensues. It somewhat reminds me of someone shouting "FIRE" in a theater, except this times the theater doors will be barred and the only way out will be to have someone outside take your seat inside! ETF holders may find it easier to sell that old bridge over the East River in Brooklyn than get their money out of their ETFs.
Maybe we will soon hear someone shout "CUSTODIAL RISK!"
|
TIPPING POINTS, STUDIES, THESIS, THEMES & SII
COVERAGE THIS WEEK PREVIOUSLY POSTED - (BELOW)
|
| MOST CRITICAL TIPPING POINT ARTICLES THIS WEEK -Dec 27th, 2015 - Jan 2nd, 2016 |
|
|
|
| TIPPING POINTS - This Week - Normally a Tuesday Focus |
| BOND BUBBLE |
|
|
1 |
| RISK REVERSAL - WOULD BE MARKED BY: Slowing Momentum, Weakening Earnings, Falling Estimates |
|
|
2 |
| GEO-POLITICAL EVENT |
|
|
3 |
| CHINA BUBBLE |
|
|
4 |
| JAPAN - DEBT DEFLATION |
|
|
5 |
EU BANKING CRISIS |
|
|
6 |
13 - Growing Social Unrest
|
12-29-15 |
|
13 |
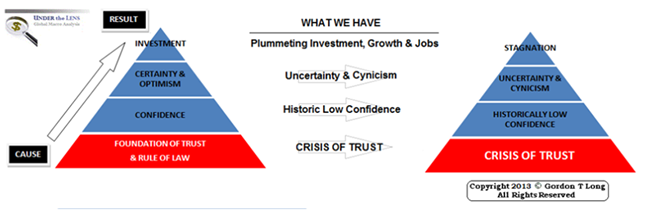
FINANCIAL REPRESSION POLICIES MIRROR
AN ACCELERATING "CRISIS OF TRUST"
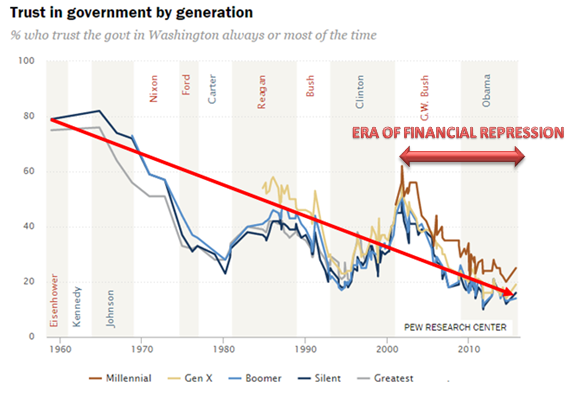
Since the Dot.com Bubble burst the US has accelerated its Macro-Prudential Policies of Financial Repression. PEW Research just released a study which tracks the deterioration in the confidence citizens have in their government.
We have a Crisis of Trust in America and as the charts below show, it has only accelerated with government policies of Financial Repression.
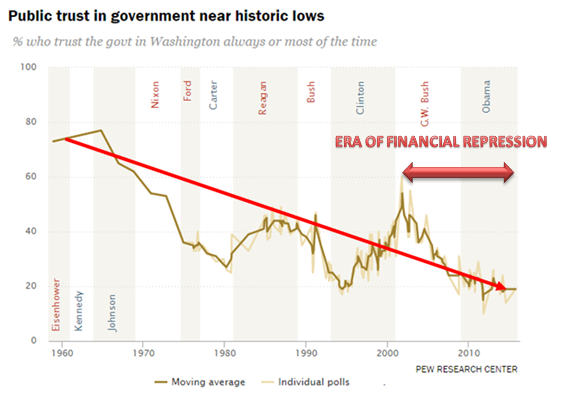
Just 19% of Americans say they "can trust the federal government always or most of the time".
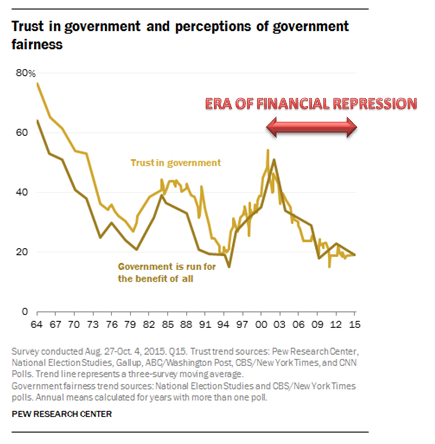
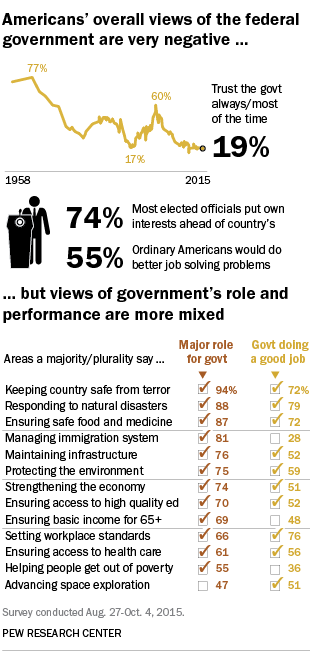
Less than a year ahead of the presidential election, there is widespread discontent with the federal government. A new Pew Research Center report finds deep distrust in government and considerable cynicism about politics and elected officials alike. But despite these negative assessments, majorities believe government does a good job on many issues and want it to have a major role on a wide range of policy areas.
Here are five of PEW's key takeaways from the report:
1 The public’s trust in government remains at historic lows. Today, just 19% say they trust the federal government to do what is right always or most of the time, which is little changed from recent years. Fewer than three-in-ten Americans have expressed trust in government in every major national poll conducted since July 2007 – the longest period of low trust in government seen in more than 50 years.
 While Democrats are more likely than Republicans to say they trust the government, trust remains low across partisan lines: Just 11% of Republicans and Republican-leaning independents say they trust the government, compared with 26% of Democrats and Democratic leaners. (For more on the public’s trust in government, see this interactive.) While Democrats are more likely than Republicans to say they trust the government, trust remains low across partisan lines: Just 11% of Republicans and Republican-leaning independents say they trust the government, compared with 26% of Democrats and Democratic leaners. (For more on the public’s trust in government, see this interactive.)
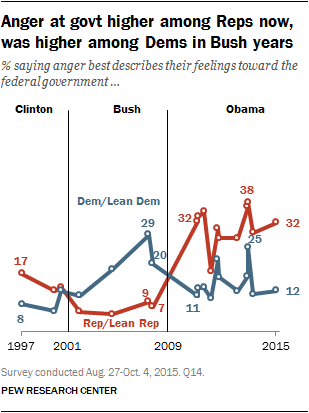
2 As in the past, the public’s feelings about government run more toward frustration than anger. Currently, 57% are frustrated with the federal government; 22% are angry, while 18% are basically content.
Far more Republicans (32%) than Democrats (12%) say they are angry with the government. But higher shares in both parties expressed anger toward government in October 2013, during the partial government shutdown.
While anger at government has been higher among Republicans than Democrats during Barack Obama’s administration, the situation was reversed during George W. Bush’s presidency: In October 2006, 29% of Democrats said they were angry with government, compared with just 9% of Republicans.
3 Despite their widespread cynicism, most Americans give government good ratings in a number of areas. Half or more say the federal government is doing a “very good” or “somewhat good” job in 10 of the 13 governmental functions tested in the survey.
However, the federal government receives particularly low marks in two key areas: Managing the nation’s immigration system and helping people get out of poverty. Nearly seven-in-ten (68%) say the government does a very or somewhat bad job in managing the immigration system; just 28% say it is doing a good job. Ratings are nearly as negative when it comes to the federal government’s efforts to help people get out of poverty: 61% say the government is doing a bad job in this area, while 36% give it a positive assessment.
Majorities say the government should have a major role in dealing with 12 of 13 issues included in the survey.
4 Americans are harshly critical of elected officials. The public views politicians as more selfish and considerably less honest than ordinary Americans. Just 29% say that “honest” describes elected officials very or fairly well, a much smaller share than those who describe the average American as honest (69%).
Most people do say the term “intelligent” describes elected officials very or fairly well (67%). However, just as many view the typical American as intelligent. And when asked if elected officials or ordinary Americans could do a better job of solving the nation’s problems, 55% say ordinary Americans could do better.
While negative opinions of politicians are not new, the perception that elected officials don’t care about what people think is now held more widely than it has been in recent years. Today, 74% say this, compared with a narrower 55% majority who said the same in 2000.
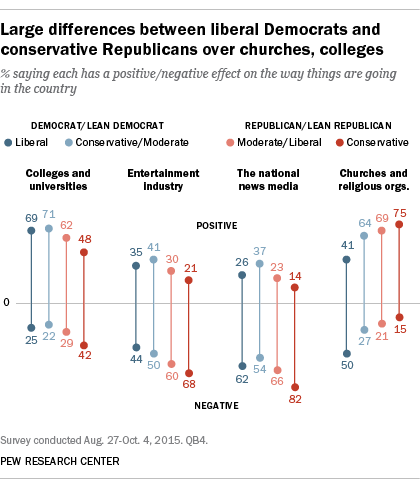
5 Congress is not the only institution the public sees as having a negative influence on how things are going in the country today. Majorities see the national news media (65%) and the entertainment industry (56%) as having a negative impact on the country. By contrast, overwhelming majorities see small businesses (82%) and technology companies (71%) as having a positive impact.
There are substantial partisan and ideological divides in the views of several of these institutions. For example, nearly seven-in-ten liberal Democrats (69%) say colleges and universities have a positive impact on the country, compared with just less than half (48%) of conservative Republicans. Conversely, fully three-quarters of conservative Republicans say that churches and religious organizations have a positive impact on the country, while just 41% of liberal Democrats agree.
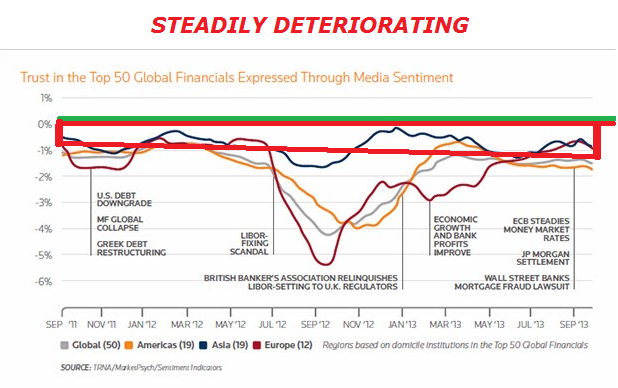
The Thompson-Reuters TRust Index of confidence in the top 50 Global Financial Isnstitutions shows an also very worrying trend deterioration!
CRISIS OF TRUST
As we laid out in the 2013 Thesis Paper "Statism", a Crisis of Trust has a profound impact on the economy and if left unresolved politically for a protracted period will lead to economic stagnation.
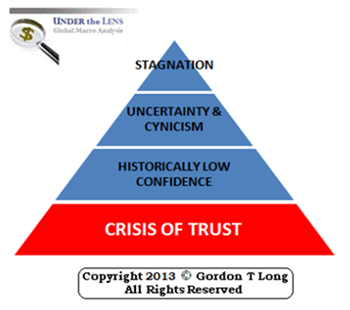
In last years 2015 Thesis Paper: "Fiduciary Failure" we spelled out the crippling level it has now reached in the US. It has only gotten worse and we detail in the 2016 Thesis Paper: Crisis of Trust in The Era of Uncertainty how it is now infecting the global economy.
Sign-up now for your 2016 Thesis Paper: Crisis of Trust in The Era of Uncertainty at the FINANCIAL REPRESSION AUTHORITY
|
| TO TOP |
| MACRO News Items of Importance - This Week |
GLOBAL MACRO REPORTS & ANALYSIS |
|
|
|
US ECONOMIC REPORTS & ANALYSIS |
|
|
|
| CENTRAL BANKING MONETARY POLICIES, ACTIONS & ACTIVITIES |
|
|
|
|
|
|
|
| Market - WEDNESDAY STUDIES |
| STUDIES - MACRO pdf |
|
|
|
| TECHNICALS & MARKET |
12-30-15 |
STUDY |
|
Submitted by Jim Quinn via The Burning Platform blog,
RECAP
-
The S&P 500 stood at 2,063 on November 21, 2014 and currently sits at 2,056, thirteen months later,
-
Expect ZERO returns over the next ten years and a 40% to 55% plunge in the near future,
-
Equity market in the late-stage top formation of the third financial bubble in 15 years,
-
Likelihood of substantially negative 10-12 year real returns should NOT be viewed as worst-case scenarios,
-
Based on the joint behavior of the most reliable leading economic measures (particularly new orders plus order backlogs, minus inventories), widening credit spreads, and clearly deteriorating market internals, our economic outlook has also moved to a guarded expectation of a U.S. recession,
-
Market internals have deteriorated rapidly, with only a few beloved, overvalued, overhyped tech stocks holding up the market.
-
Most stocks are already in a bear market,
-
Based on history current conditions have only been seen at major tops:
- Corporate profits are falling.
- PE ratios are high.
- Consumer spending is anemic.
- The jobs growth narrative is false.
- Real household income is at 1989 levels.
-
“The bigger the top, the steeper the drop.” - Only a few points in history have seen the S&P 500 within 3% of a record high, with both overvaluation and unfavorable market internals during at least 80% of the prior 26-week period. Aside from points in recent months, the other points were major tops in 2007, 2000, 1972, 1969, and 1961.
-
The hinge that supported continued gains was a persistent willingness to speculate, as conveyed by uniformly favorable market internals. That support has dropped away. Ignore that key distinction at enormous risk. The market behavior we’ve observed in recent quarters is fully consistent with an extended top formation.
-
The debt markets (junk bonds) are a flashing red warning light, with credit spreads predictably widening in successively larger spikes
-
The S&P 500 traced out a total return of zero between 2000 and the end of 2011. How? By first losing half its value, then more than doubling, then losing more than half its value, and then doubling again. Across history, extreme valuations have invariably been followed by similar behavior – wide cyclical swings, yet only modest overall returns over the following decade.
You would think investors (muppets) would be grateful for the extended topping process of the stock market, as it has given them the opportunity to exit before the inevitable crash. As CNBC and the rest of the mainstream media spin bullish stories to keep the few remaining mom and pop investors sedated and the millions of passive working Americans invested in their 401ks, the Wall Street rigging machine siphons off billions in ill-gotten gains, while absconding with fees for worthless advice.
Does the average schmuck know the S&P 500 stood at 2,063 on November 21, 2014 and currently sits at 2,056, thirteen months later? Based on the media narrative, we are still in the midst of a raging bull market. John Hussman provides the counterpoint to this narrative with unequivocal factual evidence based upon a hundred years of stock market data and valuations. Anyone investing in today’s market should expect ZERO returns over the next ten years and a 40% to 55% plunge in the near future. And as a cherry on top, a recession has arrived.
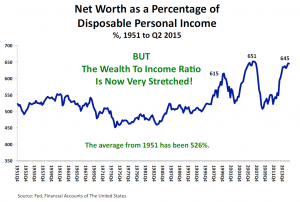
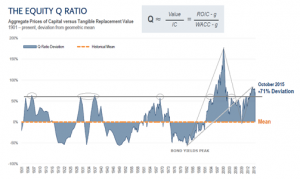
The summary of this outlook is straightforward. I view the equity market as being in the late-stage top formation of the third financial bubble in 15 years. Based on a century of evidence relating the most historically reliable valuation measures to actual subsequent market returns, neither a market plunge of 40-55% over the completion of the current cycle, nor the expectation of zero 10-12 year S&P 500 nominal total returns, nor the likelihood of substantially negative 10-12 year real returns should be viewed as worst-case scenarios – they are all actually run-of-the-mill expectations from current extremes. Based on the joint behavior of the most reliable leading economic measures (particularly new orders plus order backlogs, minus inventories), widening credit spreads, and clearly deteriorating market internals, our economic outlook has also moved to a guarded expectation of a U.S. recession.
The Federal Reserve has encouraged the rampant speculation over the last few years with their trillions in QE gift to Wall Street banks and ZIRP, which allowed the “brilliant” 30 year old Ivy League educated high frequency traders to take the free Fed money and front run their client’s trades and generate guaranteed profits. Of course, ZIRP also forced grandmas throughout the country to acquire a taste for cat food in order to survive. But Ben and Janet are “heroes”, I’m told. What a coincidence that shortly after the QE spigot was turned off on October 29, 2014, the market has gone nowhere. The speculative juices appear to be drying up.
Because speculation tends to be indiscriminate, the most reliable measure of a robust willingness to speculate is the uniformity of market action across a broad range of individual stocks and security types. An overvalued market populated with speculators who still have the bit in their teeth will tend to hold up or advance further despite valuation extremes. Because of the Federal Reserve’s relentless and intentional encouragement of speculation in the half-cycle since 2009, even measures of overvalued, overbought, overbullish extremes – which had historically been followed almost invariably by market collapses in prior market cycles – were followed instead by further market advances.
John Hussman, inconveniently for those of a bullish ilk, notes that market internals have deteriorated rapidly, with only a few beloved, overvalued, overhyped tech stocks holding up the market. Most stocks are already in a bear market. Corporate profits are falling. PE ratios are high. Consumer spending is anemic. The jobs growth narrative is false. Real household income is at 1989 levels. Based on history, current conditions have only been seen at major tops. I’m sure this time will be different and Cramer, along with all the highly paid Wall Street shills, will be right.
Now that market internals have clearly deteriorated following overvalued, overbought, overbullish extremes, with reliable valuation measures at obscene levels and emerging economic weakness, a century of history suggests that the stock market is vulnerable to the risk of severe losses. Investors should not assume that the “support” that keeps losses relatively shallow during a drawn-out topping process will persist. There’s some truth in the old saying “the bigger the top, the steeper the drop.” Only a few points in history have seen the S&P 500 within 3% of a record high, with both overvaluation and unfavorable market internals during at least 80% of the prior 26-week period. Aside from points in recent months, the other points were major tops in 2007, 2000, 1972, 1969, and 1961.
When you talk to your relatives, neighbors and coworkers they all act like they are buy and hold long term investors. They are either lying or oblivious. Someone who is 60 years old and has accumulated a significant 401k nest egg invested in stocks can not afford a 50% haircut in their retirement portfolio. Anyone with a significant amount in the stock market will have to have balls of steel to not panic as their life savings is cut in half – AGAIN. Three times in fifteen years is pretty hard to swallow. The debt markets (junk bonds) are a flashing red warning light. To not heed the warnings of the market would be foolish. Hussman couldn’t be any clearer, just as he was in 2000 and 2007.
I really do implore investors who could not comfortably ride out a market collapse similar to 2000-2002 or 2007-2009, or who rely on their assets to finance near-term spending plans, to shift their risk exposure down to a level that could tolerate that outcome. Understand that while valuations have been hostile for years, and while overvalued, overbought, overbullish conditions have repeatedly emerged in the recent half-cycle without effect, the hinge that supported continued gains was a persistent willingness to speculate, as conveyed by uniformly favorable market internals. That support has dropped away. Ignore that key distinction at enormous risk. The market behavior we’ve observed in recent quarters is fully consistent with an extended top formation. With credit spreads predictably widening in successively larger spikes, that formation appears increasingly vulnerable to a steep vertical break of prior support.
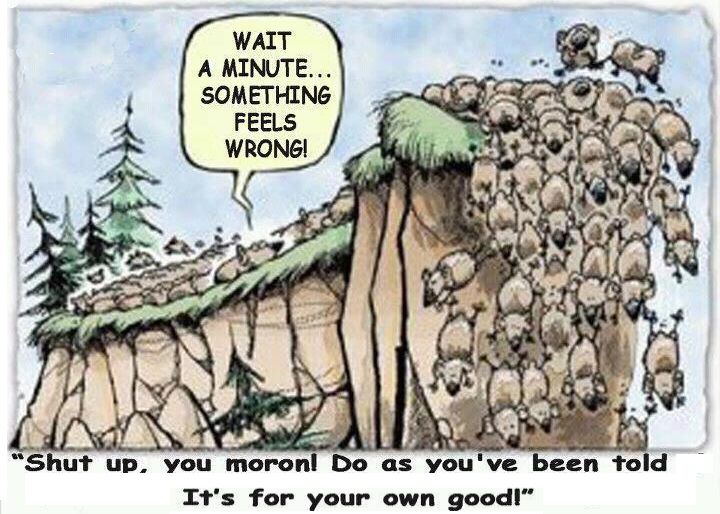
Robert Prechter perceptively notes that investors act in a herd like manner thinking that because the herd is still invested in the market and has not sensed danger yet, it must be safe. Investors are lazing around the waterhole like unsuspecting gazelles. This herd will be running for their lives in the near future, as danger is lurking.
Still, we doubt that most speculators think about the decision to accept market exposure in such a systematic way. On that point, Robert Prechter of EWI offered a brilliant perspective last week to describe the typical behavior of speculators. He observed, “In neither case – buying or selling – is there any thought about taking on risk, rationally or otherwise. In both cases, they are unconsciously acting to reduce risk, thanks to the emotionally satisfying impulse to herd. Herds act to gain sustenance or avoid danger. Gazelles may lope together toward the water hole or dash in a herd from predators. The goal, albeit unconscious, of both types of actions is to reduce risk. Likewise, in market advances speculators herd as if trying to gain sustenance; and in market declines they herd as if trying to avoid getting killed… Subjectively, i.e. in their own minds, speculators perceive greater risk as less risk and less risk as greater risk. That is why they buy in uptrends and sell in downtrends. In the former case, they behave as if the herd is leading them to sustenance, and in the latter case they behave as if the herd is leading them away from danger. Ironically, the truth is wholly the opposite.”
If you have an ounce of common sense, ability to think critically, and appreciation for risk, you should leave the herd now before the inevitable stampede. Staying with the herd as it heads for the cliff is not an effective strategy.
At present, we observe a herd at the peak of a valuation cliff, where an increasing proportion of the herd is backing away. It’s increasingly urgent to dig in one’s hooves to keep from dashing over the edge. We can do little for those who insist on remaining in full gallop, imagining that sustenance awaits them ahead.
After experiencing two Federal Reserve induced booms and busts in the last fifteen years, you would think people would learn. But the true lesson of history is that people never learn from the lesson of history.
How did the S&P 500 trace out a total return of zero between 2000 and the end of 2011? By first losing half its value, then more than doubling, then losing more than half its value, and then doubling again. Across history, extreme valuations have invariably been followed by similar behavior – wide cyclical swings, yet only modest overall returns over the following decade.
Anyone fully invested in the stock market at this point in time is delusional and mad. If they think they can sense danger before the rest of the herd and exit once the stampede starts, they are badly mistaken. Just as they were in 2000 and 2007. Now is the time to regain your senses and stop playing in this rigged Wall Street game.
After years of Fed-induced yield-seeking speculation that has driven equity valuations to the second most extreme point of overvaluation in history (and the single most extreme point on the basis of median valuations), investors have somehow convinced themselves that this time will be different; that this time the market will maintain at a permanently high plateau. That belief is nothing new – it’s the same delusion that investors have held at speculative peaks across history, refusing to accept the familiar signs of danger until the equally familiar losses were conclusively in hand.
“Men, it has been well said, think in herds; it will be seen that they go mad in herds, while they only recover their senses slowly, one by one.”
Charles Mackay, Extraordinary Popular Delusions and the Madness of Crowds
Read Hussman’s Weekly Letter |
| |
| COMMODITY CORNER - AGRI-COMPLEX |
|
|
|
|
|
|
|
| THESIS - Mondays Posts on Financial Repression & Posts on Thursday as Key Updates Occur |
| 2015 - FIDUCIARY FAILURE |
2015 |
THESIS 2015 |
 |
| 2014 - GLOBALIZATION TRAP |
2014 |
|
|
2013 - STATISM |
2013-1H
2013-2H |
|
|
2012 - FINANCIAL REPRESSION |
2012
2013
2014 |
|
|
FINANCIAL REPRESSION |
12-28-15 |
|
|
Citi’s Chief Economist Willem Buiter recently wrote the following regarding ECB’s QE policy failure. The FRA felt it would be instructional if US economic graphics (Charts #1 to #6) were added to highlight that it isn’t just an EU problem, but rather a failed policy initiative that has now become counter productive and systemically dangerous if the ECB and BOJ were to continue with it and if the Fed & BOE retreat once again to it.
"We believe that a common factor in the relatively low response of real economic activity to changes in asset prices and yields is probably the fact that the euro area remains highly leveraged. The total debt of households, non-financial enterprises and the general government sector as a share of GDP is higher now than it was at the beginning of the GFC. (Charts 1)
CHART #1
There has been some shift from the private sector to the public sector, but the overall debt burden remains unprecedentedly high for an economy in peacetime (and for which the debt incurred during the last major war (1939-1945) has long since been worked off). (Chart #2)
CHART #2
The wealth effect of higher stock prices appears to do little to boost private consumer expenditure (Chart #3)
CHART #3

and the lift given by higher stock prices to ‘Tobin’s q’ does not appear to have stimulated private capital expenditure much. (Chart 4)
CHART #4
The weaker external value of the euro has clearly increased profit margins in exporting and import-competing industries and may have boosted the stock market valuations of internationally active Eurozone-listed companies, but its effect on the volumes of exports and imports appears to be moderate (in part because a number of other countries are pinning their hopes on generating a bounce in inflation and activity through weaker exchange rates, too). (Chart #5)
CHART #5
Extremely low interest rates have boosted residential mortgage borrowing in Germany and caused German house prices to rise at a, by German standards, alarming year-on-year rate of six percent during several months in 2015.
- Excessive indebtedness means households save much of any increase in disposable income in an attempt to pay down the debt.
- Highly indebted governments, prompted by necessity (limited market access) and/or by the constraints of the Stability and Growth Pact, are less likely to cut taxes or to boost public spending on real goods and services when lower debt service costs raise their disposable incomes.
- Corporations, even if they are not debt-constrained, are unlikely to boost investment when interest rates go down and the cost of capital falls because of persistent excess capacity amid an uncertain outlook for top-line growth and profits.
- Profits generated by favorable movements in asset prices (including the exchange rate) are distributed to shareholders (who save a large share of this) and used for share buybacks or debt repayment.
To the extent that monetary policy has had an effect on real activity, and will have some incremental effect on activity, it may not be entirely sustainable. This is because part of the effect has been by bringing forward demand from the future, such as major purchases, including for cars or construction.
That suggests that monetary policy, even if and when it has been effective in stimulating activity, will run into diminishing returns even in sustaining the levels of activity it helped to boost.
CONCLUSION
Quantitative Easing was possibly a viable policy initiative immediately following the 2008 Financial Crisis. However, it was sustained much too long and the global distortions it has created has left the world in a highly fragile state. The current economic state is both unstable and critically exposed to an unexpected shock.
The central banks are trapped! They can neither stimulate growth nor reduce the global credit/debt levels and leverage without catapulting the global economy into an economic depression.

The Central Banks and Citigroup now see the only way out of this trap to be more aggressive policy initiatives like OMF and NIRP!
|
2011 - BEGGAR-THY-NEIGHBOR -- CURRENCY WARS |
2011
2012
2013
2014 |
|
|
2010 - EXTEND & PRETEND |
|
|
|
| THEMES - Normally a Thursday "Themes" Post & a Friday "Flows" Post |
I - POLITICAL |
|
|
|
CENTRAL PLANNING - SHIFTING ECONOMIC POWER - STATISM

MACRO MAP - EVOLVING ERA OF CENTRAL PLANNING
|
G |
THEME |
|
| - - CRISIS OF TRUST - Era of Uncertainty |
G |
THEME |
|
- - CORRUPTION & MALFEASANCE - MORAL DECAY - DESPERATION, SHORTAGES. |
US |
THEME PAGE |
|
| - - SECURITY-SURVEILLANCE COMPLEX - STATISM |
G |
THEME |
|
| - - CATALYSTS - FEAR (POLITICALLY) & GREED (FINANCIALLY) |
G |
THEME |
|
II-ECONOMIC |
|
|
|
| GLOBAL RISK |
|
|
|
| - GLOBAL FINANCIAL IMBALANCE - FRAGILITY, COMPLEXITY & INSTABILITY |
G |
THEME |
|
| - - SOCIAL UNREST - INEQUALITY & A BROKEN SOCIAL CONTRACT |
US |
THEME |
|
| - - ECHO BOOM - PERIPHERAL PROBLEM |
M |
THEME |
|
| - -GLOBAL GROWTH & JOBS CRISIS |
|
|
|
| - - - PRODUCTIVITY PARADOX - NATURE OF WORK |
|
THEME |
MA w/ CHS |
| - - - STANDARD OF LIVING - EMPLOYMENT CRISIS, SUB-PRIME ECONOMY |
US |
THEME |
MA w/ CHS |
III-FINANCIAL |
|
|
|
| FLOWS -FRIDAY FLOWS |
MATA
RISK ON-OFF |
THEME |
w/ R Duncan
|
| CRACKUP BOOM - ASSET BUBBLE |
12-31-15 |
THEME |
|
THIS CHART IS REGULARLY IN GORDONTLONG.COM'S MONTHLY MATA REPORT
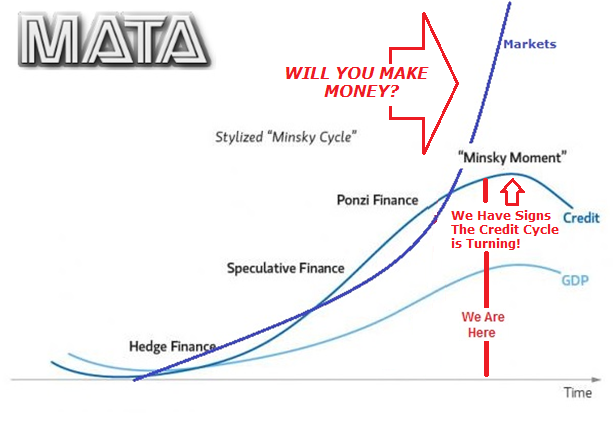
THE QUESTION TO CONSIDER IS HOW YOU WILL MAKE MONEY WHEN THE CRACK-UP BOOM ARRIVES?
... OR HAS IT ALREADY ARRIVED?
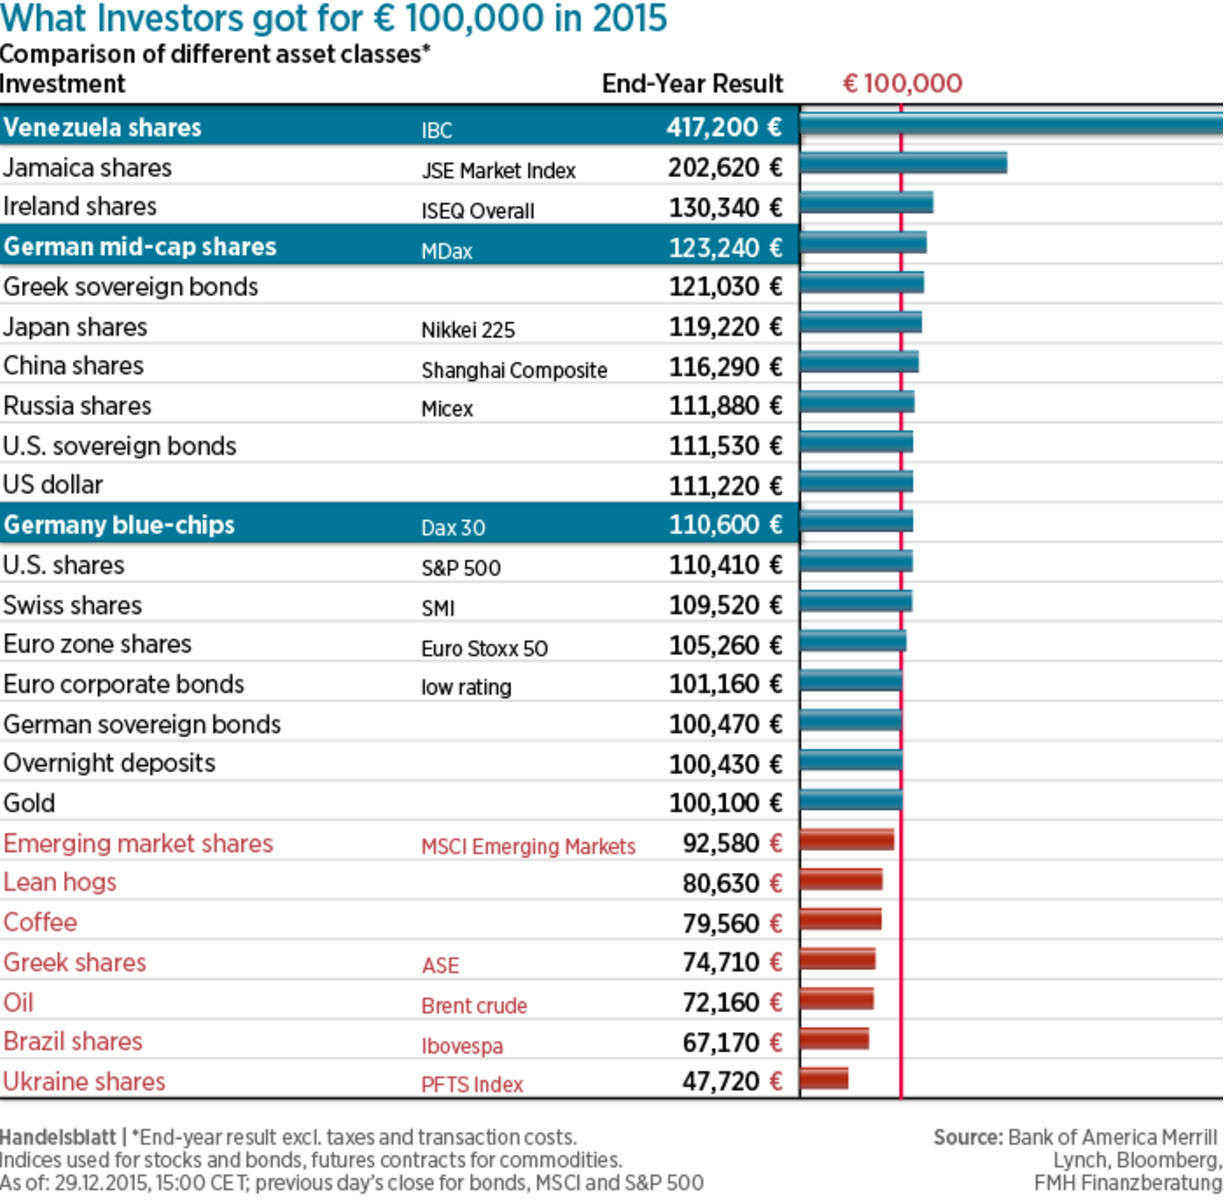
1- VENEZUELA
As Zero Hedge Reports: Consider Venezuela
It's that time of year again. When hindsight is 20/20 and coulda/woulda/shoulda gives way to reality. With the US equity market barely able to keep its head above green water, a look around the world shows investors could have done a lot better (or not).
In fact, as Handelsblatt shows, the best investment in the world in 2015 would have been - drum roll please - Venezuelan stocks!
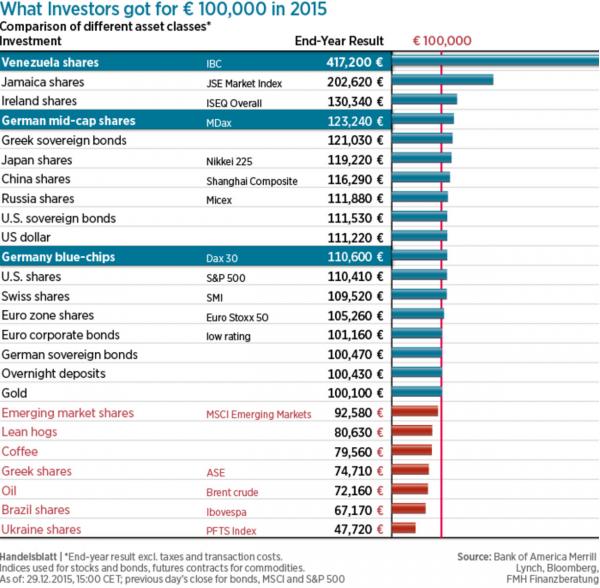
Note - these returns are from a EUR-denominated persepctive
So - that proves it - buying stocks during hyperinflation "works" and protects your purchasing power, right?
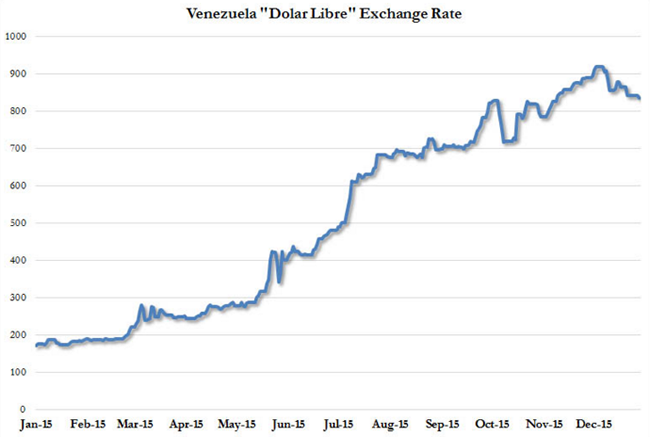
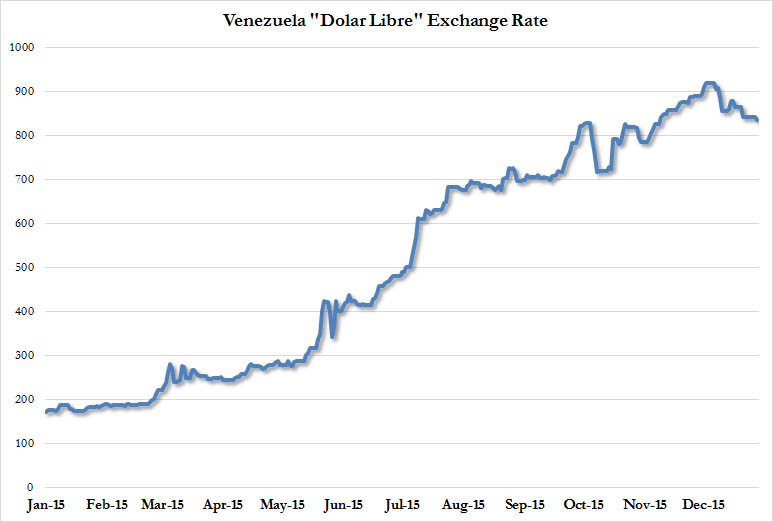
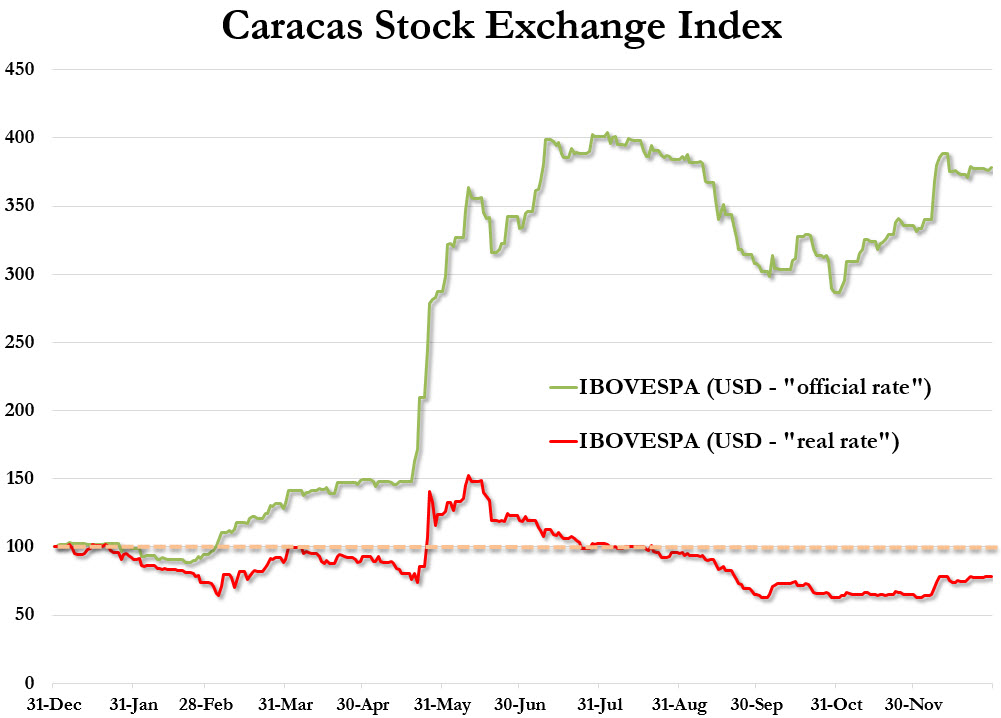
Not so fast! While Venezuela's official spot Bolivar rate has been flat at 6.2921 all year as Maduro dreaded the admission that his nation is in utter collapse, the "real" exchange rate - or 'Dolar Libre' Rate - has been crashing...
Which means, if you wanted to "invest" in Caracas Stocks last year (by moving your USD into Bolivars, buying stock, then moving your "gains" back into USDs to bring home and celebrate), things look a lot different.
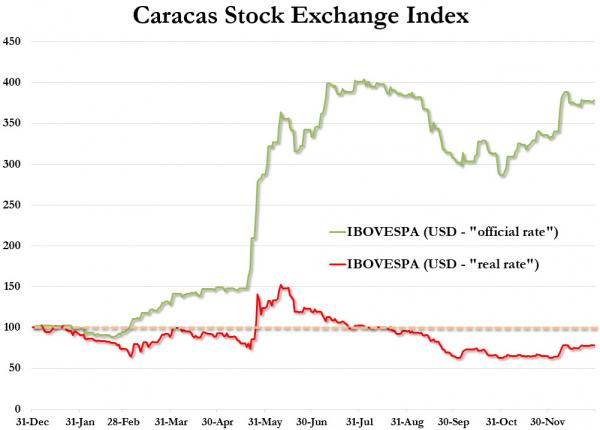
From a 287% gain, you would have actually lost 22% of your initial USD stake!
So sorry, hyperinflation does not pay after all!
Still, The Fed, ECB, BoJ, PBOC will keep playing the 'inflate' and debase game until they are all proven wrong.
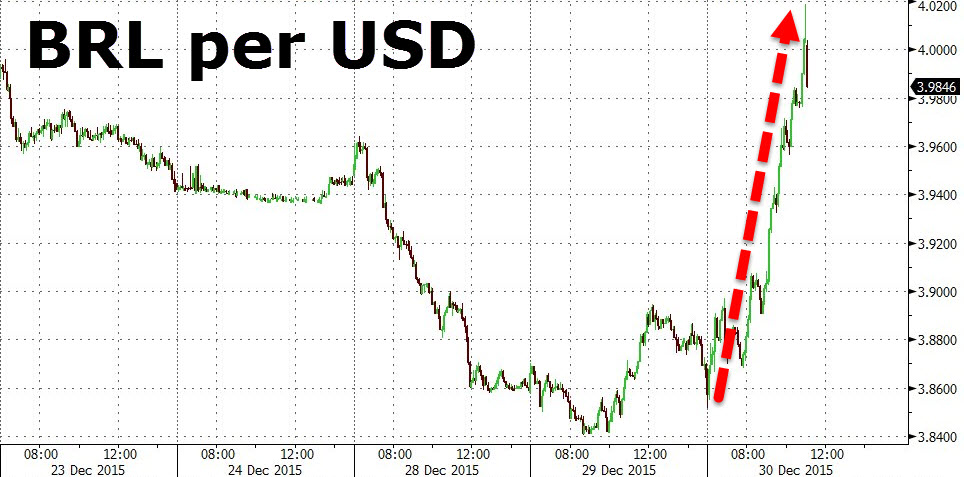
2- BRAZIL
Let's also consider Brazil. Brazil was an investment darling as hot money flooded into Brazil prior to the 2008 Financial Crisis and the Commodity boom exploded with China's emergence as a global manufacturing giant.
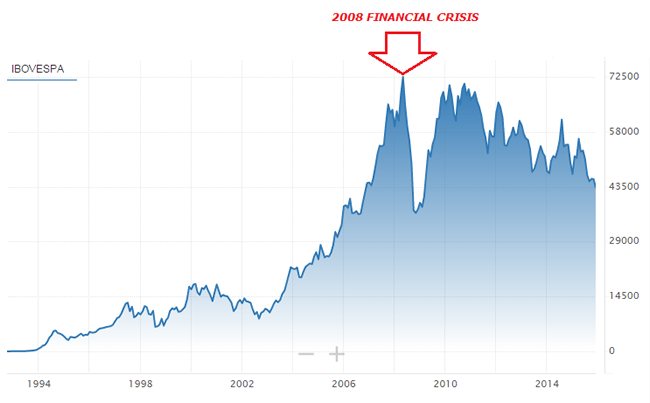
However, things haven't been so good since the Financial Crisis and 2010 as China began to slow. Recently things have only gotten worse as government corruption and failed policies surface.
Following recent strength on the heels of hope for a new finance minister, news that Ruosseff has sent the minimum-wage-hike Bill to Congress appears to have crushed the hype of any fiscal rectitude and sent Real tumbling. Down over 4% - the most since September 2011 - BRL is back above 4.00 per USD, giving up all the recent gains.
Broad weakness in EMFX...

Seems to have been exacerbated by:
- *BRAZIL ROUSSEFF SENDS BILLS ON CIVIL SERVANT WAGES TO CONGRESS
A Bill that could cost BRL 4.77 billion, wrecking hopes of any improvment in the fiscal situation. As Bloomberg reports,
Brazil’s bigger-than-estimated minimum wage increase and potential credit expansion make it harder for govt to control around 11% on year inflation and cut budget gap, Marcelo Schmitt, portfolio manager at investment firm Sul America, says in a phone interview.
These initial policy steps after Barbosa replacing Levy as finance minister are concerning, says Schmitt.
And so...
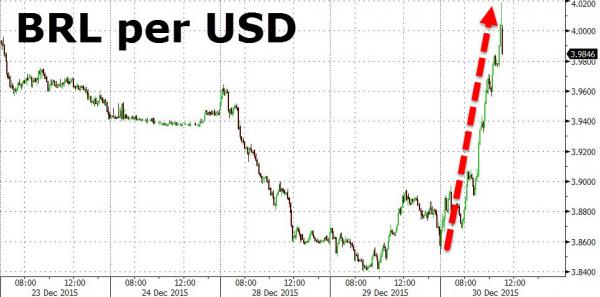
This is the biggest drop in BRL since September 2011.
Charts: Bloomberg
HOW HAVE BRAZILIANS DONE AFTER THE BIG RUN UP WHEN DENOMINATED IN "BOGUS" USD?
THE DEVASTATION - FROM 65 TO 20!
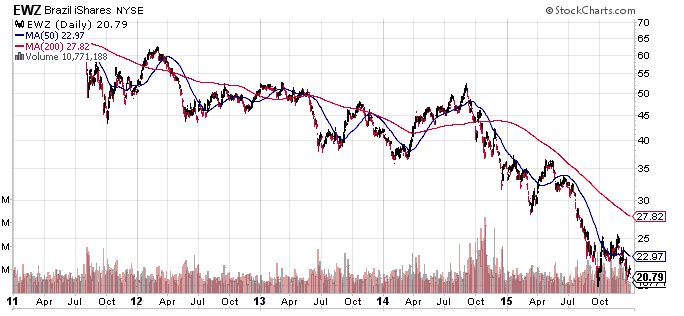
A CASCADING CRACK-UP BOOM
The Crack-Up boom is already underway in many of the peripheal nations of the world. It is more about a cascading series of events. The story in all the peripherals is similar to both Venezuela and Brazil. The only way to make Money in the Crack-up Boom is in the US$, remembering the US Dollar will be the last to fall while globalized Crack-Up Boom is underway. However, the US$ will eventually fall.
It may be subtle but what is happening is Emerging Market Wealth is being pillaged around the world via "Exorbitant Privelege" and a fictitionally valued US$. This is the greatest "Debt for Equity" Swap in history. M& A activity has exploded as overvalued US stocks (due to buybacks and borrowing to pay dividends) is used as "currency" in this M&A binge.
The real question is where is the crack-up boom occurring today and most importantly, how will you keep your wealth after the Cascading Crack-up Boom ends.
|
| SHADOW BANKING - LIQUIDITY / CREDIT ENGINE |
M |
THEME |
|
| GENERAL INTEREST |
|
|
|
| STRATEGIC INVESTMENT INSIGHTS - Weekend Coverage |
|
|
|
|
RETAIL - CRE
|
|
SII |
|
US DOLLAR
|
|
SII |
|
YEN WEAKNESS
|
|
SII |
|
OIL WEAKNESS
|
|
SII |
|
| TO TOP |
| |
Read More - OUR RESEARCH - Articles Below

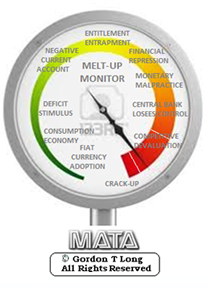
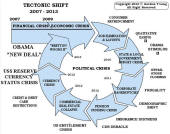
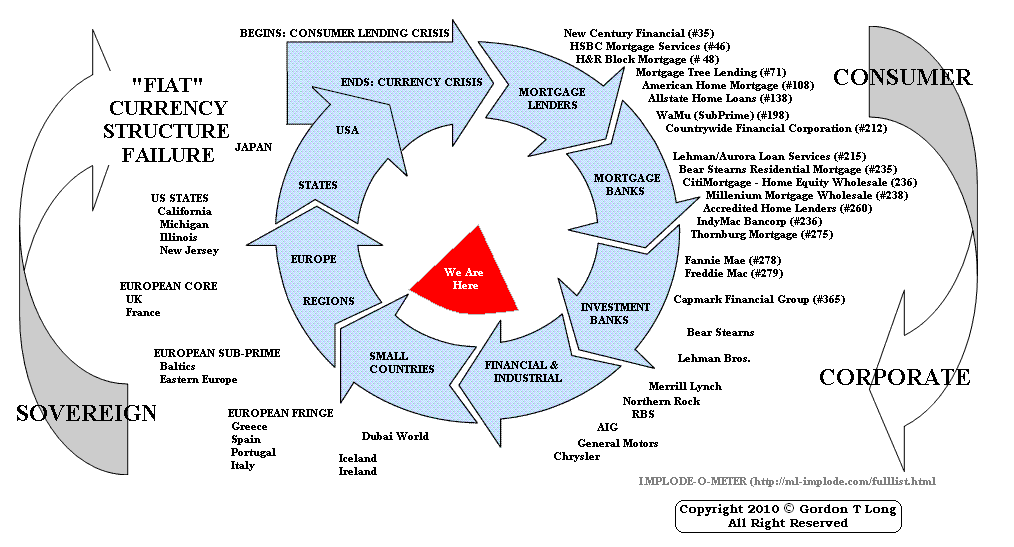
Tipping Points Life Cycle - Explained
Click on image to enlarge
 |
YOUR SOURCE FOR THE LATEST
GLOBAL MACRO ANALYTIC
THINKING & RESEARCH
|
�
|


