|
JOHN RUBINO'SLATEST BOOK |
||||||||||||||||||||||||||||||||||||||||||||||||||||||||||||||||||||||||||||||||||||||||||||||||||||||||||||||||||||||||||||||||||||||||||||||||||||||||||||||||||||||||||||||||||||||||||||||||||||||||||||||||||||||||||||||||||||||||||||||||||||||||||||||||||||||||||||||||||||||||||
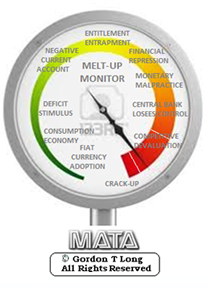
"MELT-UP MONITOR "
Meltup Monitor: FLOWS - The Currency Cartel Carry Cycle - 09 Dec 2013 Meltup Monitor: FLOWS - Liquidity, Credit & Debt - 04 Dec 2013 Meltup Monitor: Euro Pressure Going Critical - 28- Nov 2013 Meltup Monitor: A Regression-to-the-Exponential Mean Required - 25 Nov 2013
|

![]()
"DOW 20,000 "
Lance Roberts Charles Hugh Smith John Rubino Bert Dohman & Ty Andros
|

HELD OVER
Currency Wars
Euro Experiment
Sultans of Swap
Extend & Pretend
Preserve & Protect
Innovation
Showings Below
"Currency Wars "
|


"SULTANS OF SWAP" archives open ACT II ACT III
ALSO Sultans of Swap: Fearing the Gearing! Sultans of Swap: BP Potentially More Devistating than Lehman! |

"EURO EXPERIMENT"
archives open EURO EXPERIMENT : ECB's LTRO Won't Stop Collateral Contagion!
EURO EXPERIMENT: |

![]()
"INNOVATION"
archives open |

"PRESERVE & PROTE CT"
archives open |

RECAP
Weekend Dec. 13th, 2015
Follow Our Updates
onTWITTER
https://twitter.com/GordonTLong
ARCHIVES
| DECEMBER | ||||||
| S | M | T | W | T | F | S |
| 1 | 2 | 3 | 4 | 5 | ||
| 6 | 7 | 8 | 9 | 10 | 11 | 12 |
| 13 | 14 | 15 | 16 | 17 | 18 | 19 |
| 20 | 21 | 22 | 23 | 24 | 25 | 26 |
| 27 | 28 | 29 | 30 | 31 | ||
KEY TO TIPPING POINTS |
| 1- Bond Bubble |
| 2 - Risk Reversal |
| 3 - Geo-Political Event |
| 4 - China Hard Landing |
| 5 - Japan Debt Deflation Spiral |
| 6- EU Banking Crisis |
| 7- Sovereign Debt Crisis |
| 8 - Shrinking Revenue Growth Rate |
| 9 - Chronic Unemployment |
| 10 - US Stock Market Valuations |
| 11 - Global Governance Failure |
| 12 - Chronic Global Fiscal ImBalances |
| 13 - Growing Social Unrest |
| 14 - Residential Real Estate - Phase II |
| 15 - Commercial Real Estate |
| 16 - Credit Contraction II |
| 17- State & Local Government |
| 18 - Slowing Retail & Consumer Sales |
| 19 - US Reserve Currency |
| 20 - US Dollar |
| 21 - Financial Crisis Programs Expiration |
| 22 - US Banking Crisis II |
| 23 - China - Japan Regional Conflict |
| 24 - Corruption |
| 25 - Public Sentiment & Confidence |
| 26 - Food Price Pressures |
| 27 - Global Output Gap |
| 28 - Pension - Entitlement Crisis |
| 29 - Central & Eastern Europe |
| 30 - Terrorist Event |
| 31 - Pandemic / Epidemic |
| 32 - Rising Inflation Pressures & Interest Pressures |
| 33 - Resource Shortage |
| 34 - Cyber Attack or Complexity Failure |
| 35 - Corporate Bankruptcies |
| 36 - Iran Nuclear Threat |
| 37- Finance & Insurance Balance Sheet Write-Offs |
| 38- Government Backstop Insurance |
| 39 - Oil Price Pressures |
| 40 - Natural Physical Disaster |
Reading the right books?
No Time?
We have analyzed & included
these in our latest research papers Macro videos!
OUR MACRO ANALYTIC
CO-HOSTS
John Rubino's Just Released Book
Charles Hugh Smith's Latest Books


Our Macro Watch Partner
Richard Duncan Latest Books
MACRO ANALYTIC
GUESTS
F William Engdahl


OTHERS OF NOTE
Book Review- Five Thumbs Up
for Steve Greenhut's Plunder!


![]()
TODAY'S TIPPING POINTS
|
Have your own site? Offer free content to your visitors with TRIGGER$ Public Edition!
Sell TRIGGER$ from your site and grow a monthly recurring income!
Contact [email protected] for more information - (free ad space for participating affiliates).
HOTTEST TIPPING POINTS |
Theme Groupings |
||
We post throughout the day as we do our Investment Research for: LONGWave - UnderTheLens - Macro
|
|||
|
MOST CRITICAL TIPPING POINT ARTICLES TODAY
|
|
||
| MOST CRITICAL TIPPING POINT ARTICLES THIS WEEK -Dec 6th, 2015 - Dec 12th, 2015 | |||
| 20 - RISING US Dollar | 12-08-15 | 20 | |
39 - FALLING Oil Price Pressures |
12-08-15 | 39 |
|
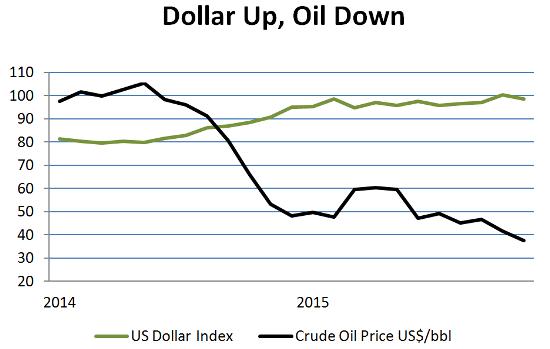
Falling Oil + Rising Dollar= Crisis For A Whole Lot Of Peopleby John Rubino on December 7, 2015 Oil is plunging again, this time in the wake of OPEC’s inability to limit its members’ production. The US dollar, meanwhile, is up on the divergence between Fed tightening and ECB/BoJ/BoC easing.
This widening gap is a perfect storm for the many, many entities that have borrowed dollars to speculate in foreign currencies or drill for oil. Some examples:
To summarize, the world is entering a classic credit crunch, in which lending dries up for marginal borrowers first before tightening for core entities like multinational corporations and developed world governments. And it’s just beginning. Most of today’s crises evolved with oil considerably higher and the dollar somewhat lower, so current conditions are actually a lot worse than those that, for instance, caused emerging market debt issuance to evaporate and shoved Brazil into existential crisis. And since oil overproduction will likely to continue while the differences in central bank policies are etched in stone for the next few months at least, it’s possible that the performance gap between oil and the dollar will widen going forward. This will turbo-charge today’s crises and add a few more, as oil producing US states hit financial walls and big chunks of the developing world follow Brazil down the drain.
|
|||
| TO TOP | |||
| MACRO News Items of Importance - This Week | |||
GLOBAL MACRO REPORTS & ANALYSIS |
|||
US ECONOMIC REPORTS & ANALYSIS |
|||
| CENTRAL BANKING MONETARY POLICIES, ACTIONS & ACTIVITIES | |||
| Market | |||
| TECHNICALS & MARKET |
|
||
| STUDIES - MACRO pdf | |||
WHAT BUYBACKS HAVE HIDDEN
|
12-09-15 | ||
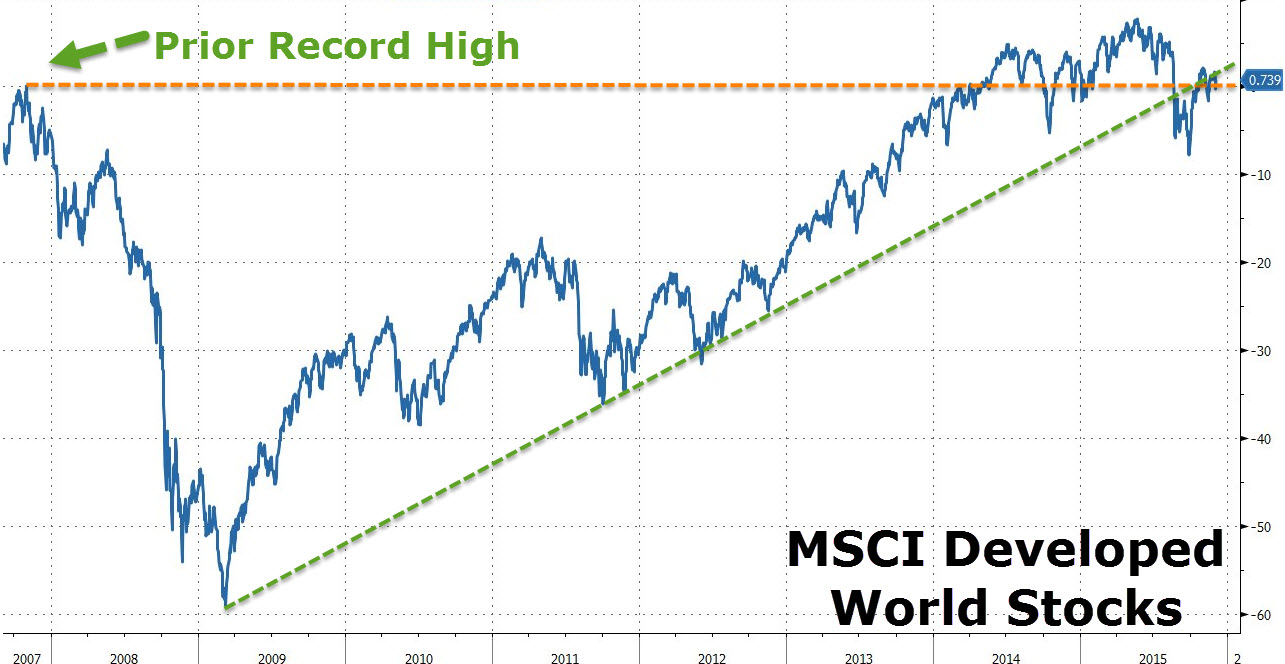
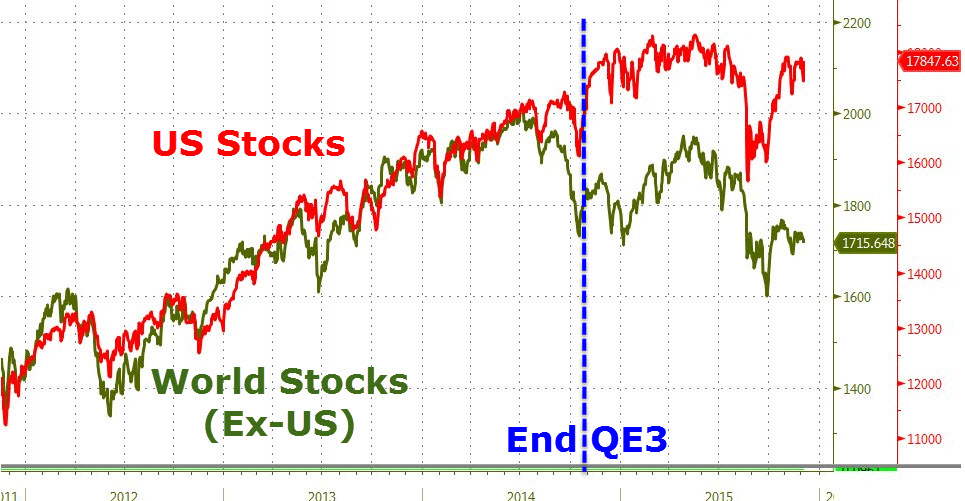
In 8 Years, Developed Market Stocks Have Gained NothingGlobal equity markets, as measured by the MSCI Developed World index, are above the lows hit in early October but remain on a downtrend that began after markets peaked at the end of May this year. As SocGen's Andrew Lapthorne notes, the current level is now only just above where the index stood at the beginning of 2013 and less than 1% above the 2007 peak. In other words, as he warns, "the equity market has run out of momentum," and the 'bill' for the debt overhang is coming due.
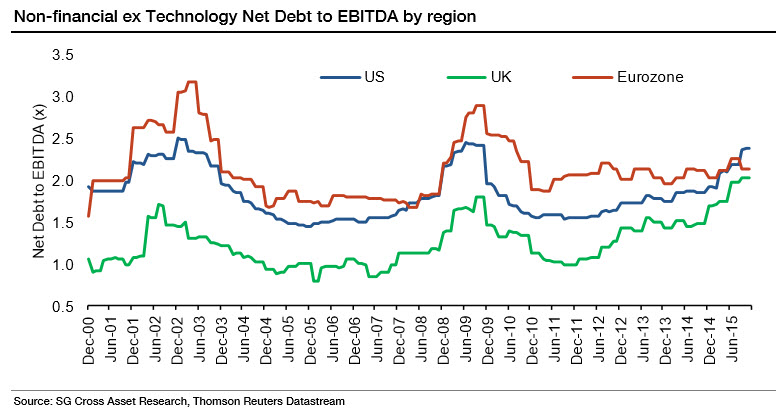
The recovery since 2007 has been very one-sided with only Denmark, Switzerland and the US indices exceeding their October 2007 US dollar price levels. The UK is down 34% in US dollar terms and the MSCI Eurozone is 40% down. The reasons for this weak performance is fairly clear, unlike Japan neither the UK or Eurozone have experienced an earnings recovery in either US dollar terms or in local currency terms. Profits in both regions are still 45-55% down from the 2007 high according to MSCI reported profits. The Eurozone of course has many problems, but at least Eurozone companies have not been boosting leverage as a consequence of disappointing profits, as is the case in the US and apparently the UK as well! As we have remarked upon on numerous occasions, the US equity market has been boosting leverage with record levels of debt-financed share buybacks, resulting in a significant increase in leverage among US corporates. However with all the focus on the US, many investors may have missed the major corporate debt problem now emerging in the UK stock market. Devoid of the headline-grabbing buybacks, many may not have noticed that both nominal net debt and net debt to EBITDA have never been higher in the UK.
The bulk of that increase has come from a huge rise in Mining sector debt at a time when profits have collapsed, but leverage ratios in other sectors are also elevated. The US is not the only market now facing a corporate debt overhang. Source: SocGen |
|||
| COMMODITY CORNER - AGRI-COMPLEX | PORTFOLIO | ||
| SECURITY-SURVEILANCE COMPLEX | PORTFOLIO | ||
| THESIS - Mondays Posts on Financial Repression & Posts on Thursday as Key Updates Occur | |||
| 2015 - FIDUCIARY FAILURE | 2015 | THESIS 2015 |  |
| 2014 - GLOBALIZATION TRAP | 2014 |  |
|
 |
|||
|
2013 2014 |
 |
||
Brett Rentmeester Outlines:APPROACHES TO SOLVING YIELD CHASING& HIGH VALUATION RISKS
|
|||
2011 2012 2013 2014 |
 |
||
| THEMES - Normally a Thursday Themes Post & a Friday Flows Post | |||
I - POLITICAL |
|||
| CENTRAL PLANNING - SHIFTING ECONOMIC POWER - STATISM | THEME | ||
- - CORRUPTION & MALFEASANCE - MORAL DECAY - DESPERATION, SHORTAGES. |
THEME |  |
|
| - - SECURITY-SURVEILLANCE COMPLEX - STATISM | M | THEME | |
| - - CATALYSTS - FEAR (POLITICALLY) & GREED (FINANCIALLY) | G | THEME | |
II-ECONOMIC |
|||
| GLOBAL RISK | |||
| - GLOBAL FINANCIAL IMBALANCE - FRAGILITY, COMPLEXITY & INSTABILITY | G | THEME | |
| - - SOCIAL UNREST - INEQUALITY & A BROKEN SOCIAL CONTRACT | US | THEME | |
| - - ECHO BOOM - PERIPHERAL PROBLEM | M | THEME | |
| - -GLOBAL GROWTH & JOBS CRISIS | |||
| - - - PRODUCTIVITY PARADOX - NATURE OF WORK | THEME | MACRO w/ CHS |
|
| - - - STANDARD OF LIVING - EMPLOYMENT CRISIS, SUB-PRIME ECONOMY | US | THEME | MACRO w/ CHS |
| STANDARD OF LIVING - SUB-PRIME ECONOMY | US | THEME | MACRO w/ CHS |
STANDARD OF LIVING - SUB-PRIME ECONOMY
|
US | THEME | MACRO w/ CHS |
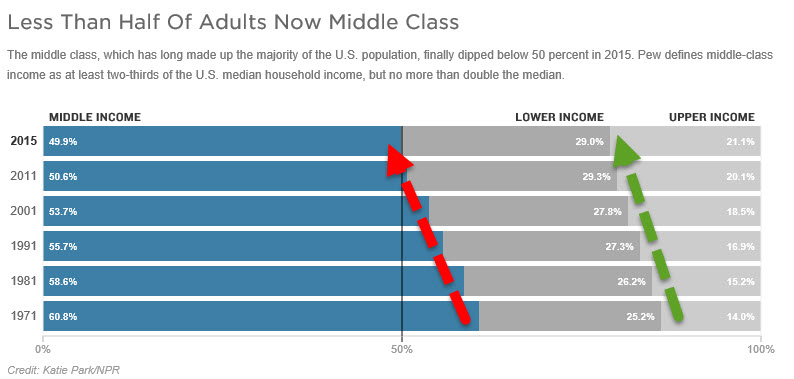
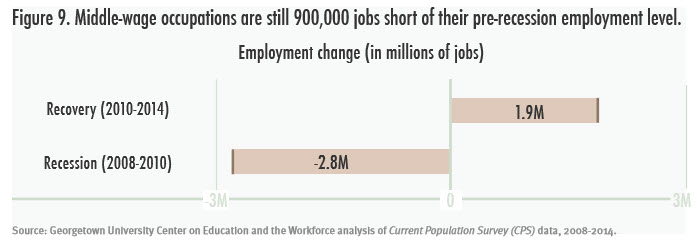
America Crosses The Tipping Point: The Middle Class Is Now A MinorityAmericans have long lived in a nation made up primarily of middle-class families, neither rich nor poor, but comfortable enough, notes NPR's Marilyn Geewax, but this year - for the first time in US history, that changed. A new analysis of government data shows that as of 2015, middle-income households have become the minority, extending a multi-decade decline that confirms the hollowing out of society as 49% of all Americans now live in a home that receives money from the government each month. Sadly, the trends that are destroying the middle class in America just continue to accelerate. Back in 1971, about 2 out of 3 Americans lived in middle-income households. Since then, the middle has been steadily shrinking. Today, just a shade under half of all households (about 49.9 percent) have middle incomes. Slightly more than half of Americans (about 50.1 percent) either live in a lower-class household (roughly 29 percent) or an upper-class household (about 21 percent).
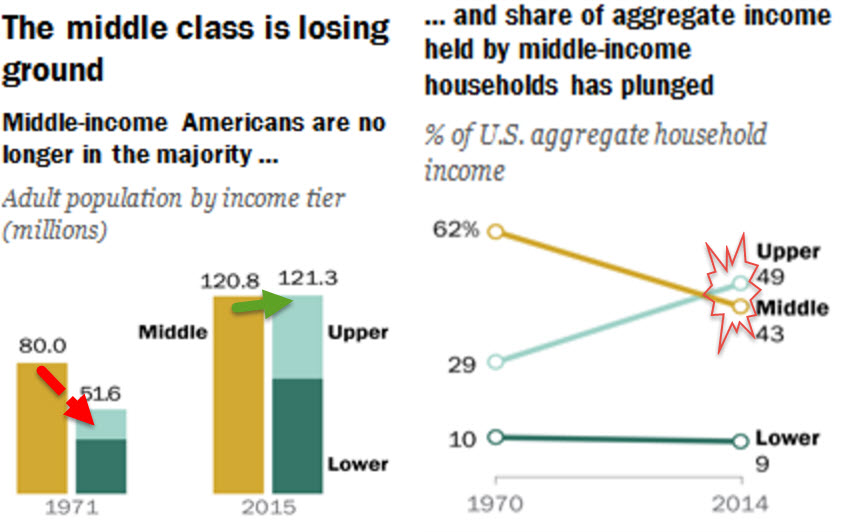
As NPR explains, thanks to factory closings and other economic factors, the country now has 120.8 million adults living in middle-income households, the study found. That compares with the 121.3 million who are living in either upper- or lower-income households. "The hollowing of the middle has proceeded steadily for the past four decades," Pew concluded. And middle-income Americans not only have shrunk as a share of the population but have fallen further behind financially, with their median income down 4 percent compared with the year 2000, Pew said.
Since 1970, the U.S. economy has been growing, and we all have been getting wealthier. But people who have the biggest incomes have been pulling away from the pack in a trend that shows no sign of slowing... asmiddle-income jobs are still 900,000 short of pre-recession employment levels...
And if you’re a millennial, you’d be forgiven for being disillusioned with the American dream. As we recently noted, compared to young Americans in 1986, you’re three times as likely to think the American dream is dead and buried. As WaPo notes, "young workers today are significantly more pessimistic about the possibility of success in America than their counterparts were in 1986, according to a new Fusion 2016 Issues poll - a shift that appears to reflect lingering damage from the Great Recession and more than a decade of wage stagnation for typical workers.”
While there are numerous reasons for the collapse of the American Middle Class (most appear driven by political 'fairness' or monetary policy intended consequences), though we suspect politicians learned long ago that it's easier to just import non-Americanized voters to vote for you, than, as FutureMoneyTrends notes, to get naturalized citizens who still cherish the idea of America to vote for things like national healthcare systems, higher taxes on business owners, and the catering to every little tribal group that declares themselves a minority. It is only a matter of time before the middle class is wiped out and America begins to resemble the poverty, violence and tyranny so often associated with the countries from which many illegal migrants originate. It appears that time is drawing near as Charles Hugh-Smith recently noted, the mainstream is finally waking up to the future of the American Dream: downward mobility for all but the top 10% of households.
If you don't think these apply, please check back in a year. We'll have a firmer grasp of social depression in December 2016. |
|||
III-FINANCIAL |
|||
| FLOWS -FRIDAY FLOWS | MATA RISK ON-OFF |
THEME |  |
FLOWS - Liqudity, Credit & Debt
|
12-11-15 | THEMES | |
Submitted by Tyler Durden on 12/09/2015
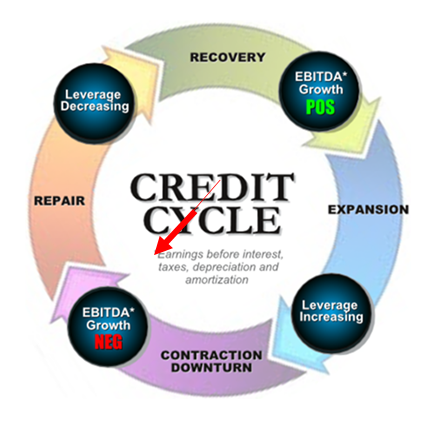
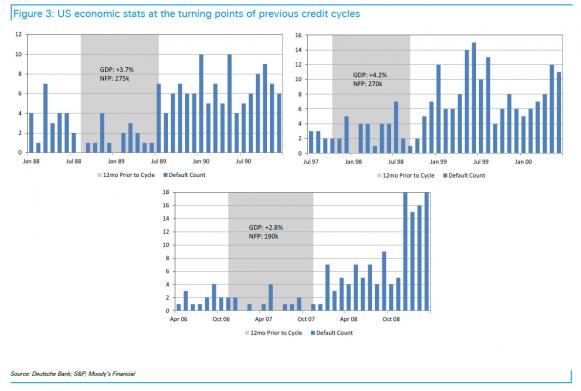
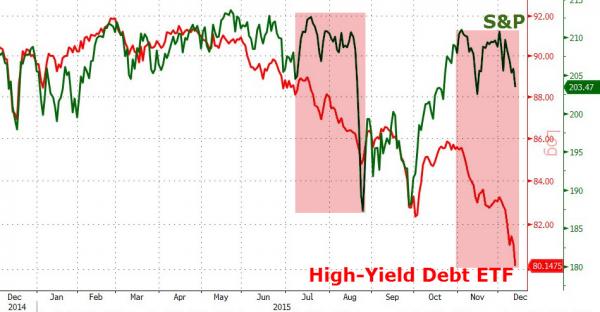
"The Default Cycle Is Now Unavoidable": How The 'Junk' Cancer Spread To The Entire High Yield SpaceOne week ago we presented a must read report by Ellington Management which explained that the credit cycle is now turning. As Ellington pointed out, "We believe that we are now at the end of the "over-investment" phase of the corporate credit cycle in the US that has been playing out since the depths of the GFC. This view is supported by a number of telltale signs of a reversal in the credit cycle:
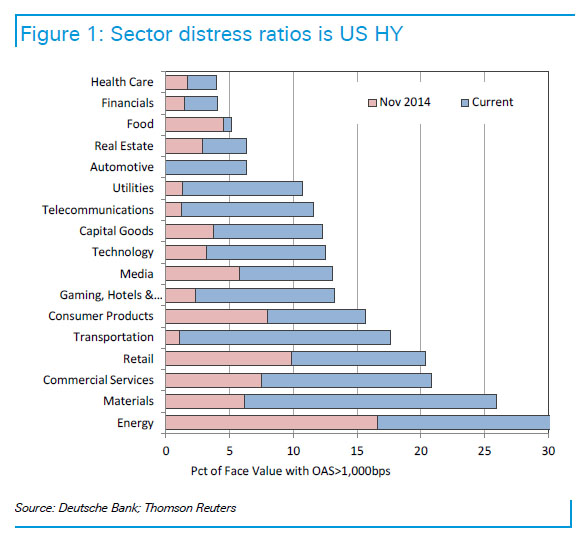
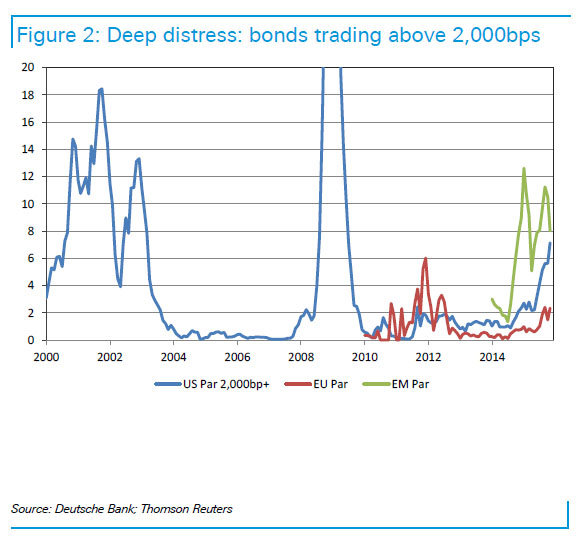
Today, the Deutsche Bank credit strategy team led by Oleg Melentyev, in its "Year-Ahead Outlook 2016" report proves beyond a doubt that not only has the credit cycle turned, but that the default cycle is at hand, initially for energy names ("a default cycle in commodity-related areas at this point is unavoidable, and the only real question here is whether it stays contained to those areas or extends itself to other sectors") and soon for most other sectors. Here is Melentyev's unpleasant message for Yellen, who is now about to hike rates and launch a tightening cycle at precisely the time when should be easing further to take away from the pain that will be unleashed by an inevitable junk bond supernova.
Behold the metastasis of the junk bond cancer:
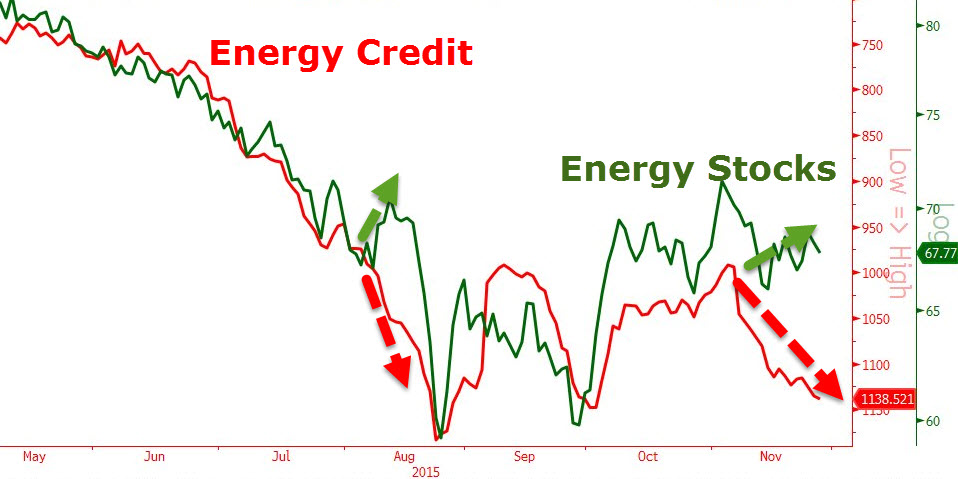
In other words, what was until a year ago a purely "energy" phenomenon is now an "everything" phenomenon, despite promises by every prominent economist that plunging energy prices are great news for the economy. As always happens, the economists were dead wrong once again. It gets worse:
DB is very concerned at the implications of this:
Does the credit cycle precede the business cycle or vice versa? The answer: yes.
Deutsche Bank's conclusion:
None of which, of course, assumes short-term rates around 1% or higher: in that case the default rate will spike proportionately as the issuance window for even the most creditworthy issuers is practically closed. Finally, where this imminent default cycle will have unexpected downstream consequences is on the balance sheets of the debt buyers themselves: moments ago SMRA reported that according to its Money Manager Survey, portfolio managers are holding the largest percentage of corporate bonds in history, with allocations rising to 35.8%, surpassing the previous record of 35.7%, seen last week, and 35.6% 2 weeks ago. In other words, everyone is long and strong just as the bottom is on the verge of falling out of the market. |
|||
| CRACKUP BOOM - ASSET BUBBLE | THEME | ||
| SHADOW BANKING - LIQUIDITY / CREDIT ENGINE | M | THEME | |
| GENERAL INTEREST |
|
||
| THEMES - 2016 RECESSION | 11-26-15 |
||
| STRATEGIC INVESTMENT INSIGHTS - Weekend Coverage | |||
|
SII | ||
| 12-05-15 | SII | ||
|
SII | ||
|
SII | ||
|
SII | ||
WATCH LIST - Shorts:
|
12-12-15 | SII | |
|
|||
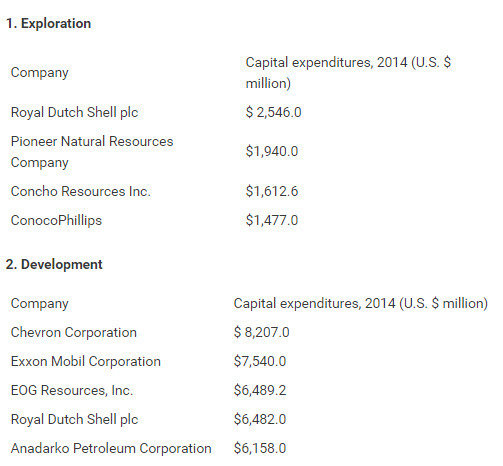
Can The Oil Industry Really Handle This Much Debt?As Energy Intelligence concluded:
As the crude industry has been wrestling with low oil prices that declined by over 50 percent since its highest close at $107 a barrel in 2014, many exploration and production companies worldwide and in the U.S., in particular, have faced large shortfalls in revenue and cash flow deficits forcing them to cut down on capital expenditures, drilling and forego investments in new development projects. High debt levels taken on by the U.S. oil producers in the past to increase production while oil prices soared, have come back to haunt oil and gas companies, as some of the debt is due to mature by the end of this year, and in 2016. Times are tough for U.S. shale oil producers: Some may not make it, especially given that this month, lenders are to reassess E&P companies’ loans conditions based on their assets value in relation to the incurred debt.
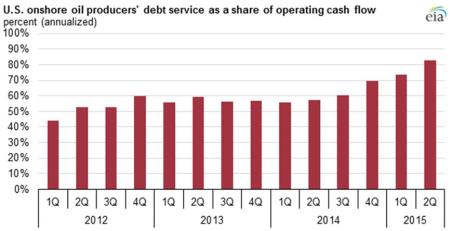
Throughout the oil price upturn that lasted until the middle of 2014, companies sold shares and assets and borrowed cash to increase production and add to their reserves. According to the data compiled by FactSet, shared with the Financial Times, the aggregate net debt of U.S. oil and gas production companies more than doubled from $81 billion at the end of 2010 to $169 billion by this June In the first half of 2015, U.S. shale producers reported a cash shortfall of more than $30 billion. The U.S. independent oil and gas producers’ capital expenditures exceeded their cash from operations by a deficit of over $37 billion for 2014. In July – September 2015, after a couple months of a rebound, a further slump in crude futures prices fluctuated between $39-47/bbl, thus putting more strain on the oil-and-gas producers, and making them feel an even tighter squeeze. As The Wall Street Journal reported in August, Exxon Mobil Corp. and Chevron Corp. stated they were cutting stock-buyback programs, while Linn Energy LLC announced it would stop paying dividends to its shareholders. Meanwhile, several small U.S. oil and gas producers have filed for chapter 11 bankruptcy protection this year. Companies with persistently negative free cash flow fall into the trap of borrowing, as they have to incur more debt to repay what they have already borrowed before. This makes such companies vulnerable to default and bankruptcy. As shared by Edward Morse, Citigroup Global Head of Commodities Research with Oilprice.com, smaller independent U.S. E&P companies are in the worst position now: they are already highly leveraged and are trying to use increased leverage while having to bear high debt pressure. “They also are in the worst cash flow positions of all of the E&P firms per barrel of liquids production relative to the larger and even the mid-cap firms. However, they also tend to account for a much smaller share of overall production. For example, the large North American E&P companies produce around 5.0-million b/d of oil; mid-sized firms produce just short of 1-m b/d. But the small and smallest U.S. E&Ps combined produce only 500-k b/d, 100k b/d of which comes from the smallest U.S. firms,” stated Morse . The chart from the U.S. Energy Information Administration below, based on second-quarter results from 44 U.S. oil-and-gas companies, demonstrates the rising share of the companies’ operating cash flow used to service debt. For the previous four quarters from July 1, 2014 to June 30, 2015, 83 percent of these companies' operating cash had been spent on debt repayments, the highest since at least 2012.
Source: U.S. Energy Information Administration, based on Evaluate Energy Debt Worries for Small Companies According to Forbes, among U.S. E&P companies ranking high on the verge of bankruptcy are Goodrich Petroleum (GDP), Swift Energy (SFY), Energy XXI (EXXI), Halcon Resources (HK) among others. “These companies have all lost more than 90 percent of their market value since 2014, are larded up with too much debt, and would be lucky to survive the bust,” Forbes wrote. According to FINRA data cited by Forbes, the yield of Goodrich’s issue of 2012 bonds for U.S. $275 million jumped up to 58.66 percent from 8.88 percent during trade sessions this August. The Goodrich’s stock that previously sold at $29 in June 2014 traded at 88 cents. The company has a high leverage ratio (debt to EBITDA): in the first half of 2015, the company’s revenues amounted to U.S. $50 million while its interest expense on servicing of a long-term loan of U.S. $622 million was $27 million. Energy XXI (EXXI) is snowed under in $4.6 billion in debt. As Forbes reported, the company was negotiating terms for extending maturities on their bonds with creditors; it also managed to find an investor who bought another U.S. $650 million worth of debt from EXXI. Another company staggering under a heavy debt load is Swift Energy (SFY). According to Forbes, Swift’s equity market capitalization is $27 million against long-term debt of $1.1 billion. As The Wall Street Journal reported in July, the company was trying to find an investor to come up with funds to repay loans by issuing a $640 million bond. Halcon Resources (HK) is also on the brink of insolvency. 40 percent of Halcon Resource’s revenues this year have been expended on making interest payments on its U.S. $3.7 billion debt. The company did two equity-for-debt swaps earlier this year, and sold more debt for U.S. $700 million, Forbes reported. As Virendra Chauhan, Oil Analyst at Energy Aspects discussed with Oilprice.com, the smaller independent U.S. producers are the ones taking the most risk, particularly the ones that have been outspending cash flows quarter-on-quarter for the better part of the last three years. “The debt maturities vary, but the key factor is an over 50 percent fall in oil prices. Whilst costs have come down, they are no way near 50 percent; and so the reliance on external funding, be it through, debt, equity, asset sales or by other means, has increased, which is certainly impacting investor sentiment,” he said. Hedges Expiring Although quite a few U.S. shale oil producers have reported substantial increases in their productivity per well drilled, the amount of rigs drilling for oil in the U.S. has dropped by 59 percent since its peak in October 2014, according to the EIA data shared by the Financial Times. In the Eagle Ford shale of South Texas, the volume of oil produced from new wells for every operational rig, has risen by 42 per cent over the past year, from 556 barrels per rig per day to 792, EIA reported. “Profitability and returns in the U.S. tight oil space is a moving target – many producers claim to be profitable and generate healthy returns, yet their cash flow situation has shown no signs of improving,” pointed out Chauhan. According to the analyst, producers in the Permian are likely to be better positioned than in other areas, as this basin is the least developed of the three major basins, and Pioneer Resources (PXD), which has the largest acreage in the basin is 75 percent hedged for this year with a floor of $67 and a ceiling price of $77 per barrel. According to the IHS Energy North American E&P Peer Group Analysis Report, the weighted-average hedged prices for 2016 are $69.04 per barrel of oil and $3.83 per thousand cubic feet (MCF) of gas. The midsize E&Ps have hedged 26 percent of estimated 2016 total production. Financially distressed companies with low hedge protection and high risk in 2016 include SandRidge Energy and Ultra Petroleum. “The small North American E&Ps have hedged 25 percent of estimated 2016 total production and continue to have the weakest balance sheets. With high debt and little hedging, EXCO Resources and Comstock Resources are at risk of serious liquidity issues if low prices prevail,” stated Paul O’Donnell, principal equity analyst at IHS Energy and author of the report. Liquidity Problems Many investment banks and financial services companies are already facing losses on substantial investments in E&P companies, as they have committed hundreds of millions of dollars to lend to energy companies on top of the loans provided to them at the time when oil prices were surging. Among such investment funds taking a hit on their positions in the financially distressed E&P companies listed above (Goodrich Petroleum Co. Energy XXI Ltd, Swift Energy, etc.) are Franklin Resources Inc., Oaktree Capital Group LLC, Lazard Ltd and others. Financial experts and analysts point out that some E&P companies have managed to refinance their debt, however, it becomes increasingly more difficult for them to do so as their stock and bonds lose value and the high yield return they have to offer to lenders to get financing is higher than in any other business sector. According to Marketwatch, the energy industry Liquidity Stress subindex has pointed to a high-risk debt weighing on U.S. E&P companies, as it surged up to 16.9 percent in September from 12.7 percent in August, the highest level since it reached 19.2 percent six years ago in July 2009. As Chauhan of Energy Aspects pointed out, it is fair to say that most oil and gas companies are not generating free cash flow at current oil prices, as these prices are below full-cycle costs for most regions in the world, with the exception of the Middle East, which is the lowest cost producer globally. Larger Companies Faring Better “The IOC’s are likely to be better positioned during a downturn because they have higher credit ratings and therefore are more accessible to debt markets. They also have a hedge built into their business because they will benefit from downstream profitability from improved margins,” the analyst added. As Paul O’Donnell shared in the IHS report, only six percent of the large North American E&P production volume for 2016 production has been hedged, as these companies have stronger balance sheets to withstand the low prices. “No oil-weighted large E&Ps have any significant hedging in place for 2016”, O’Donnell said. According to Morse, the large North American E&P companies should be able to survive and thrive, given their high production base and their free cash flows as a cover for liquids production. “They have roughly three times the cash flow coverage as the smaller companies in terms of cash flow per barrel of oil, and they are still increasing production as a group,” commented the Head of Commodity Research. According to Ernst & Young U.S. Oil and Gas Reserves Study 2015, the total capital expenditures of 50 largest U.S. oil-and-gas companies reached $200.2 billion in 2014. As the study reveals, some of the large E&Ps’ capital expenditures in 2014 were:
O’Donnell of IHS expects capital spending for the North American E&P group to drop 25 percent in the second-half 2015, as compared with the first-half of 2015, from approximately $60 billion to $45 billion. As cited by Natural Gas Intelligence in September, “according to EIA, U.S. oil and gas E&Ps had reduced their capex budgets by $38 billion in 2Q2015 (to about $95 billion) compared to the preceding second quarter (about $130 billion), "the difference between cash from operations and capex was almost zero in 2Q2015." |
|||
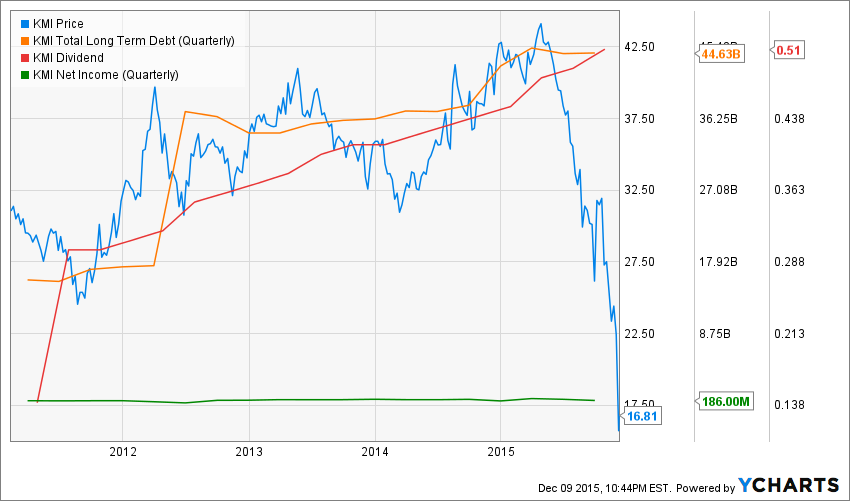
Submitted by David Stockman via Contra Corner blog, Kinder Morgan - Poster Boy For Bubble FinanceKinder Morgan is the poster boy for the modus operandi of our entire present regime of Bubble Finance. The graph below belongs in the “what were they thinking category”. After Tuesday’s dividend massacre, it’s plain as day that Kinder Morgan (KMI) wasn’t the greatest thing since slice bread after all. That is, a “growth” business paying rich dividends out of rock solid profit margins and flourishing cash flow. In fact, it was just a momo stock on a borrowing spree. During the 27 quarters since the beginning of 2009, the consolidated entities which comprise KMI generated$20.8 billion of operating cash flow, but spent $24.3 billion on CapEx and acquisitions. So the “growth” side of the house ended-up in the red by $3.5 billion. Presumably that’s because it was “investing” for long haul value gains. But wait. It also had to finance those juicy dividends, and there was a reassuring answer for that, too. The payout was held to be ultra safe owing to KMI’s business model as strictly a toll gate operator in the oil and gas midstream, harvesting risk-free fees from gathering systems, transportation pipelines and gas processing plants. Accordingly, even when its stock price was riding high north of $40 per share, the yield was 5%. So over the last 27 quarters KMI paid out $17.3 billion in dividends from cash it didn’t have. It borrowed the difference, of course, swelling its net debt load from $14 billion at the end of 2009 to $44 billion at present. And that’s exactly the modus operandi of our entire present regime of Bubble Finance. Kinder Morgan is the poster boy.
Yes, you can chalk this off to another “lesson learned” in the Wall Street casino. After all, some definable group of investors and speculators thought they owned $98 billion of market cap a few months ago, and now their accounts are suddenly $60 billion lighter—–including about $7 billion of bottled air that evaporated from the net worth of its founder and indefatigable promoter, Richard Kinder. But in the alternative, perhaps its time to recognize that healthy, properly functioning free markets do not make egregious $60 billion “mistakes” such as this one over and over. What surely led to the insane peak valuation of KMI is the relentless scramble for yield that has been triggered by 84 months of ZIRP and endless coddling of the stock market by the Fed and other central banks. The fact is, during the last 31 quarter (i.e. since Q1 2008) KMI has posted the grand total of $900 million in cumulative net income. This means that at its peak April valuation it was trading a 100X the totality of what it had earned during nearly an entire decade; and that during that period it paid out 17 times more in dividends than it earned. That’s right. The Wall Street gamblers and punters had followed the pied piper of Houston right out of Enron, and into an even greater bubble predicated on the same old scam. Indeed, KMI is a pipeline company just like Enron. It’s original building block, Enron Liquids Pipeline, was purchased by Richard Kinder and his partner for $40 million back in the late 1990s. Yet it had no more chance of being worth $100 billion than Enron had of being worth $60 billion before its implosion. It didn’t even have the razz mataz of a fiber optics trading business or a franchise to bring power and light to impoverished villages of India. The apologists are want to argue, of course, that net income doesn’t mean anything when it comes to valuation. Perhaps we should therefore dispense with the several billions spent annually by the SEC, DOJ and sundry state attorneys general hauling business executives to court and jail for violating GAAP. On the other hand, there is a reason why GAAP accounting statements require that asset write-offs, goodwill impairments, restructuring charges and stock option costs be charged to net income. At one point or another every one of these charges involved the waste of cash or other corporate assets. They are not merely “non-recurring” expenses. They always and everywhere generate a recurring loss of value because these charges reflect a business mistake or the impact of Mr. Market’s penchant for “creative destruction”. Even then, clamber on board with the LBO boys and consider the LTM results for KMI on a so-called cash flow basis. During the year ended September, it posted $5.89 billion of EBITDA and spent $3.9 billion on CapEx and $1 billion on acquisitions. So its free cash flow was a round $1 billion. Let’s see. At its April stock market peak, Kinder Morgan’s total unlevered enterprise value (TEV) was $140 billion. So the casino was valuing the company at 24X EBITDA, 70X EBITDA less CapEx and 140X free cash flow! If you have another pipeline company in Houston, I’ve got some swampland in Florida that I will swap for it. If not, at least believe this. Two decades of Wall Street coddling by the Fed and 84 months of free carry trade money means that the casino is riddled with momo plays and debt-fueled scams like Kinder Morgan. Now would be an excellent time to get out of harm’s way - as any sensible KMI shareholder would have done long before Bloody Tuesday.
|
|||
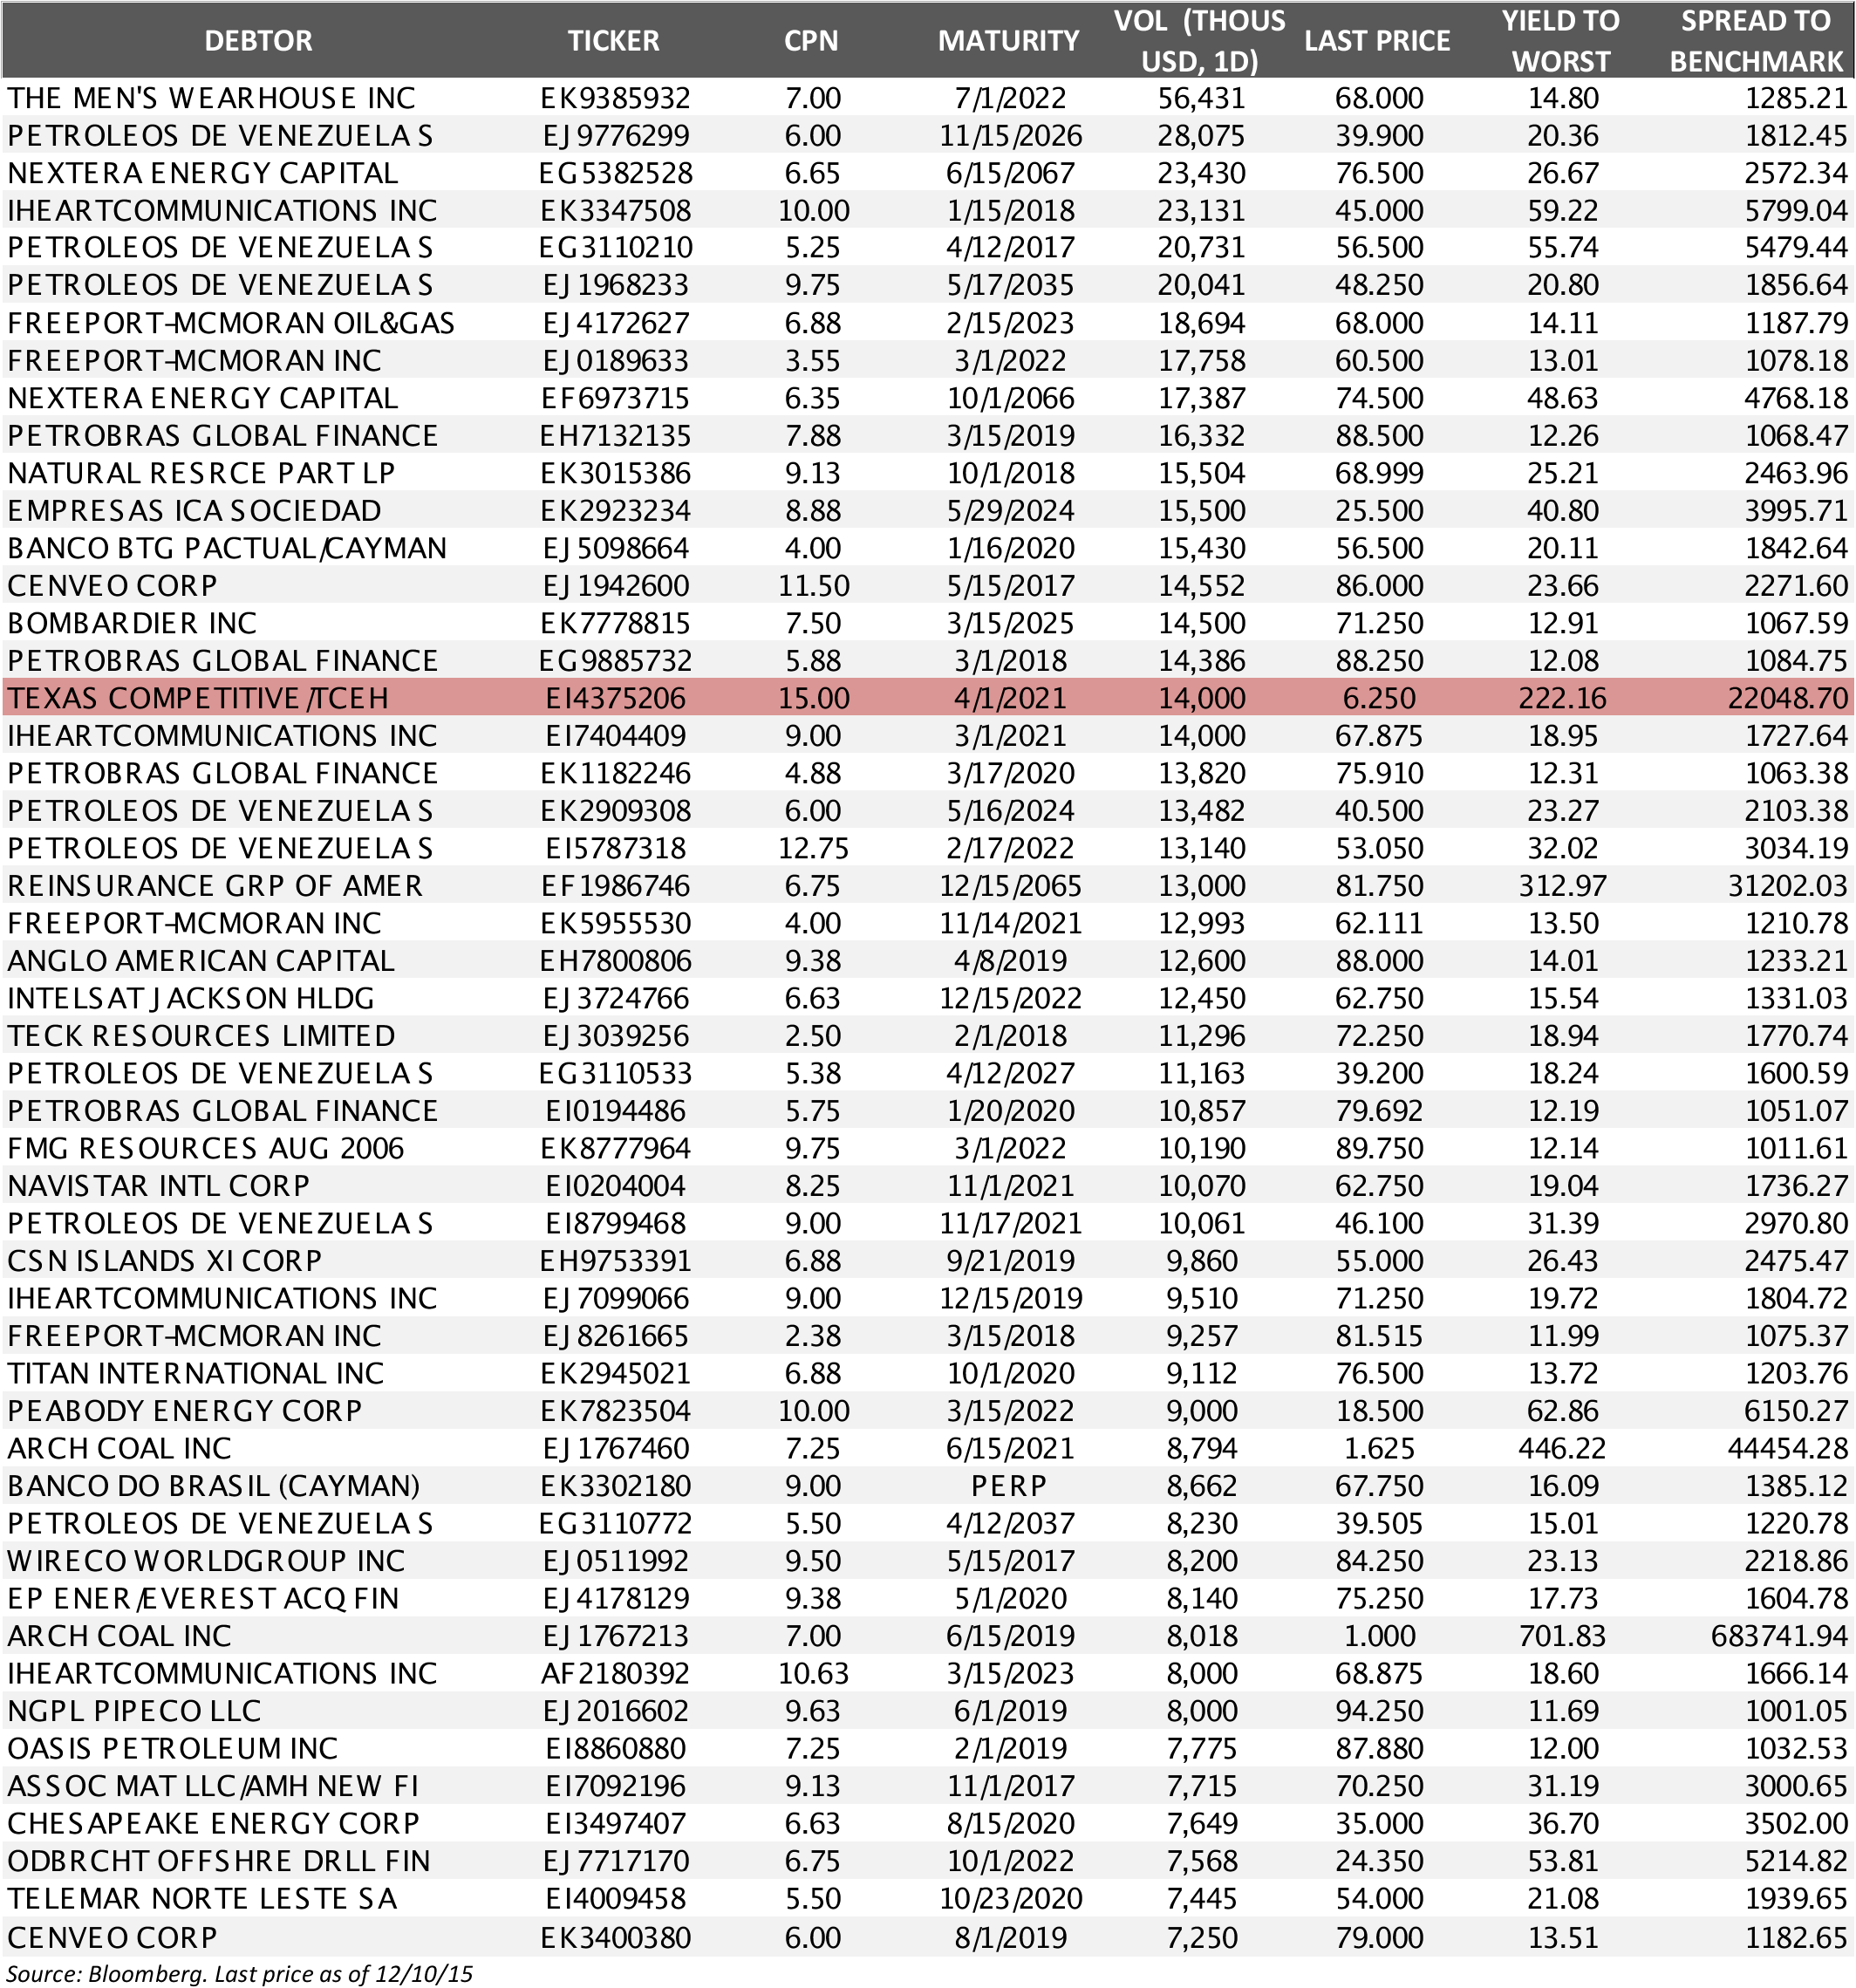
These Are The World's Most Actively Traded Distressed BondsNow that everyone is finally looking at junk bonds with hopes to buy, sell or short as one's inclination may be, everyone is realizing something we have been warning about since 2012: when times of stress emerge, either the Bid/Ask spread is gargantuan (good luck with those "subject" quotes from dealers who have no inventory), or there is simply no market as the first hint of a buyer or seller make bond traders the carbon-based equivalent of an HFT algo, and pull their quotes. In short: there is no liquidity. DISTRESSED BONDS - OVer 1000bps Luckily, there are some very distressed bonds (spread over 1,000 bps) which still trade in volume. The table below, courtesy of Bloomberg, lists the bonds with the largest one-day volume among those that traded yesterday on TRACE at a spread of 1,000 basis points or more than their government benchmark.
For those who want to join the junk bond fray, on either side of the trade, but don't want to be locked out in an illiquid market, these may be your best bets. Source: BBG Brief |
|||
| TO TOP | |||


Read More - OUR RESEARCH - Articles Below

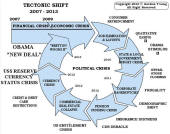
Tipping Points Life Cycle - Explained
Click on image to enlarge
TO TOP
 |
YOUR SOURCE FOR THE LATEST THINKING & RESEARCH
|
�
TO TOP