|
JOHN RUBINO'SLATEST BOOK |
||||||||||||||||||||||||||||||||||||||||||||||||||||||||||||||||||||||||||||||||||||||||||||||||||||||||||||||||||||||||||||||||||||||||||||||||||||||||||||||||||||||||||||||||||||||||||||||||||||||||||||||||||||||||||||||||||||||||||||||||||||||||||||||||||||||||||||||||||||||||||||||||||
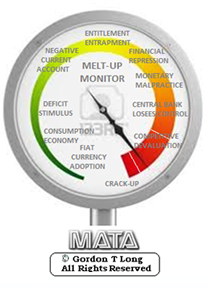
"MELT-UP MONITOR "
Meltup Monitor: FLOWS - The Currency Cartel Carry Cycle - 09 Dec 2013 Meltup Monitor: FLOWS - Liquidity, Credit & Debt - 04 Dec 2013 Meltup Monitor: Euro Pressure Going Critical - 28- Nov 2013 Meltup Monitor: A Regression-to-the-Exponential Mean Required - 25 Nov 2013
|

![]()
"DOW 20,000 "
Lance Roberts Charles Hugh Smith John Rubino Bert Dohman & Ty Andros
|

HELD OVER
Currency Wars
Euro Experiment
Sultans of Swap
Extend & Pretend
Preserve & Protect
Innovation
Showings Below
"Currency Wars "
|


"SULTANS OF SWAP" archives open ACT II ACT III
ALSO Sultans of Swap: Fearing the Gearing! Sultans of Swap: BP Potentially More Devistating than Lehman! |

"EURO EXPERIMENT"
archives open EURO EXPERIMENT : ECB's LTRO Won't Stop Collateral Contagion!
EURO EXPERIMENT: |

![]()
"INNOVATION"
archives open |

"PRESERVE & PROTE CT"
archives open |

RECAP
Weekend Dec. 6th, 2015
Follow Our Updates
onTWITTER
https://twitter.com/GordonTLong
ARCHIVES
| NOVEMBER | ||||||
| S | M | T | W | T | F | S |
| 1 | 2 | 3 | 4 | 5 | 6 | 7 |
| 8 | 9 | 10 | 11 | 12 | 13 | 14 |
| 15 | 16 | 17 | 18 | 19 | 20 | 21 |
| 22 | 23 | 24 | 25 | 26 | 27 | 28 |
| 29 | 30 | 1 | 2 | 3 | 4 | 5 |
KEY TO TIPPING POINTS |
| 1- Bond Bubble |
| 2 - Risk Reversal |
| 3 - Geo-Political Event |
| 4 - China Hard Landing |
| 5 - Japan Debt Deflation Spiral |
| 6- EU Banking Crisis |
| 7- Sovereign Debt Crisis |
| 8 - Shrinking Revenue Growth Rate |
| 9 - Chronic Unemployment |
| 10 - US Stock Market Valuations |
| 11 - Global Governance Failure |
| 12 - Chronic Global Fiscal ImBalances |
| 13 - Growing Social Unrest |
| 14 - Residential Real Estate - Phase II |
| 15 - Commercial Real Estate |
| 16 - Credit Contraction II |
| 17- State & Local Government |
| 18 - Slowing Retail & Consumer Sales |
| 19 - US Reserve Currency |
| 20 - US Dollar |
| 21 - Financial Crisis Programs Expiration |
| 22 - US Banking Crisis II |
| 23 - China - Japan Regional Conflict |
| 24 - Corruption |
| 25 - Public Sentiment & Confidence |
| 26 - Food Price Pressures |
| 27 - Global Output Gap |
| 28 - Pension - Entitlement Crisis |
| 29 - Central & Eastern Europe |
| 30 - Terrorist Event |
| 31 - Pandemic / Epidemic |
| 32 - Rising Inflation Pressures & Interest Pressures |
| 33 - Resource Shortage |
| 34 - Cyber Attack or Complexity Failure |
| 35 - Corporate Bankruptcies |
| 36 - Iran Nuclear Threat |
| 37- Finance & Insurance Balance Sheet Write-Offs |
| 38- Government Backstop Insurance |
| 39 - Oil Price Pressures |
| 40 - Natural Physical Disaster |
Reading the right books?
No Time?
We have analyzed & included
these in our latest research papers Macro videos!
OUR MACRO ANALYTIC
CO-HOSTS
John Rubino's Just Released Book
Charles Hugh Smith's Latest Books


Our Macro Watch Partner
Richard Duncan Latest Books
MACRO ANALYTIC
GUESTS
F William Engdahl


OTHERS OF NOTE
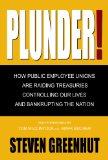
Book Review- Five Thumbs Up
for Steve Greenhut's Plunder!


![]()
TODAY'S TIPPING POINTS
|
Have your own site? Offer free content to your visitors with TRIGGER$ Public Edition!
Sell TRIGGER$ from your site and grow a monthly recurring income!
Contact [email protected] for more information - (free ad space for participating affiliates).
HOTTEST TIPPING POINTS |
Theme Groupings |
||
We post throughout the day as we do our Investment Research for: LONGWave - UnderTheLens - Macro
|
|||
|
MOST CRITICAL TIPPING POINT ARTICLES TODAY
|
|
||
| MOST CRITICAL TIPPING POINT ARTICLES THIS WEEK - Nov. 29th, 2015 - Dec 5th, 2015 | |||
| BOND BUBBLE | 1 | ||
| RISK REVERSAL - WOULD BE MARKED BY: Slowing Momentum, Weakening Earnings, Falling Estimates | 2 | ||
| GEO-POLITICAL EVENT | 3 | ||
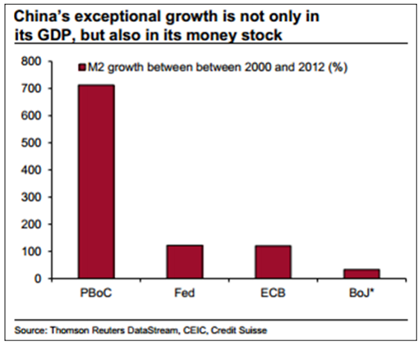
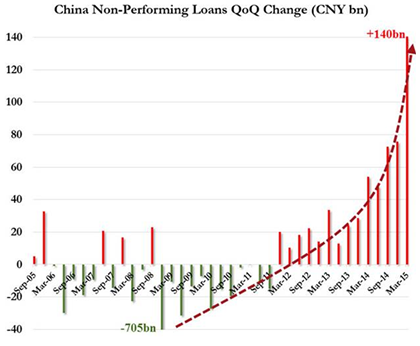
| CHINA BUBBLE | 4 | ||
| JAPAN - DEBT DEFLATION | 5 | ||
EU BANKING CRISIS |
6 |
||
CREDIT CONTRACTION |
16 - Credit Contraction II |
||
CREDIT CONTRACTION |
12-04-15 | 16 - Credit Contraction II |
|
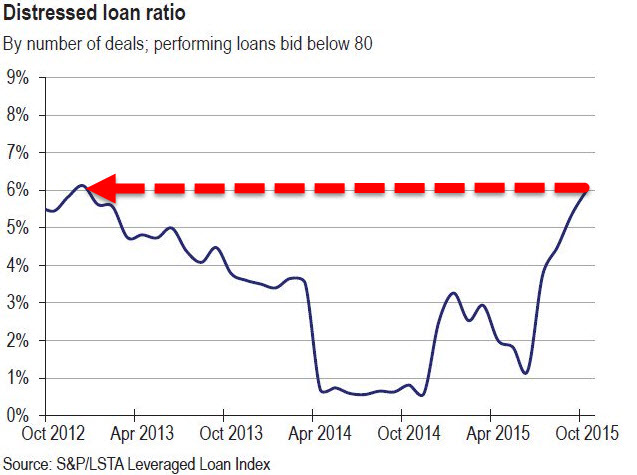
To Junk Bond Traders "It Almost Feels Like 2008"Despite distressed-debt funds suffering their worst losses since 2008, mainstream apologists continue to largely ignore the carnage in the credit market (even though veteran bond managers have urged "it's not just energy, it's everything."). With the number of loan deals pricing below 80 (distressed) at cycle peaks, and "a less diverse group of investors holding a lot more bonds," price swings continue to be wild but as DB's Melentyev warns, initially "all of this looks random when there is no underlying news to support the big moves. But eventually a narrative emerges -- maybe we have turned the corner on the credit cycle." Investors are shunning the lowest-rated junk bonds.
That is underscored by the extra yield that investors are demanding to hold CCC rated credits relative to those rated BB. This has jumped to the most in six years.
One sometimes-overlooked element that’s contributing to the big price swings is the increasing concentration among investors, according to Stephen Antczak, head of credit strategy at Citigroup Inc.
Bonds of smaller companies that carry a high amount of debt relative to earnings are most susceptible to falling quickly after earnings are reported, said Michael Carley, a co-founder of hedge-fund firm Lutetium Capital.
Money managers looking at the bonds of those types of companies aren’t spending time examining the issues in those businesses before selling because they’ve got their “own wounds to lick,” said Carley, the former co-head of distressed debt at UBS AG. “And the dealers are saying, ‘I don’t own it; I don’t care.’ So it just plunges.”
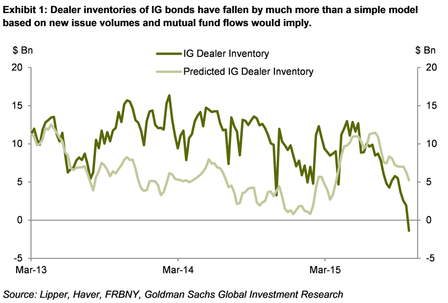
As we noted previously, for the first time ever, primary dealers' corporate bond inventories have turned unprecedentedly negative. While in the short-term Goldman believes this inventory drawdown is probably a by-product of strong customer demand, they are far more cautious longer-term, warning that the "usual suspects" are not sufficient to account for the striking magnitude of inventory declines... and are increasingly of the view that "the tide is going out" on corporate bond market liquidity implying wider spreads and thus higher costs of funding to compensate for the reduction is risk-taking capacity. * * * One wonders when stock investors will wake up again?
|
|||
How To Profit From The Coming High Yield MeltdownThe credit cycle has finally turned: one can see it everywhere - from the rapidly deteriorating corporate fundamentals, to the recent surge in defaults and downgrades, to the tightening lending standards, to the most obvious - sliding asset prices. Nowhere is the bursting of the credit bubble more obvious than in the spread between junk spreads and the equity market,
Yes, equities may not have gotten the memo yet, but they will, as will all other skeptics once they read Ellington Management's analysis laying out all the telltale signs that showcase the turning of the credit cycle. What does that mean for investors? Conveniently the very same Ellington, which recently did a remarkable job of explaining why the credit party is now over, has proceeded to layout how to profit from the upcoming credit turmoil. Here it the answer: Given the fundamental factors in place that should support the demand for housing, we believe the e ect of the troubles in the subprime sector on the broader housing market will likely be limited, and we do not expect signi cant spillovers from the subprime market to the rest of the economy or to the nancial system." Ben Bernanke, May 2007 For my own part, I did not see and did not appreciate what the risks were with securitization, the credit ratings agencies, the shadow banking system, the SIVs - I didn't see any of that coming until it happened." Janet Yellen, November 2010
Complacency today about the risks of contagion from the weakest segments of high yield to the rest of the corporate credit markets is strongly reminiscent of the complacency about contagion risks from subprime in mid-2007. At that time, investors and regulators realized that the sharp increase in subprime delinquency rates was an issue, but believed that losses would be contained to that sector. Even though housing leverage was at all-time highs and home prices had peaked a year prior, markets did not believe that other sectors were at risk. Today, with corporate leverage ratios at all-time highs and a year after corporate profits have peaked, markets are again largely ignoring the risks of contagion from the most distressed sectors of high yield to the rest of the corporate credit sector. There is a silver lining to all this doom and gloom. Despite all of these warning signs, the window of opportunity is still wide open, with market prices and implied volatilities now back around where they were before the market swoon during August and September.
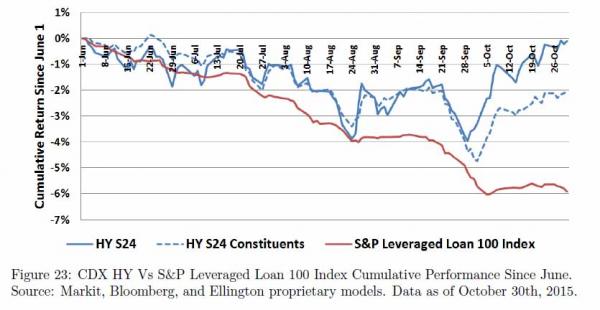
Like most turns in the credit cycle, it is uncertain exactly when the bottom will fall out of corporate credit markets, but the catalyst is likely to be an unexpected major event, perhaps even a single company getting into trouble. While we have been bearish on high yield for over a year now, we didn't think the conditions were yet ripe for a collapse. Now they're ripe. As corporate leverage unwinds, distortions that have been magnified in credit index tranches are set to dissipate and eventually reverse. Yield-seeking investors can obtain leverage by buying equity and mezz tranches of the CDX HY and IG indices, compressing spreads at the bottom of the capital structure. We think the 0-35 tranche of CDX HY has the potential to be completely wiped out - not unlike the mezzanine mortgage bonds (subprime BBB through AA) that eventually got wiped out in the GFC. Banks, which have been slapped with onerous capital charges on low-spread synthetic instruments, no longer provide the bid for the top of the capital structure that they used to. In order to complete the capital structure, banks must now find a buyer for the senior and super-senior tranches that yield-hungry investors don't want. This double-whammy of spread compression at the bottom and spread widening at the top presents capital structure opportunities that we have profited from in recent years. As the credit cycle turns, we expect these opportunities to change and likely become more compelling. Opportunities Using Single-Name CDS Different markets are telling us very different things about the price of credit risk today. As shown in Figure 23, the S&P LSTA Leveraged Loan 100 Index, which is a total return index designed to track the performance of the largest institutional leveraged loans, has declined almost 5.9% since June, while the CDX HY S24 index has declined by only 0.1%. These indices, which measure similar risks, tend to move in tandem. Most of this divergence has taken place since late September. In October alone, CDX HY S24 returned 3.5%, compared to -0.6% for the S&P Leveraged Loan 100 Index. This outperformance coincided with by far the strongest month ever for high yield ETF flows. Using single-name CDS data, we are able to separate out the components of this outperformance since June to better understand whether we think it will revert. Nearly a third of this outperformance (1.23% of the 4.05% di difference) is a move in the basis between the CDX HY index and its constituents. This move is purely technical, reflecting an unusually large premium at which CDX HY currently trades to its constituents. Moreover, this basis has historically mean-reverted, especially when the basis is greater than 1% of NAV (today it is closer to 2%). The conclusion we make from the graph below is that two factors are at work: not only has single-name CDS outperformed the leveraged loan market, but the CDX HY index has outperformed single-name CDS. The price differential creates a large wedge between CDX HY and leveraged loans, which supports our thesis that synthetic corporate credit is especially overpriced today.
Opportunities in Corporate Credit ETFs Perhaps the scariest corner of the corporate credit market today is the market for corporate bond ETFs and open-ended mutual funds. These funds, such as the LQD, HYG, and JNK ETFs, provide daily liquidity to investors where the underlying collateral is much more illiquid corporate bonds. These funds are scary because liquidity has been tested in only one direction. Fund flows have been mostly one-sided over the past 5-6 years. Retail investors and institutions have been buying fixed income ETFs at a record pace in their search for yield and liquidity. Who will take the other side when these massive flows reverse? The answer before the crisis would have been the banks. Now the answer is much less clear. The spate of recent failed placements in distressed loan markets is symptomatic of a liquidity vacuum. Not only have banks reduced their own market-making activities in corporate bonds due to new onerous bank capital requirements, but banks have also wound down their repo financing businesses that are the lifeblood of cheap financing for non-banks to provide liquidity in corporate bonds. Fixed income ETFs provide daily liquidity to investors by allowing authorized market participants to create or redeem ETF shares in exchange for the underlying corporate bonds at a NAV quoted using the bid prices of the underlying collateral. These authorized participants can therefore make a profit if ETF prices deviate sufficiently far from fair value, a mechanism that keeps these ETFs trading very close to NAV. However, if flows are large enough to overcome the balance sheet capacity of these authorized participants, ETF prices could theoretically diverge significantly from NAV, and market-makers could be forced to liquidate their positions in the cash bond market. This divergence occurred during the GFC and to a lesser extent during the Euro crisis of 2011. It is this sudden rush to the exits that concerns us most, in part because it will be hard to see coming. If a large group of investors suddenly decides to sell, there may not be enough market-maker capacity to take the other side. When these ETFs become rich to NAV or when the cash-synthetic basis gets very tight, we can use corporate bond ETFs as a tail hedge or as a source of alpha. The cost of these tail hedges is often surprisingly low. |
|||
CREDIT CONTRACTION |
16 - Credit Contraction II |
||
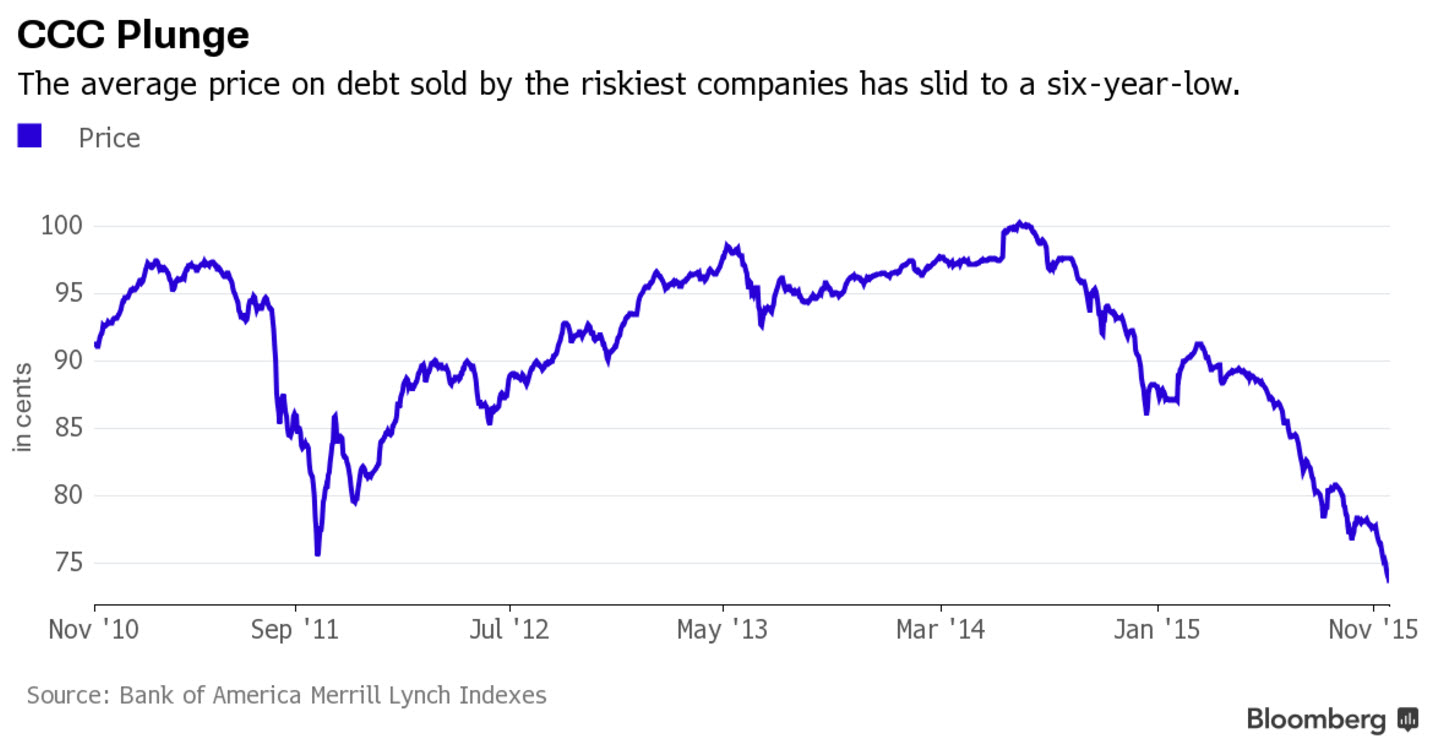
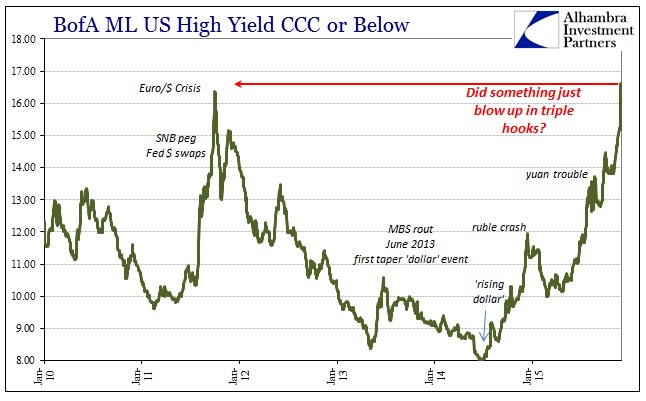
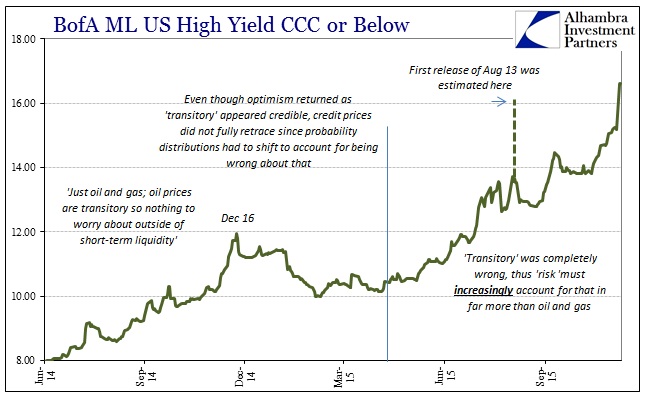
Did Something Blow Up in Junk?There isn’t much as far as confirmation, but it increasingly appears as if “something” just hit the triple hooks (CCC) in the junk bond bubble. At least as far as one view of it, Bank of America ML’s CCC implied yield, there was a huge selloff that brought the yield to a new cycle high (low in price) above even the 2011 crisis peak.
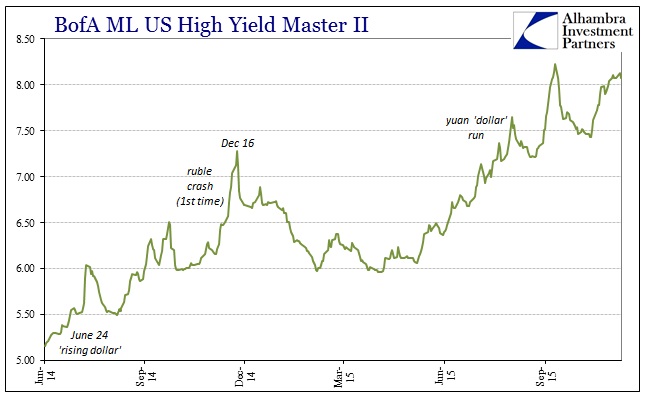
Now, this had occurred before on August 13 amidst the growing carnage in the “dollar” run through the PBOC and China. The published rate for that day was just over 16% and a similarly huge jump, but that was quickly revised (no reason given) to actually less than the day before. Further, that pricing revision applied to BofAML’s Master II HY index, as well, which had also been initially published in an explosion that day only to erased quickly after.
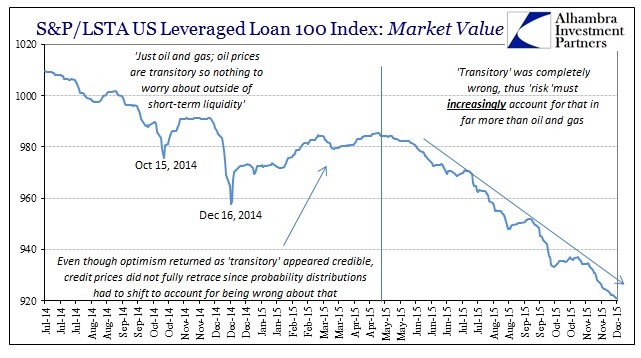
This time, the CCC index is by itself in showing “something.” Neither the Master II nor the S&P/LSTA Leveraged Loan 100 are following suit. Whether or not that suggests another pricing problem isn’t clear, but the fact that the CCC index actually surged Monday to 16.61% and was reported again yesterday at 16.60% begins to indicate this was an actual trading outcome. In other words, as junk bonds have been the leading edge to the domestic end of the “dollar” run, this demands close and ongoing scrutiny in light of a potential escalation. After all, this is just another indication of how advanced the deterioration has become, when the “usual” carnage and selloff is no longer noteworthy, giving way to only the (possibly) spectacular.
|
|||
CREDIT CONTRACTION |
16 - Credit Contraction II |
||
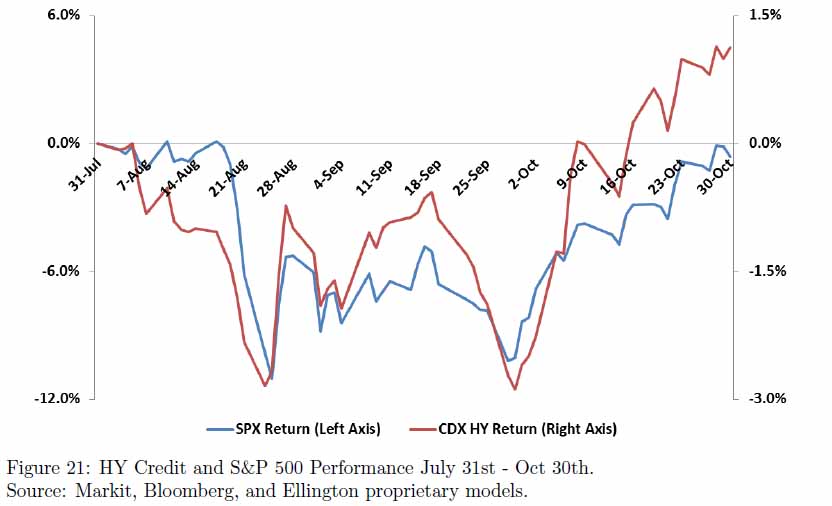
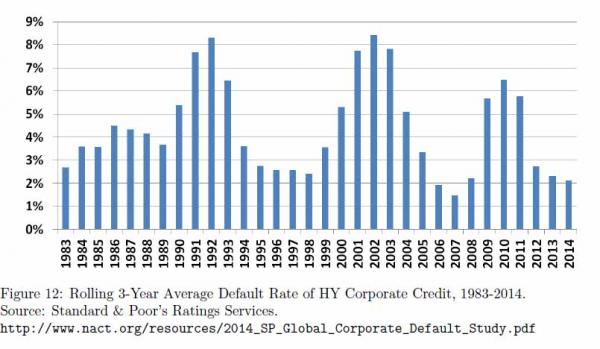
Submitted by Tyler Durden on 11/30/2015 4 Telltale Signs The Credit Cycle Is Turning NowEarlier today, the FT wrote an article in which it found that "companies have defaulted on $78bn worth of debt so far this year, according to Standard & Poor’s, with 2015 set to finish with the highest number of worldwide defaults since 2009" which together with a chart we have been showing for the past year, namely the staggering disconnect between junk bond yields and the S&P500...
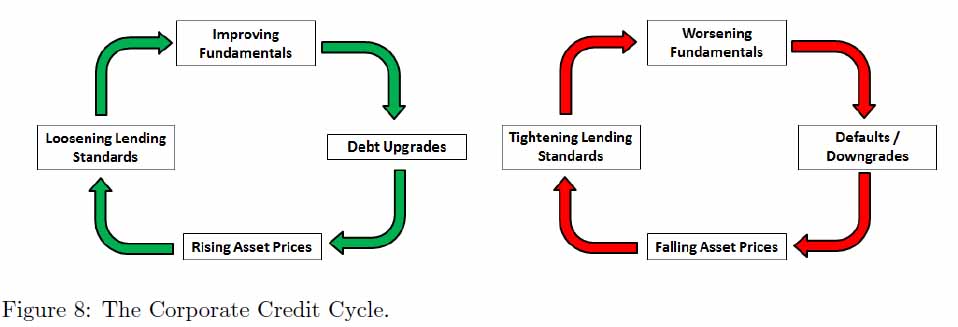
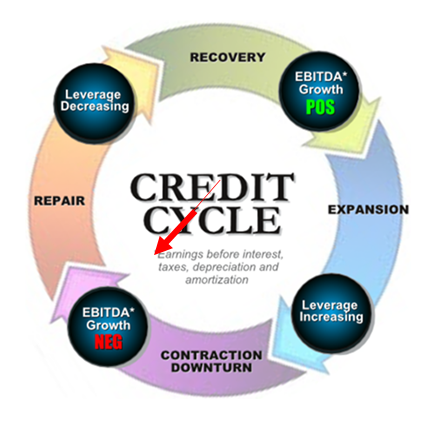
... has made many wonder if the credit cycle - a key leading indicator to economic inflection points and in the case of the last credit bubble, the Great Financial Crisis - has already turned. According to a recent analysis by Ellington Management, the answer is a resounding yes. Below, we present what Ellington believes are the 4 telltale sings the credit cycle is turning now. The full report is a must read for everyone (link here) but for those who wish to know where the overall debt market is headed, the below excerpt is a must read, especially since as Ellington concludes, once "fickle investors exit the market, high yield bonds and leveraged loan prices should settle at a supply/demand equilibrium well below today's levels." * * * Telltale Signs the Credit Cycle is Turning Now We believe that we are now at the end of the "over-investment" phase of the corporate credit cycle in the US that has been playing out since the depths of the GFC. This view is supported by a number of telltale signs of a reversal in the credit cycle:
The turn of the credit cycle from expansion to contraction tends to play out the same way each time. Initial enthusiasm about a new technology, innovation, or policy change creates an investment boom and easier lending standards. This virtuous cycle repeats itself, with stronger fundamentals, lower volatility, and higher leverage. Financial markets facilitate increased leverage, magnifying booms and busts. Return-chasing investors pile in, fueling more debt issuance. Borrowers who would have otherwise defaulted are able to refinance as leverage increases faster than cash flows deteriorate. Over-investment inevitably leads to loans that go sour, and as the tide of leverage goes out, the full extent of irresponsible lending becomes apparent. The previously virtuous cycle between risk spreads and fundamentals goes into reverse, with lower prices, defaults, and downgrades forcing leveraged investors to sell, leading to even lower prices. As we have shown, the demand for high yield assets today is fickle. Once these fickle investors exit the market, high yield bonds and leveraged loan prices should settle at a supply/demand equilibrium well below today's levels.
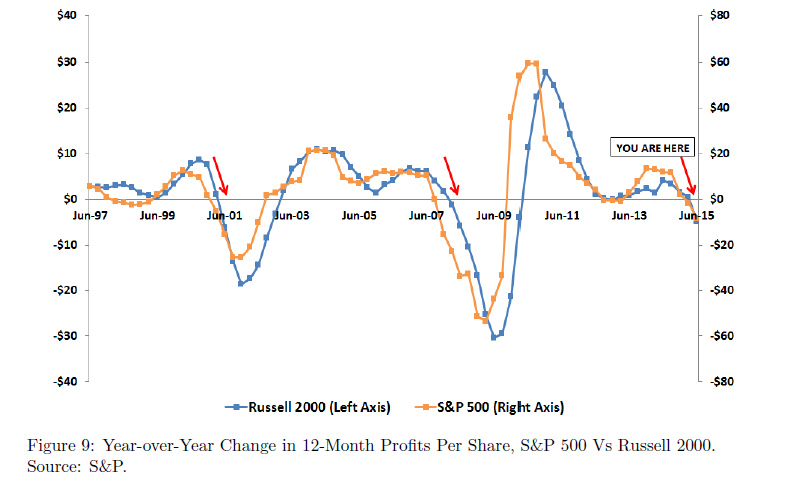
Telltale Sign #1: Worsening Fundamentals As we noted earlier, corporations are now running out of steam in terms of their ability to generate earnings. As of Q2 2015, the year-over-year change in annual corporate earnings dropped to -$8.21 per share for the S&P 500 and to -$4.79 per share for the Russell 2000. The previous three times this metric fell that far into negative territory on the S&P 500 were Q1 1990, Q1 2001, and Q4 2007, coinciding with the start of each of the last three high yield default cycles. According to a recent article in The Economist, in the most recent quarter less than half of S&P 500 companies recorded increasing pro ts year-over-year.
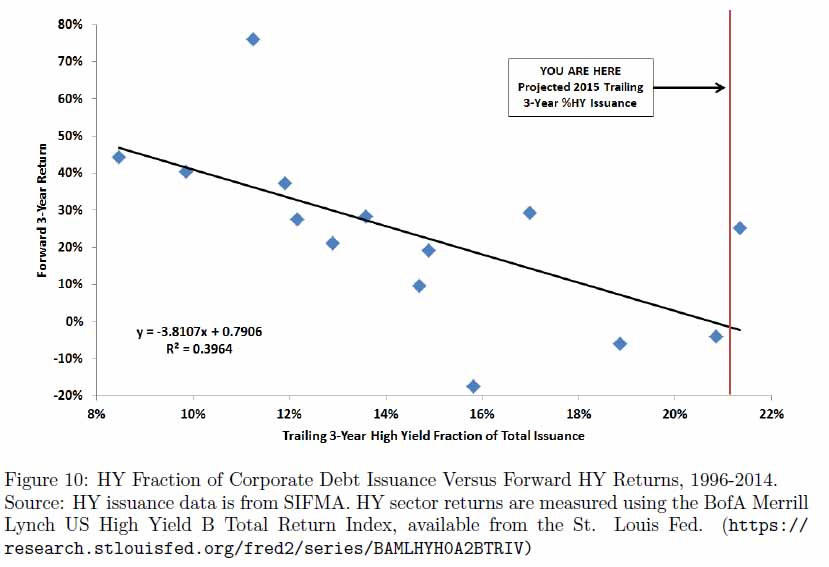
The average quality of corporate debt issuance has also deteriorated in the past few years. Recent research documents a strong link between issuer quality in corporate debt markets and excess returns over the following 1-3 years. This empirical finding holds when credit quality is measured both in terms of credit spreads (market implied default probability) as well as credit ratings. Our research suggests the lag may be slightly longer, with high HY issuance fractions in 1996-1998 and 2003-2004 being followed by default waves in 2000-2003 and 2009-2011. Again, we believe that the root cause of lower issuer quality in recent years is lower interest rates. First, as central banks have purchased massive amounts government bonds and MBS, they push investors into risky assets that they would not otherwise buy. Second, a declining interest rate environment is helpful to corporate balance sheets, thus creating the illusion that lower default rates are evidence of improving corporate fundamentals.
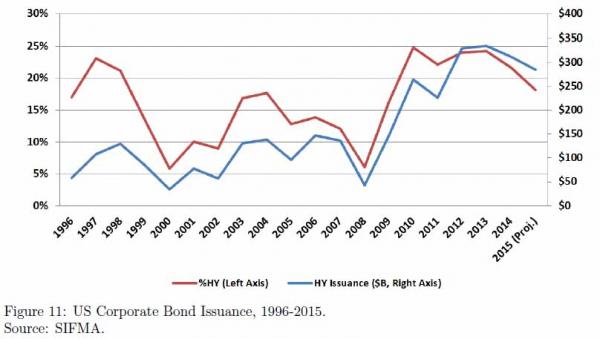
Since 2010, the HY fraction of total corporate debt issuance has been at or above levels that preceded the last two waves of corporate credit defaults (see Figure 11 below). What is remarkable about today's high HY fraction of debt issuance is not only its level but also its persistence. Unlike the past corporate credit booms of 1997-1999 and 2003-2005, HY companies have faced a very friendly environment of zero short-term borrowing rates and declining long-term interest rates. This has made the most recent credit cycle more extreme and of longer duration than past cycles. Moreover, because the relationship we document between the HY fraction of issuance and future returns has been during a declining rate environment, the predicted excess return over Treasuries is even lower on a duration-adjusted basis.
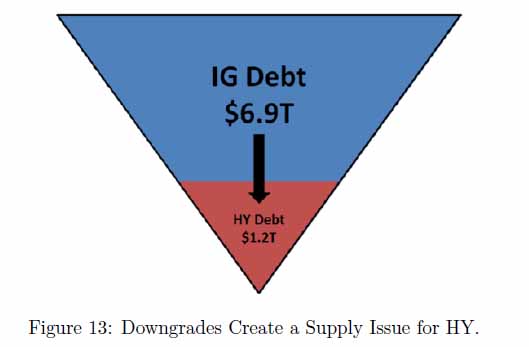
Telltale Sign #2: Defaults/Downgrades Many credit investors have mandates to invest only in bonds with minimum ratings provided by the rating agencies. S&P issued 108 downgrades for US non-financial companies in August and September and 297 downgrades YTD, the most in a two-month period since May-June 2009 and the most in a year since 2009. Downgrades create a perverse supply problem for high yield. Even if issuance were to shut down, downgrades from investment grade to high yield and from high yield to distressed create net new supply in the lower tier sectors. This is relevant because the investors who play in the high yield and investment grade debt markets are two largely disjointed groups. Since there is a lot more investment grade paper outstanding than high yield, downgrades could potentially present even more of a supply issue for the high yield market than high yield issuance.
Ratings downgrades can have immediate impacts on securitized debt as CLOs and other products have ratings provisions that determine how cash flows are allocated to different investors in a securitization. For example, ratings downgrades can shut o ff payments to the bottom of the capital structure of many CLOs. The size limit on loans rated CCC and below is typically 7.5%. The average CLO exposure to CCC and below is currently up to 4.3% from 2.3% two years ago, while the fraction of CLO holdings just one notch above CCC has remained around 20-25% since 2009.14 If only a fraction of these near-CCC holdings is downgraded, the 7.5% limit will be exceeded, which will trigger a haircut to be applied to the collateral for the purpose of overcollateralization (OC) tests. Once a CLO fails the OC tests, cash flows are diverted away from equityholders. Because CLOs now absorb 70% of leveraged loan demand, the pricing of par loans will experience a quantum jump down to a new equilibrium level if 70% of demand is taken away. Not only will a halt in CLO issuance lead to a drop in leveraged loan demand, it will also create short-term supply pressures from liquidations of CLO warehouses for deals that did not get done. A number of CLO warehouses are significantly underwater today. We expect to see selling pressure from these warehouses as we approach year-end, especially given the pricing pressure on leveraged loans that has persisted since August. We saw the same dynamics when the ABSCDO and CLO markets shut down abruptly during the GFC
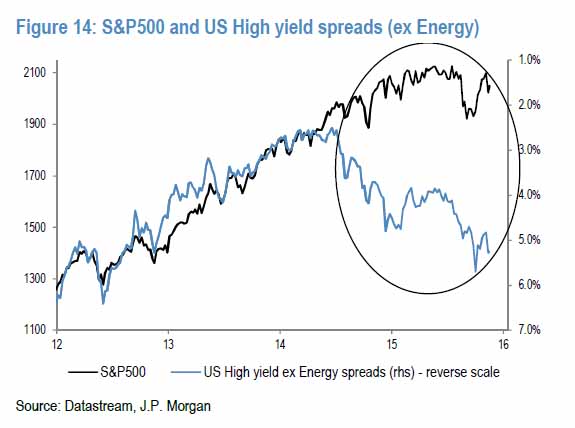
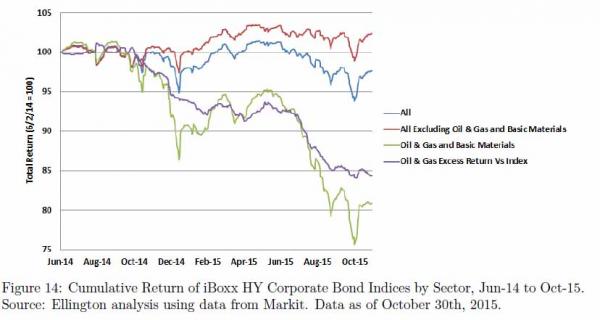
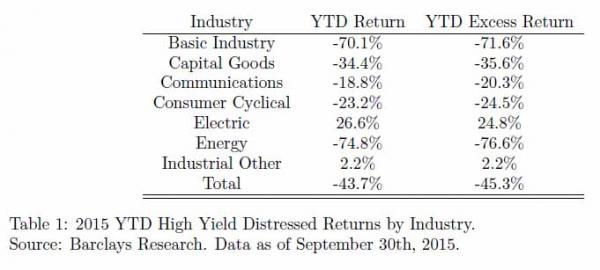
Telltale Sign #3: Falling Asset Prices Late last year, the first cracks in the high yield edifice began to show with the decline in oil prices. This led to a decline in high yield bond prices, but losses were contained mostly to the Energy sector. As concerns about China weakness intensified this past summer, Metals & Mining also began to feel the heat. However, as Figure 14 shows, while the returns in the Oil & Gas and Basic Materials sectors (the latter of which includes Metals & Mining) have been disastrous over the past year, the rest of the HY bond market is actually up YTD. Moreover, the relative decline in Oil & Gas and Basic Materials has been a slow bleed on a beta-adjusted basis versus the whole sector. While we have seen market jitters, contagion in HY has yet to really extend beyond industries directly impacted by lower oil prices.
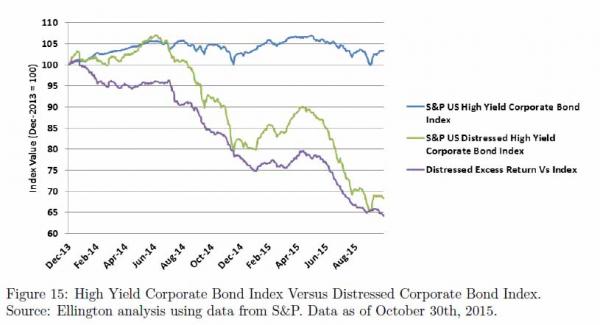
One can tell the same story with distressed versus non-distressed high yield sectors. Figure 15 shows the cumulative performance of the S&P US High Yield Corporate Bond Index versus the S&P US Distressed High Yield Corporate Bond Index. Again, the effects of initial fundamental weakness among the most distressed high yield borrowers have not yet percolated up to stronger credits. This suggests to us that it is not too late to get out now.
It is not just Energy and Basic Materials names that are contributing to poor distressed returns today. As Table 1 shows, in 2015 most distressed industry groups are seeing underperformance versus high yield.
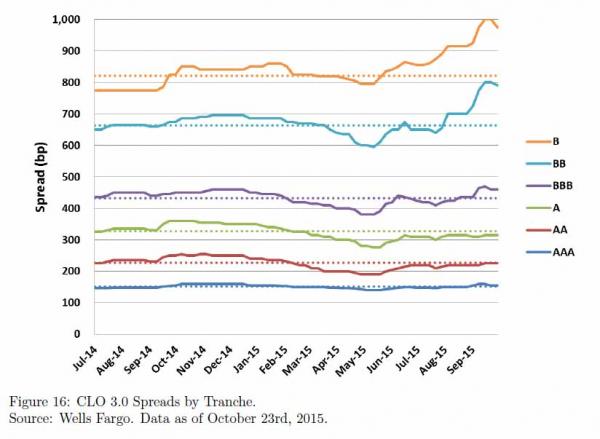
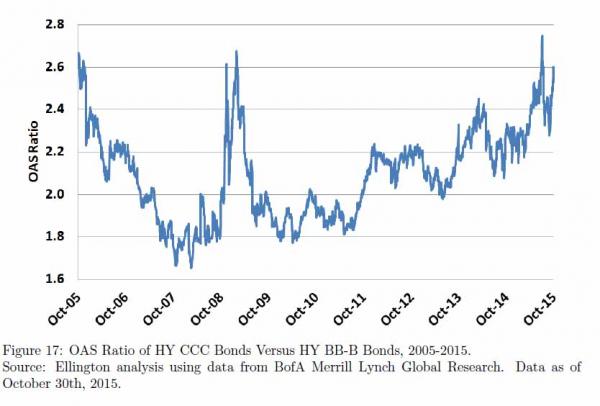
Individual sector weakness may at first seem like an isolated issue. However, the contagion process has already been set in motion as the riskiest segments of high yield now trade at multi-year wides. Investors in these assets include distressed investors, leveraged buyers of junior credit index and bespoke tranches, CLO mezz and equity investors, and buyers of new issue Energy sector debt this past spring. Not only are the most leveraged sectors usually the first to crack, but the most leveraged investors tend to have greatest exposure to these sectors. As these investors de-lever, price pressures induce the next round of deleveraging in a negative feedback loop. As shown in Figure 16, spreads on more senior new-issue CLO tranches (AAA through A) are below their recent trailing averages, while riskier new-issue tranches (BB through B) have widened substantially since July. The same divergence can be observed in the high yield bond market in Figure 17, where lower rated CCC collateral has widened versus B-rated collateral to levels not seen since the GFC.
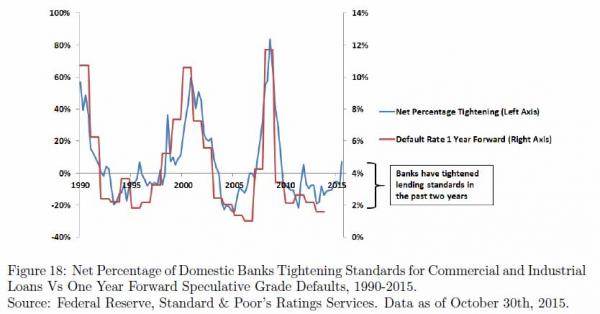
Telltale Sign #4: Tightening Lending Standards The marginal buyers in credit markets are the ones who set underwriting standards. Their losses mean that credit conditions are already tightening, and this resetting of underwriting standards is consistent with the high number of deals pulled in October. More generally, cov-lite deals are much harder to get done now. A number of new deals are being done, but with lower fees and wider spreads on the junior mezz tranches. As loan issuance has declined, so have the prospects for M&A among the riskiest borrowers. In recent months, banks that extended loans to high yield companies to finance buyouts are now unable to sell those loans to investors, who have become skittish about the worst quality high yield debt. We are seeing the immediate effects of this lack of a bid as banks who hold these loans on balance sheet must sell them by year-end in order to avoid significant capital charges, resulting in forced sales at a loss. The risk-averse behaviors of banks since the GFC suggest to us that banks will be much less inclined to underwrite risky deals going forward after suffering such losses. Recent trends in bank lending standards for corporate loans also demonstrate that tightening is underway, and this has historically been a strong predictor of high yield corporate default rates. As shown in Figure 18 below, there has been an 89% correlation over the past 25 years between changes in bank lending standards and speculative grade corporate defaults a year forward. This predictive relationship is strongly statistically signi cant, even after controlling for lagged default rates. This 89% correlation is much higher than the contemporaneous correlation of 62% between the two measures, suggesting that tightening lending standards drive defaults higher. In the third quarter of 2015, a net 7.4% of banks tightened lending standards for commercial and industrial loans, the tightest reading since 2009. While today's tightening in lending standards looks somewhat similar to that in 2011, that blip was more of a head-fake from the Euro crisis, and was therefore a short-term period of uncertainty originating from outside the corporate credit markets, compared to today's tightening where the major source of lender uncertainty is coming from corporate credit itself.
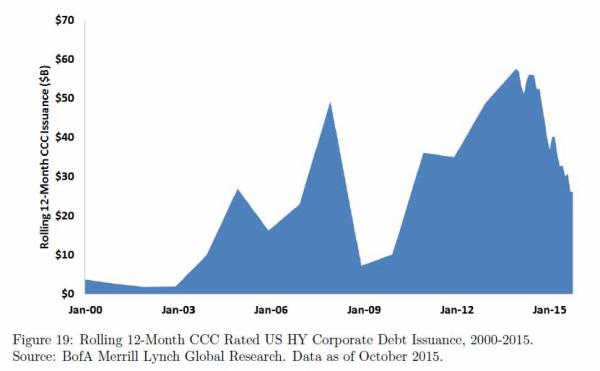
The predictive power of changes in lending standards suggests that tightening lending standards directly impact future default rates, as companies have difficulty rolling over debt. This demonstrates the mechanism by which contagion spreads from a few isolated sectors to all of high yield. As a few sectors underperform, banks experience write-downs and losses, which leads them to tighten overall lending standards. This leads to broader weakness, perpetuating a feedback loop that triggers a default cycle. An imminent Fed hiking cycle today is yet another reason to expect bank lending standards to continue to tighten. Deteriorating corporate fundamentals would be less of a concern in the short run if investors chose to ignore the fundamentals, but our distressed loan traders have been seeing the opposite. Investor appetite for risky loans has fallen off a cliff . We give four examples from the distressed sector, followed by some sobering statistics from the CLO market. First, Millennium Labs' leveraged loan was trading at par in April. The loan fell to $50 in June following allegations that the company was defrauding the government and would have to pay a fine of unknown magnitude. The loan facility is relatively large, at $1.775B in size. A few weeks ago, a block of $20 million (1% of total issuance) became available. Market chatter was around a price of $35 (30% below the market level at the time), for a total of $7 million in proceeds. Even at this steep discount, the block did not clear as the sourcing desk could not find enough buyers. Second, recent new issues in October have priced very wide to talk or have been pulled altogether. Four deals were pulled in October alone, including SiteOne, Xerium Technologies, Apple Leisure Group, and ABB Optical Group. Other deals are coming out very wide relative to price talk. Fullbeauty Brands had two term loans price recently, with initial talk at $99 and L+450 for an $820 million first lien, and $98 and L+850 for the second lien. These two loans ended up pricing at $93 and L+475 and $87 and L+900, respectively (the latter at a 13.2% yield!). In each of these cases, the banks syndicating these loan transactions were stung Third, we see weak investor appetite in combination with financial that appear to be managed to slide in just under the radar of regulatory scrutiny. Builders First Source came to market with a deal in April 2015 that was exactly 6.0x Debt/EBITDA, using a pro-forma EBITDA methodology that contained numerous add-backs, which added around $50 million to arrive at a final EBITDA number of $376 million. Excluding these add-backs, leverage would have been at 6.9x, above the 6.0x maximum level that the Federal Reserve and the OCC deemed to be prudent underwriting standards. Fourth, on September 15th, Moody's downgraded Sprint's senior unsecured debt from B2 to Caa1. Fears of downgrades by the other rating agencies to CCC, which would impact portfolio managers' CCC concentration limits, drove pricing on Sprint's $2.5 billion of bonds maturing in 2028 from $88.40 the day before the downgrade to $80.80 two days later. Being one of the largest names in the high yield universe with $30 billion in total debt outstanding, this price shock was felt across debt markets. While prices eventually recovered, such large price swings on a single ratings downgrade show the extent to which investors have been willing to sell debt at the first signs of trouble. Adding to this anecdotal evidence, there is an overall trend this year of declining issuance in lower-rated US HY corporate credit. As shown in Figure 19 below, total US CCC issuance this year stands at $30B on an annualized basis as of the end of October, down 48% from its peak of $58B in 2013. In contrast, overall US HY corporate debt issuance has fallen only 16% over the same period.
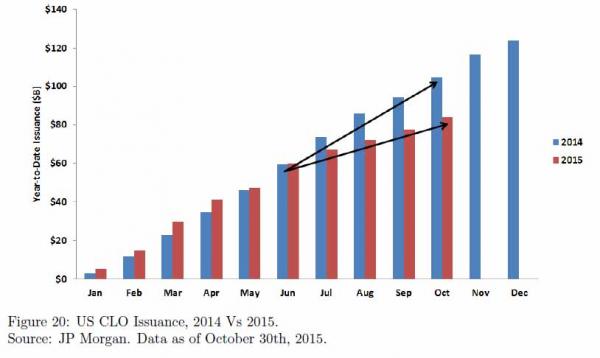
The CLO market has also exhibited recent signs of weakness on both the supply and demand side. In terms of supply, leveraged loan issuance is down more than a third year over year and since June, and the rate of US CLO issuance has fallen to half the 2014 rate (Figure 20). Pricing on new-issue CLO equity has weakened substantially given the weakness in high yield Energy, Metals & Mining, and Power/Utilities. Weakness in one sector is enough to make equity and BB tranches risky enough to lack a bid, which should impair CLO issuance.
|
|||
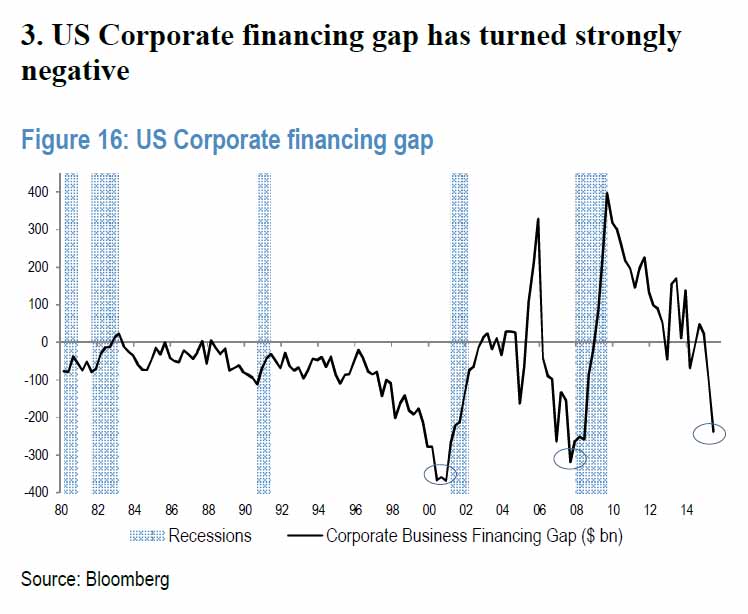
To JPM, This Is The Alarming Chart Suggesting The Next Recession "Is Just Around The Corner"By now it is clear to even the most tenured economists that the half of the US economy, the one that deals with manufacturing and industrial production, is sliding into, if not already, in recession with today's contractionaryChicago PMI and subzero Dallas Fed data confirming this deterioration. But while the NBER is notoriously behind the curve when it comes to determining the onset of recessions, the market may have already spoken, and nowhere louder than in the collapse of corporate cash flow generation. This collapse in EBITDA is also what we cautioned three weeks ago is the biggest risk facing the economy. This drop in cash flow is also one of the key catalysts listed by JPM in its report (noted earlier) which said it is time to lower allocation to US equity exposures as "the long period of indiscriminately buying any dip might be coming to an end." Specifically, JPM looks at the corporate financing gap, the difference between organic cash flow and the outflow on dividends and buybacks, and is very concerned with what it sees.
And here is the chart which JPM believes suggests the next downturn may be "just around the corner."
Will it be different this time? Here JPM is pessimistic again, for the simple reason that any attempts to extrapolate profit margins, the lifeblood of corporate cash flows, suggests that much more pain is ahead: "If we were to perform a simple modelling of NIPA margins, using as inputs the unemployment rate, wages and nominal GDP growth, we get as a result a clear deceleration in profit margins next year."
One wonders, and can only hope, that these observations are part of the Fed's deliberations as Yellen and company sit down in two weeks to discuss whether the US economy is finally "strong enough" to weather the first tightening cycle in nearly a decade.
|
|||
| TO TOP | |||
| MACRO News Items of Importance - This Week | |||
GLOBAL MACRO REPORTS & ANALYSIS |
|||
US ECONOMIC REPORTS & ANALYSIS |
|||
| CENTRAL BANKING MONETARY POLICIES, ACTIONS & ACTIVITIES | |||
| Market | |||
| TECHNICALS & MARKET |
|
||
| COMMODITY CORNER - AGRI-COMPLEX | PORTFOLIO | ||
| SECURITY-SURVEILANCE COMPLEX | PORTFOLIO | ||
| THESIS - Mondays Posts on Financial Repression & Posts on Thursday as Key Updates Occur | |||
| 2015 - FIDUCIARY FAILURE | 2015 | THESIS 2015 |  |
| 2014 - GLOBALIZATION TRAP | 2014 |  |
|
 |
|||
|
2013 2014 |
 |
||
|
|||
2011 2012 2013 2014 |
 |
||
| THEMES - Normally a Thursday Themes Post & a Friday Flows Post | |||
I - POLITICAL |
|||
| CENTRAL PLANNING - SHIFTING ECONOMIC POWER - STATISM | THEME | ||
- - CORRUPTION & MALFEASANCE - MORAL DECAY - DESPERATION, SHORTAGES. |
THEME |  |
|
| - - SECURITY-SURVEILLANCE COMPLEX - STATISM | M | THEME | |
| - - CATALYSTS - FEAR (POLITICALLY) & GREED (FINANCIALLY) | G | THEME | |
II-ECONOMIC |
|||
| GLOBAL RISK | |||
| - GLOBAL FINANCIAL IMBALANCE - FRAGILITY, COMPLEXITY & INSTABILITY | G | THEME | |
| - - SOCIAL UNREST - INEQUALITY & A BROKEN SOCIAL CONTRACT | US | THEME | |
| - - ECHO BOOM - PERIPHERAL PROBLEM | M | THEME | |
| - -GLOBAL GROWTH & JOBS CRISIS | |||
| - - - PRODUCTIVITY PARADOX - NATURE OF WORK | THEME | MACRO w/ CHS |
|
| - - - STANDARD OF LIVING - EMPLOYMENT CRISIS, SUB-PRIME ECONOMY | US | THEME | MACRO w/ CHS |
| STANDARD OF LIVING - SUB-PRIME ECONOMY | US | THEME | MACRO w/ CHS |
III-FINANCIAL |
|||
| FLOWS -FRIDAY FLOWS | MATA RISK ON-OFF |
THEME |  |
FLOWS - Liqudity, Credit & Debt
|
12-04-15 | THEMES | |
| CRACKUP BOOM - ASSET BUBBLE | THEME | ||
| SHADOW BANKING - LIQUIDITY / CREDIT ENGINE | M | THEME | |
| GENERAL INTEREST |
|
||
| THEMES - 2016 RECESSION | 11-26-15 |
||
| STRATEGIC INVESTMENT INSIGHTS - Weekend Coverage | |||
|
SII | ||
| 12-05-15 | SII | ||
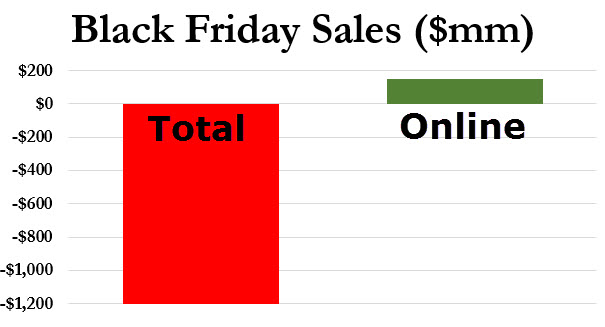
Submitted by Tyler Durden on 11/29/2015 Black Friday Total Sales Crash 10% (Despite Rise In Online Spend)We can hear the mainstream media now - "Great News Everyone!! The American consumer is back" - online sales on Black Friday rose 10% to $1.7 billion which ComScore says shows "strong spending." The only problem is - which we suspect will be oddly missing from the mainstream narrative, as ShopperTrak reports total sales on Black Friday crashed 10% to $10.4 billion. While blame has been placed on early opening on Thanksgiving, that is false too since spending on that day also plunged 10%. So, the sales news is unequivocally bad - which is hardly surprising given the collapse in consumer confidence. So to clarify... (via The Guardian)
So, fewer customers ventured out for the traditional busiest shopping day of the year, while online retailers saw sales jump... (via Comscore)
So to clarify total sales collapsed by $1.2 billion (even as online sales rose by $150 million)... but everything will be awesome once Americans get back to work and start using their work computers to buy buy buy.... * * * So, for those with difficulty with reading and math...
The National Retail Federation just held their post-Black Friday conference call to clarify evewrything...
|
|||
|
SII | ||
|
SII | ||
|
SII | ||
| TO TOP | |||


Read More - OUR RESEARCH - Articles Below

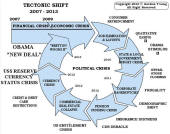
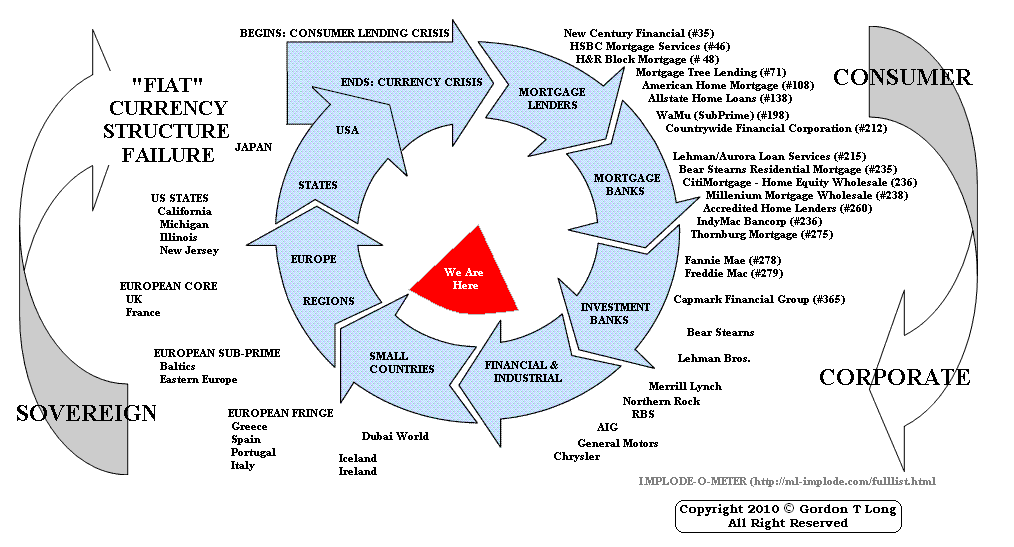
Tipping Points Life Cycle - Explained
Click on image to enlarge
TO TOP
 |
YOUR SOURCE FOR THE LATEST THINKING & RESEARCH
|
�
TO TOP