|
JOHN RUBINO'SLATEST BOOK |
||||||||||||||||||||||||||||||||||||||||||||||||||||||||||||||||||||||||||||||||||||||||||||||||||||||||||||||||||||||||||||||||||||||||||||||||||||||||||||||||||||||||||||||||||||||||||||||||||||||||||||||||||||||||||||||||||||||||||||||||||||||||||||||||||||||||||||||||||||||||||
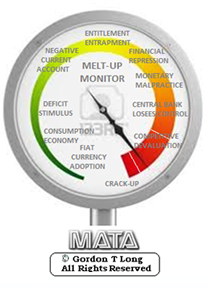
"MELT-UP MONITOR "
Meltup Monitor: FLOWS - The Currency Cartel Carry Cycle - 09 Dec 2013 Meltup Monitor: FLOWS - Liquidity, Credit & Debt - 04 Dec 2013 Meltup Monitor: Euro Pressure Going Critical - 28- Nov 2013 Meltup Monitor: A Regression-to-the-Exponential Mean Required - 25 Nov 2013
|

![]()
"DOW 20,000 "
Lance Roberts Charles Hugh Smith John Rubino Bert Dohman & Ty Andros
|
HELD OVER
Currency Wars
Euro Experiment
Sultans of Swap
Extend & Pretend
Preserve & Protect
Innovation
Showings Below
"Currency Wars "
|

"SULTANS OF SWAP" archives open ACT II ACT III
ALSO Sultans of Swap: Fearing the Gearing! Sultans of Swap: BP Potentially More Devistating than Lehman! |
"EURO EXPERIMENT"
archives open EURO EXPERIMENT : ECB's LTRO Won't Stop Collateral Contagion!
EURO EXPERIMENT: |
![]()
"INNOVATION"
archives open |

"PRESERVE & PROTE CT"
archives open |

RECAP
Weekend Nov. 29th, 2015
Follow Our Updates
onTWITTER
https://twitter.com/GordonTLong
ARCHIVES
| NOVEMBER | ||||||
| S | M | T | W | T | F | S |
| 1 | 2 | 3 | 4 | 5 | 6 | 7 |
| 8 | 9 | 10 | 11 | 12 | 13 | 14 |
| 15 | 16 | 17 | 18 | 19 | 20 | 21 |
| 22 | 23 | 24 | 25 | 26 | 27 | 28 |
| 29 | 30 | |||||
KEY TO TIPPING POINTS |
| 1- Bond Bubble |
| 2 - Risk Reversal |
| 3 - Geo-Political Event |
| 4 - China Hard Landing |
| 5 - Japan Debt Deflation Spiral |
| 6- EU Banking Crisis |
| 7- Sovereign Debt Crisis |
| 8 - Shrinking Revenue Growth Rate |
| 9 - Chronic Unemployment |
| 10 - US Stock Market Valuations |
| 11 - Global Governance Failure |
| 12 - Chronic Global Fiscal ImBalances |
| 13 - Growing Social Unrest |
| 14 - Residential Real Estate - Phase II |
| 15 - Commercial Real Estate |
| 16 - Credit Contraction II |
| 17- State & Local Government |
| 18 - Slowing Retail & Consumer Sales |
| 19 - US Reserve Currency |
| 20 - US Dollar |
| 21 - Financial Crisis Programs Expiration |
| 22 - US Banking Crisis II |
| 23 - China - Japan Regional Conflict |
| 24 - Corruption |
| 25 - Public Sentiment & Confidence |
| 26 - Food Price Pressures |
| 27 - Global Output Gap |
| 28 - Pension - Entitlement Crisis |
| 29 - Central & Eastern Europe |
| 30 - Terrorist Event |
| 31 - Pandemic / Epidemic |
| 32 - Rising Inflation Pressures & Interest Pressures |
| 33 - Resource Shortage |
| 34 - Cyber Attack or Complexity Failure |
| 35 - Corporate Bankruptcies |
| 36 - Iran Nuclear Threat |
| 37- Finance & Insurance Balance Sheet Write-Offs |
| 38- Government Backstop Insurance |
| 39 - Oil Price Pressures |
| 40 - Natural Physical Disaster |
Reading the right books?
No Time?
We have analyzed & included
these in our latest research papers Macro videos!
OUR MACRO ANALYTIC
CO-HOSTS
John Rubino's Just Released Book
Charles Hugh Smith's Latest Books


Our Macro Watch Partner
Richard Duncan Latest Books
MACRO ANALYTIC
GUESTS
F William Engdahl


OTHERS OF NOTE
Book Review- Five Thumbs Up
for Steve Greenhut's Plunder!


![]()
TODAY'S TIPPING POINTS
|
Have your own site? Offer free content to your visitors with TRIGGER$ Public Edition!
Sell TRIGGER$ from your site and grow a monthly recurring income!
Contact [email protected] for more information - (free ad space for participating affiliates).
HOTTEST TIPPING POINTS |
Theme Groupings |
||
We post throughout the day as we do our Investment Research for: LONGWave - UnderTheLens - Macro
|
|||
|
MOST CRITICAL TIPPING POINT ARTICLES TODAY
|
|
||
| MOST CRITICAL TIPPING POINT ARTICLES THIS WEEK - Nov. 22nd, 2015 - Nov 28th, 2015 | |||
| BOND BUBBLE | 1 | ||
| RISK REVERSAL - WOULD BE MARKED BY: Slowing Momentum, Weakening Earnings, Falling Estimates | 2 | ||
| GEO-POLITICAL EVENT | 3 | ||
| CHINA BUBBLE | 4 | ||
| JAPAN - DEBT DEFLATION | 5 | ||
EU BANKING CRISIS |
6 |
||
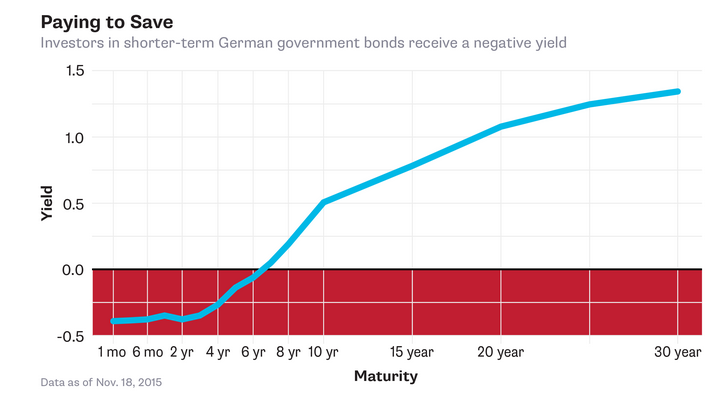
Swiss Bank Hits Customers With Negative Interest Rates; Crazy? What About Velocity?Alternative Bank Schweiz (ABS), a small bank in Switzerland broke the negative interest rate on deposits barrier, CHARGING customers to cake their money. (emphasis in caps from the article). The Alternative Bank Schweiz wrote to customers telling them they would face a -0.125 per cent rate on their money from 2016 – and a -0.75 per cent rate on deposits above 100,000 Swiss francs.Less Than Zero Bloomberg offers a "quick take" on Less Than Zero. Imagine a bank that pays negative interest. Depositors are actually charged to keep their money in an account. Crazy as it sounds, several of Europe’s central banks have cut key interest rates below zero and kept them there for more than a year. For some, it’s a bid to reinvigorate an economy with other options exhausted. Others want to push foreigners to move their money somewhere else. Either way, it’s an unorthodox choice that has distorted financial markets and triggered warnings that the strategy could backfire. If negative interest rates work, however, they may mark the start of a new era for the world’s central banks.
Economic Distortions M2 Velocity 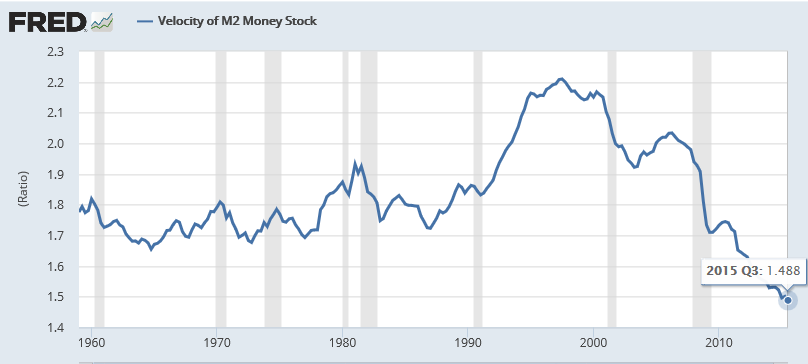 M1 Velocity 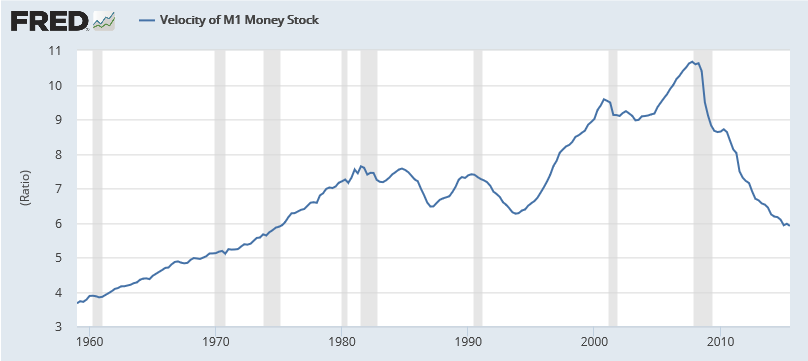 MZM Velocity 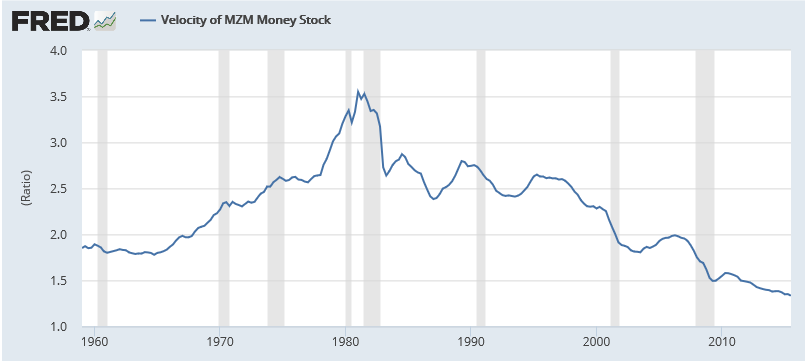 TMS Velocity
So is velocity 1.7, 5.9, 1.5, 1.3 or something else?
Conclusions
Curiously, economists are concerned about "falling velocity" as if it means something other than the central banks are printing money that sits as excess reserves. Inquiring minds may also be interested in the Frank Shostak's 2002 article Is Velocity Like Magic? Much of my understanding of velocity comes from that article. Mario Draghi on Velocity On November 20, Draghi Pledged to ‘Do What We Must’ to Boost Sluggish Inflation. Mario Draghi has dropped his clearest hint yet that the European Central Bank is about to inject more monetary stimulus into the eurozone economy, brushing aside staunch opposition from Germany’s powerful Bundesbank.Question for Draghi I laughed out loud at that last line. If QE increases velocity, then why is velocity declining in the US, in Europe, and in Japan? By the way, bank reserves do not circulate. Reserves are deposits that are not lent out. One can even argue that money does not really circulate per se, as it has to be held at all times by someone. Negative Interest Rates Crazy? Let's return to this statement by Bloomberg: "Crazy as it sounds, several of Europe’s central banks have cut key interest rates below zero and kept them there for more than a year". Desperation and Hubris
It's crazy to keep trying things that cannot possibly work, over and over again. |
|||
| STOCK MARKET VALUATIONS | 11-24-15 | 10 - US Stock Market Valuations | |
S&P 500 Earnings Slumped By Most in Six Years,Worse to ComeThird-quarter U.S. earnings look set to be the worst since 2009 and the trend remains negative through year-end. Profit fell 3.3 percent on a share-weighted basis in the latest quarter, based on data from about 96 percent of S&P 500 companies already reporting. This marks a second consecutive quarter of negative earnings growth. The energy sector saw the biggest damage, hurt by plummeting oil prices, with earnings dropping 57 percent in the third quarter, year on year. Dollar strength is also hurting U.S. profits and revenues, according to Societe Generale. “The question for us is not are we in a U.S. profit recession, but how bad is it likely to get and what are the implications for the wider U.S. economy, and with that massive consensus long on the U.S. dollar,” SocGen quantitative analysts led by Andrew Lapthorne wrote in a Nov. 19 note. "We continue to be very concerned about U.S. profits. For over a year now excuse after excuse has been rolled out as to why U.S. profits are not actually as weak as the headline numbers imply, but the reality is the U.S. profits and revenues are declining and the strong U.S. dollar is a large part of the problem," they wrote. Decline and Fall: U.S. Earnings Seen Negative Through Q4
The negative trend is set to continue into the fourth quarter, with analysts expecting a 5 percent year-on-year decline in S&P 500 profits, according to data compiled by Bloomberg. In dollar terms, profits from S&P 500 companies have fallen by about $25 billion in the first three quarters of the year compared with the same period in 2014, while revenues have dropped by $287 billion. |
|||
| TO TOP | |||
| MACRO News Items of Importance - This Week | |||
GLOBAL MACRO REPORTS & ANALYSIS |
|||
US ECONOMIC REPORTS & ANALYSIS |
|||
| CENTRAL BANKING MONETARY POLICIES, ACTIONS & ACTIVITIES | |||
| Market | |||
| TECHNICALS & MARKET |
|
||
| STUDIES - MACRO pdf | |||
STUDIES - Q3 EARNINGS |
11-25-15 | ||
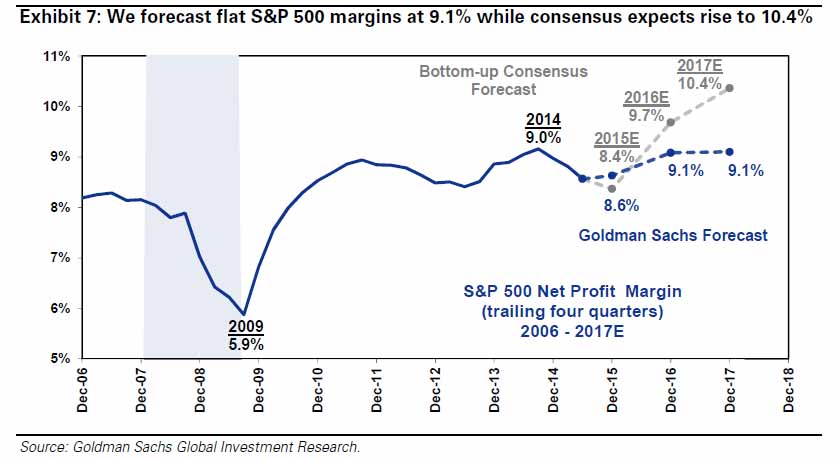
Submitted by Tyler Durden on 11/24/2015 Apple Accounted For 20% Of All U.S. Margin Expansion Since 2010 - Why This MattersEarlier we explained why Goldman believes that in 2016 the market, which is now about 1% higher than where it closed in 2014, will also go exactly nowhere. The reason for this pessimism can be summarized in three bullet points:
It is bullet iii) that is the most important, because here the divergence between Wall Street's hopium-driven margin euphoria is most visible.
According to Goldman, "tech accounted for 50% of the overall S&P 500 expansion during the past five years (Apple is responsible for 20% of rise). Tech sector now has margins (18%) that are twice the overall market." That tremendous tech, but mostly AAPL-driven, margin growth has now ended. So can this torrid surge in tech margins continue? Goldman's answer is a resounding no.
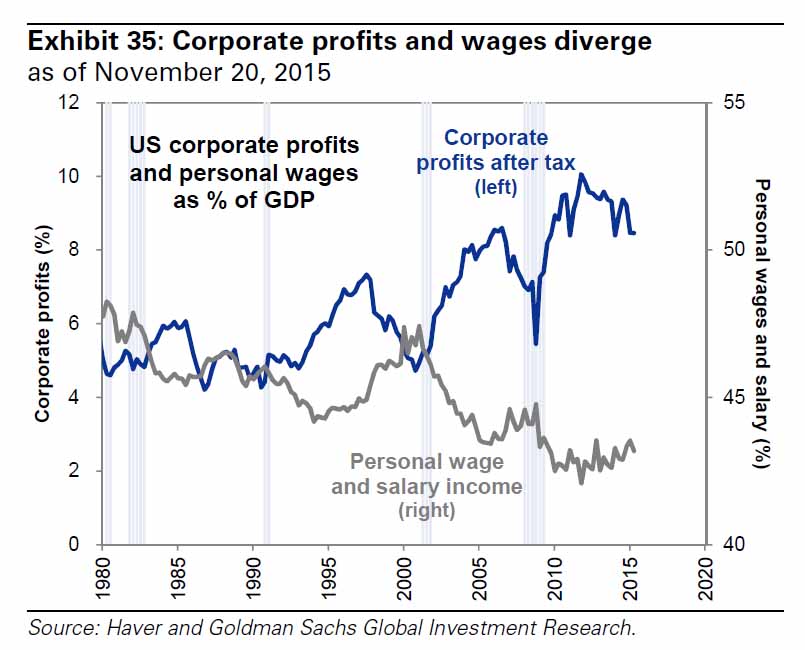
But perhaps the one chart that confirms that one can't have their wage rising cake and eat corporate profits too is the following:
In other words, if the Fed is hiking "because it sees something about the economy" that few others do - i.e., rising wages - then by definition that means that profit margins will contract as growing wages take out ever bigger chunks of the corporate bottom line. So with sales declines set posied to accelerate due to the soaring dollar, central bank liquidity-driven multiple expansion no longer feasible and corporate margin growth set to resume its contractionary path again, we wonder where will the next leg higher in stocks come from. Unless, of course, the whole "the Fed is hiking because theS&P500 has topped out economy is recovering" was just the latest economist consensus mirage.
|
|||
| COMMODITY CORNER - AGRI-COMPLEX | PORTFOLIO | ||
| SECURITY-SURVEILANCE COMPLEX | PORTFOLIO | ||
| THESIS - Mondays Posts on Financial Repression & Posts on Thursday as Key Updates Occur | |||
| 2015 - FIDUCIARY FAILURE | 2015 | THESIS 2015 |  |
| 2014 - GLOBALIZATION TRAP | 2014 |  |
|
 |
|||
|
2013 2014 |
 |
||
THE FED FLUNKS! My Austrian Economic Speech at the NY Federal Reserve
Investing based on The Austrian school of Economics The infographic above shows some differences in Keynesian and Austrian views. Courtesy of The Austrian Insider. FRA Interview of Robert Wenzel by FRA Co-founder Gordon T Long. Across well-known literature, the Austrian school of economics has earned and put its indelible mark on the complicated world of economic analysis and theory. The school of thought varies significantly from the mainstream schools of economics like the classical, neoclassical and Keynesian schools of thought. In essence the Austrian school of thought believes in using logical thoughts to explain and solve economic problems rather than getting technical and going into mathematics to explain the same problems. “The key to understanding is that what you have with mainstream economists is that they look at things from a very mathematical, very empirical approach… unlike in physical sciences you cannot do that for the science of economics because you’re dealing so many variables like changes and desires” Unlike the mainstream none-Austrian economists, Wenzel believes that there’s a lot to be understood from the economy based on logical build up from solid premises. He goes on to mention that another key aspect to be understood is that Austrian economists believe that when the Fed injects money into certain sectors of the economy, it’s those sectors that turn to boom. According to Wenzel, when the Feds eventually start tightening this money supply it leads to a crash. On the current economy: “We’re in a period of accelerated money supply” Wenzel thinks there could be an increase in price inflation and the possibility of another dip in the price of oil. Explaining how we have inflation in some areas and deflation in others when we’ve been pumping money into the system, he explains it by outlining how it depends on how quickly people want to spend the money. “if there’s a great desire to hold money, you’re not going to see the inflation right away” When people don’t spend money what happens is you have money building up in cash balances which Wenzel terms “the desire to hold cash balances”. With this you see people reluctant to spend money and hence a low velocity of money. On the confusing environment of economics and how understanding the Austrian school can help to clear things up .... Understanding the business cycle and inflation comes about in terms of the Austrian school of thought. It definitely helps to clear a lot of things up but even more can be taken from this approach. The methodology additionally helps out in terms of having people analyzing the world through logic rather than attacking it solely with empirical data. On considering Quantitative easing and going into negative nominal rates .... QE is a method where the fed prints a lot of money and buys long durtion debt. The negative nominal rates idea is based on the Keynesian idea that it’s spending that helps the economy to grow, so the idea is to use negative rates to pressure people to spend their money. Wenzel calls this “a tax on holding money”. Asked if he sees Hyperinflation in the future: It could happen at some point. The Fed’s target of 2% could easily go up to three 3% with accelerated printing of money. At this point they might raise rates but if the inflation is at 5% and they raise rates from 12bp to 2% that still won’t be able to fight the inflation. However it may be too soon to say hyperinflation. The business cycle should be understood as a boom and bust cycle. “Whatever is going up now does not necessarily mean it will go up long term. The bust will occur but they will pump it up with new fed printing, which is eventually where the inflation comes in”
|
|||
2011 2012 2013 2014 |
 |
||
| THEMES - Normally a Thursday Themes Post & a Friday Flows Post | |||
I - POLITICAL |
|||
| CENTRAL PLANNING - SHIFTING ECONOMIC POWER - STATISM | THEME | ||
- - CORRUPTION & MALFEASANCE - MORAL DECAY - DESPERATION, SHORTAGES. |
THEME |  |
|
| - - SECURITY-SURVEILLANCE COMPLEX - STATISM | M | THEME | |
| - - CATALYSTS - FEAR (POLITICALLY) & GREED (FINANCIALLY) | G | THEME | |
II-ECONOMIC |
|||
| GLOBAL RISK | |||
| - GLOBAL FINANCIAL IMBALANCE - FRAGILITY, COMPLEXITY & INSTABILITY | G | THEME | |
| - - SOCIAL UNREST - INEQUALITY & A BROKEN SOCIAL CONTRACT | US | THEME | |
| - - ECHO BOOM - PERIPHERAL PROBLEM | M | THEME | |
| - -GLOBAL GROWTH & JOBS CRISIS | |||
| - - - PRODUCTIVITY PARADOX - NATURE OF WORK | THEME | MACRO w/ CHS |
|
| - - - STANDARD OF LIVING - EMPLOYMENT CRISIS, SUB-PRIME ECONOMY | US | THEME | MACRO w/ CHS |
| STANDARD OF LIVING - SUB-PRIME ECONOMY | US | THEME | MACRO w/ CHS |
III-FINANCIAL |
|||
| FLOWS -FRIDAY FLOWS | MATA RISK ON-OFF |
THEME |  |
| 11-27-15 | FLOWS |
||
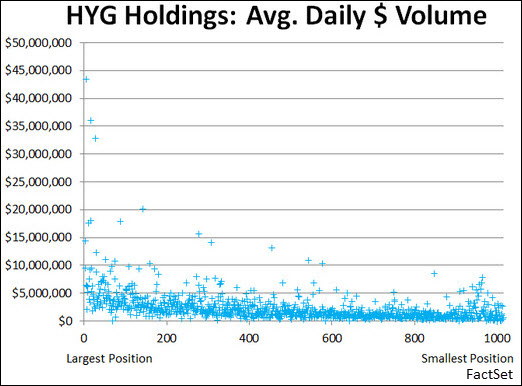
How Illiquid Are Bond ETFs, Really? (Spoiler Alert: Very!)"Transcendent liquidity" is a somewhat silly-sounding phrase coined by the equally silly Matt Hougan, CEO of ETF.com, to discuss the odd situation in fixed-income ETFs—specifically, fixed-income ETFs tracking narrow corners of the market like high-yield bonds. But it's increasingly the focus of regulators and skeptical investors like Carl Icahn. Simply put: Flagship funds like the iShares iBoxx High Yield Corporate Bond ETF trade like water, while their underlying holdings don't. Is this a real problem, or a unicorn? Defining LiquidityThe problem with even analyzing this question starts with definitions. When most people talk about ETF liquidity, they're actually conflating two different things: tradability and fairness. Tradability is actually a pretty simple concept: How well will the market let me get in or out of an ETF? And for narrow fixed-income ETFs (I'm limiting myself to corporates, in this analysis), most investors should be paying attention to the fairly obvious metrics, e.g., things like median daily dollar volume and time-weighted average spreads. By these metrics, a fund like HYG looks like the easiest thing to trade ever:
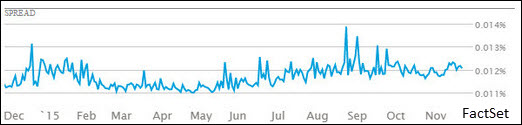
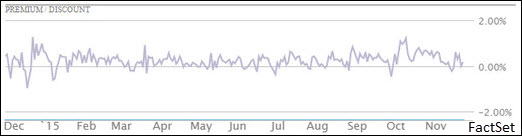
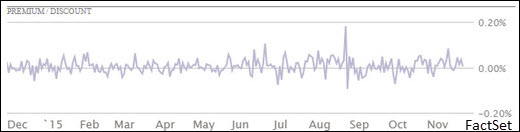
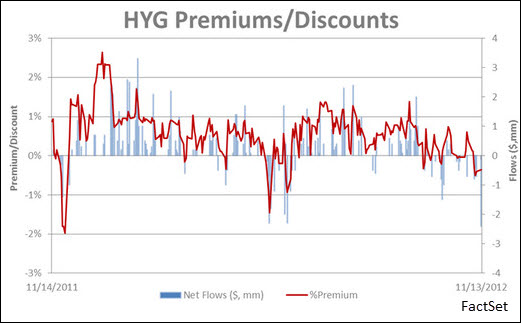
On a value basis, the average spread for HYG on a bad day of the past year is under 2 basis points. It's consistently a penny wide on a handle around $80, with nearly $1 billion changing hands on most days. That puts it among the most liquid securities in the world. And that easy liquidity is precisely what has the SEC—and some investors—concerned. FairnessBut that's tradability, not fairness. Fairness is a unique concept to ETF trading. We don't talk about whether the execution you got in Apple was "fair." You might get a poor execution, or you might sell on a dip, but there's no question that your properly settled trade in Apple is "fair." That's because Apple stock is always worth precisely what you pay for it. That's the entire function of the market—to determine the fair price for Apple based on the collective wisdom of buyers and sellers. Of course, even Apple can get a bad print, and there are rules for breaking really erroneous trades, but for the most part, if Apple's down 10%, nobody considers it anything other than a bad day for Apple. In an ETF, however, there is an inherent "fair" price—the net asset value of the ETF at the time you trade it—intraday NAV or iNAV. If the ETF only holds Apple and Microsoft, that fair price is easy to calculate, and is in fact disseminated every 15 seconds by the exchange. But when the underlying securities are illiquid for some reason (hard to value, time-zone disconnects or just obscure), assessing the "fair" price becomes difficult, if not impossible. If the securities in the ETF are all listed in Tokyo, then your execution at noon in New York will necessarily not be exactly the NAV of the ETF, because none of those holdings is currently trading. Premiums and DiscountsIn the case of something like corporate bonds, the issue isn't one of time zone, it's one of market structure. Corporate bonds are an over-the-counter, dealer-based market. That means the iNAV of a fund like HYG is based not on the last trade for each bond it holds (which could literally be days old), but on a pricing services estimate of how much each bond is worth. That leads to the appearance of premiums or discounts that swing to +/- 1%. HYG premia: Compare that with the handful of basis points typical in the SPDR S&P 500 ETF. SPY premia: Importantly, this is over the last year, which has been a pretty calm market for HYG. During crisis periods, HYG can spike a premium or discount of more than 10%. The reason is pretty simple: profit motive. ETFs only trade in line with their underlying securities because authorized participants (APs) can make or dispose of new shares through the creation and redemption process. If there is a premium, they can sell at that premium and make new shares by delivering the underlying. They can do the opposite if the ETF is at a discount: buying the cheap ETF shares and returning them to the issuer for a basket of underlying securities. In each case, they're buying low and selling high. But if the underlying market can't actually handle the volume implied in making or redeeming shares, the APs will let the price drift until the gap is so wide they're positive they can make money. And because there are multiple APs all trying to book a profit, when the gap widens and stays wide, it points to costs and risks that may not be obvious just looking at the numbers. In the case of corporate bonds, the reality is that the underlying markets simply can't absorb large amounts of creation and redemption activity, so the flow of money into or out of the ETFs will almost always force a premium or discount. Take a look at 2012 in HYG—a period where we had a nice clean opinion shift on junk bonds to analyze:
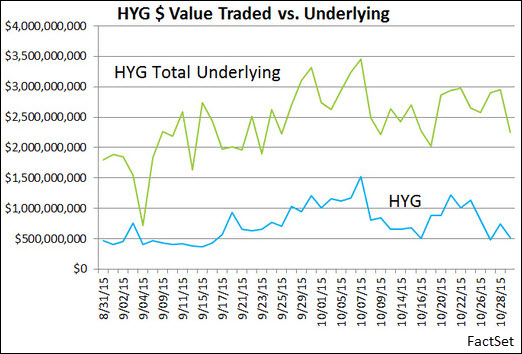
You can see in the fall of 2011, everyone wanted out, and the fund traded to a 2% discount. Then everyone wanted back in for months, and it consistently traded at premiums as high as 2.5%. Then in mid-2012, again, people wanted out, and boom, right back to a 1.5% discount. It's critical to note that all of these premiums and discounts happened while HYG continued to trade a penny wide. So there was enormous liquidity—it was just centered around a price that was "too high" or "too low." This connect can have two explanations: Either the ETF is in fact "right" and is serving as the price discovery vehicle, or the NAV is "right" and the ETF is overpriced. It's not possible to prove without question which is going on, but I tend to side with the market. If billions of dollars are going to change hands at a price that's "too high," I think the billions of dollars are the market, and this is price discovery on an illiquid market. The Underlying ProblemSo just how illiquid are corporate bonds? Very. Consider the dollar value traded in HYG, and the dollar value traded in all of the underlying bonds it owns, combined, in a two-month window this fall:
While it's not the case that HYG trades more than the overall portfolio consistently, it's definitely the case that HYG provides much more accessible liquidity than the underlying bonds—and that's what makes the SEC and skeptics nervous, because that on-screen liquidity can dry up. Looking under the hood, the average daily dollar volume in the underlying bonds is just $3.4 million:
In fact, if you look at the largest corporate bond ETFs, the picture doesn't get much better when you go into the investment-grade or short-duration space. The most liquid ETF, the iShares iBoxx $ Investment Grade Corporate Bond ETF, has underlying bonds that on average only trade $4.7 million per day, and short term bonds, represented by the Vanguard Short-Term Corporate Bond ETF, fare worst of all. By comparison, the ETF on the equity side you'd expect to be truly illiquid—the iShares Russell 2000 ETF—has underlying holdings that are an order of magnitude more traded on a daily basis than the most liquid bonds issued by the largest companies in the world. Days-to-TradeI've tossed an additional stat in the table above—days-to-trade. The SEC has proposed that mutual funds and ETFs manage the liquidity of their portfolios such that 85% of a fund consists of positions that could be liquidated within seven days without market impact. (An interesting test, especially for bond funds. After all, the whole point of bonds is to collect interest until maturity and get your capital back.) Larger funds with big positions will obviously be more impacted than small funds, so when you combine the huge size of a fund like VCSH with the relative illiquidity of its holdings, it's hard to see how they pass the test. Nobody would suggest that a fund would ever literally just try and dump an entire day's worth of volume into the market, day after day, and not impact prices. Instead, a trade impact model would map out a much longer time window to unwind a position. So the true time to unwind the average VCSH position might actually be more like 40 or 60 days (and on top of that, VCSH is just a share class of a larger mutual fund). Does that mean every corporate bond fund closes? Probably not - I expect the SEC to revise their proposal several times before anything becomes the law of the land. However, it will likely highlight the real problem here—the broken nature of the bond market (and possibly make it worse, if significant assets must be liquidated to comply with the rules). Already only about one-third of corporate bonds actually trade more than once every few months, and just 11% of the listed corporate ponds represent almost 60% of the actual dollars trading in corporate bonds, according to Tabb group. The dealer market has collapsed, and all that's left are investors trading the same few bonds back and forth, leaving pricing services guessing with bigger and bigger margins of error on the real value of illiquid debt. That's the real problem. And it's not one the SEC can fix by targeting "transcendent liquidity" in ETFs.
|
|||
| CRACKUP BOOM - ASSET BUBBLE | THEME | ||
| SHADOW BANKING - LIQUIDITY / CREDIT ENGINE | M | THEME | |
| GENERAL INTEREST |
|
||
| THEMES - 2016 RECESSION | 11-26-15 |
||
November 20, 2015 Global Recession a High Probability“I have long made the claim that the transnational nature of Europe cannot be sustained. The divergent economic interests of EU countries, some with unemployment over 20 percent, some with it under 5 percent, meant that it was impossible for all of them to live not only under the same monetary regime, but under the same trade regime, which we cannot call free trade with agriculture, among other things, being protected. This would lead to a focus on national interest and on a resurrected nation-state.” Following up on last week’s piece highlighting the catastrophe of negative interest rates created by Central Bank Policy, I found myself thinking, as I’m sure you did too, a lot about the catastrophe in Paris. Outside of the dark vs. light human battle (of which I believe light will win), I gave thought to the potential unwinding of the great European Union experiment and what it might mean for our collective financial health. Coincidentally, a great geopolitical strategist piece crossed my desk this week. I share it with you below. Maybe I’m obsessing over what I feel is transitory faith placed in global central bankers (the Fed, ECB, JCB) but I can’t help recalling Bernanke’s “Goldilocks” quote on February 14, 2007 (New York Times) and the happy no-doc mortgage days in 2007/08. The economy was not too hot, not too cold but just right. Right? “Fear and euphoria are dominant forces, and fear is many multiples the size of euphoria. Bubbles go up very slowly as euphoria builds. Then fear hits, and it comes down very sharply. When I started to look at that, I was sort of intellectually shocked. Contagion is the critical phenomenon which causes the thing to fall apart.” I felt a bit like Chicken Little in my writings back then. The “sky is falling” and all that sort of thing. Was the sky falling or was opportunity being created. It depends on your portfolio positioning at that time. It turned out to be a great opportunity if one was prepared. Wait and see what happens if Italy, Spain or Portugal pulls a Greek-like default move. Contagion being the “critical phenomenon”. I feel a little bit like Chicken Little again today. In the book House of Cards, William Cohan exposed the corporate arrogance, power struggles and deadly combination of greed and inattention which led to the collapse of not only Bear Stearns and Lehman Brothers, but the very foundation of Wall Street. Despite Fed Chairs Greenspan and Bernanke’s inability to (admittedly) see the risks, there was abundant evidence that I and others wrote frequently about prior to the crisis. Though truthfully, in my wildest dreams, I didn’t imagine the entire financial system would come so near to collapse. “Sort of intellectually shocked”? Gotta love his honesty. One of the pieces I penned in late 2008 was titled “So Bad It’s Good”. It just didn’t feel good, emotionally, at the time. But with fear in heart and conviction in process, I took action and while I was a bit early, it turned out to be an exceptionally good trade. Then, yields on high yield bonds were close to 20%. That’s what I believe may present again in the not too distant future. Until then, it’s a process of participation, protection and patience. At a recent conference, I was asked what I see as the biggest risks ahead. I answered that it is not subprime but everything that existed in 2008 from the perspective of debt levels, debt to GDP, margin balances and derivative exposure (and the related counter-party risks) is worse today than in 2008. Further, the Fed now finds itself painted into a corner with an inflated balanced sheet (QE asset purchases) and a zero interest rate policy. So, I spoke of three big risks on the near horizon that may impact the equity and high yield markets and added that I feel like I did when I wrote about crazy high valuations in 1998 (“It’s not different this time” though I was two years too early) and in 2007 and 2008 (writing about subprime and leveraged derivative products). All three risks have one common denominator – too much debt. Here are my big three: The Big Three
Sovereign Debt Crisis:
EM Debt Crisis:
High Yield Default Crisis:
Recession happen once or sometimes twice every decade. Watch the timing of recession and be prepared to take advantage the opportunity that will be created. What happens when the good times end? The 2008 crisis had severe, long-lasting consequences for the U.S. and European economies.
By early 2013, the U.S. stock market had recovered to its pre-crisis peak but housing prices remained near their low point and unemployment remained elevated. Economic growth has remained well below par. We are in a 2% growth world and not the 3.5% governments are hoping for. Europe continues to struggle with elevated unemployment and severe banking impairments estimated at €940 billion between 2008 and 2012. With a heavy hand to the banks, it was hey boys, we want you to buy all the AAA rated Greek, Italian, Spanish, French bonds you can buy. Now, the ECB (QE) is trying to bail out the banks. Those banks are in trouble. Too much debt. The problem is far from over. The big bubble today is in the bond market. Sovereign, EM and HY defaults. Keep a close eye on the recession probability models I share frequently in Trade Signals. Of course, whatever I think I see, there is far more I do not see. It would be arrogant of me to think otherwise. This is a game of
I think the jig is up when confidence in government is lost. Melt up? It could happen though I don’t have high conviction. Thus, I sit in the own equities but “hedged” camp. Valuations are just not attractive so I favor 30% instead of 60% but note that this is just a conceptual thought and not a recommendation as I don’t know your risk level nor risk tolerance. And add a handful of liquid alternative return streams to your portfolio for enhanced diversification. As a quick aside, if you haven’t had a chance to watch “How The Economic Machine Works” by Ray Dalio – click here. It’s awesome. Have your kids watch it too. I mentioned that the timing of a sovereign debt crisis in Europe, in my belief, is tied to a loss of confidence in government. So let’s go there next. George Friedman – The Resurrection of Old Europe The following excerpt is from the great geopolitical strategist, George Friedman. When I read the piece, I kept thinking about fractures and lost confidence in government. It is on my radar for reasons introduced above. I believe you’ll find Friedman to be a deep thinker.
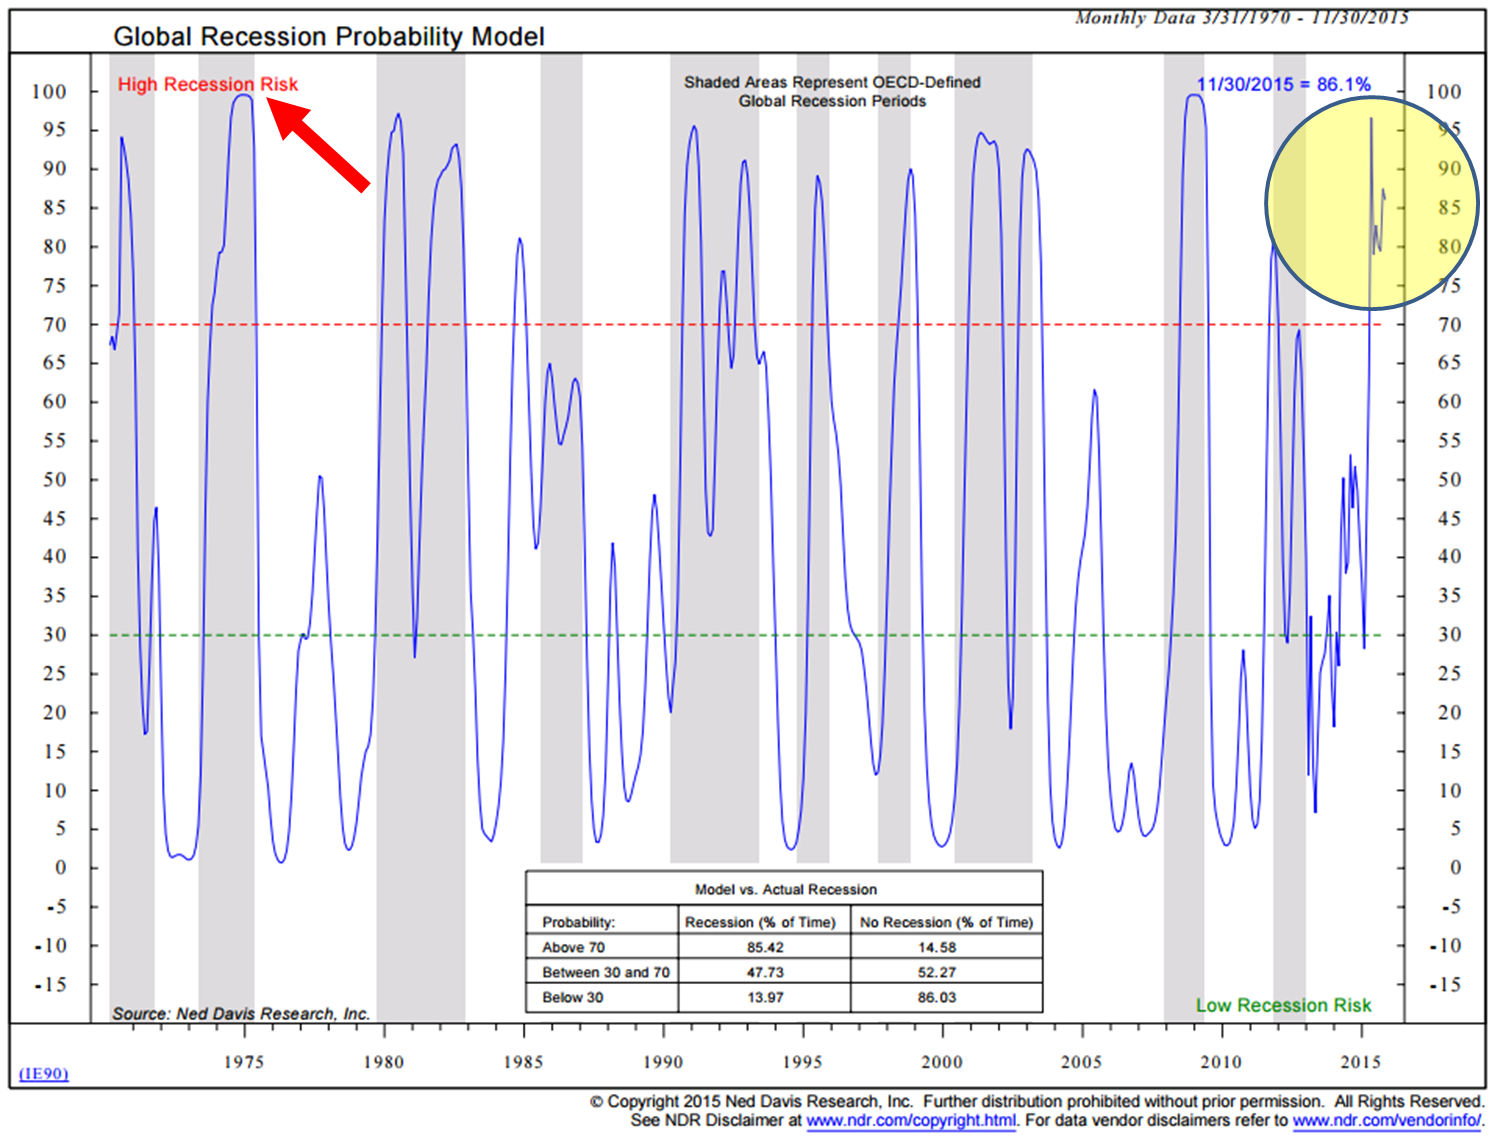
Global Recession Probability Model “Eventually, negative interest rates will kill growth.” – Charles Gave The following model looks at a composite of leading indicators for 35 countries. Indicators such as money supply, yield curve, building permits, consumer and business sentiment, share prices and manufacturing production. It then uses a logistic regression method incorporating the composite of leading indicators and trend data for all 35 countries. The objective is to predict the likelihood of a global recession. A score above 70 indicates a high recession risk and below 30 signals low recession risk. The box at the bottom center of the chart shows the “Model vs. Actual Recession.” Note that global recession has occurred 85.42% of the time when the model reading has been above 70%. It is at 86.1% today.
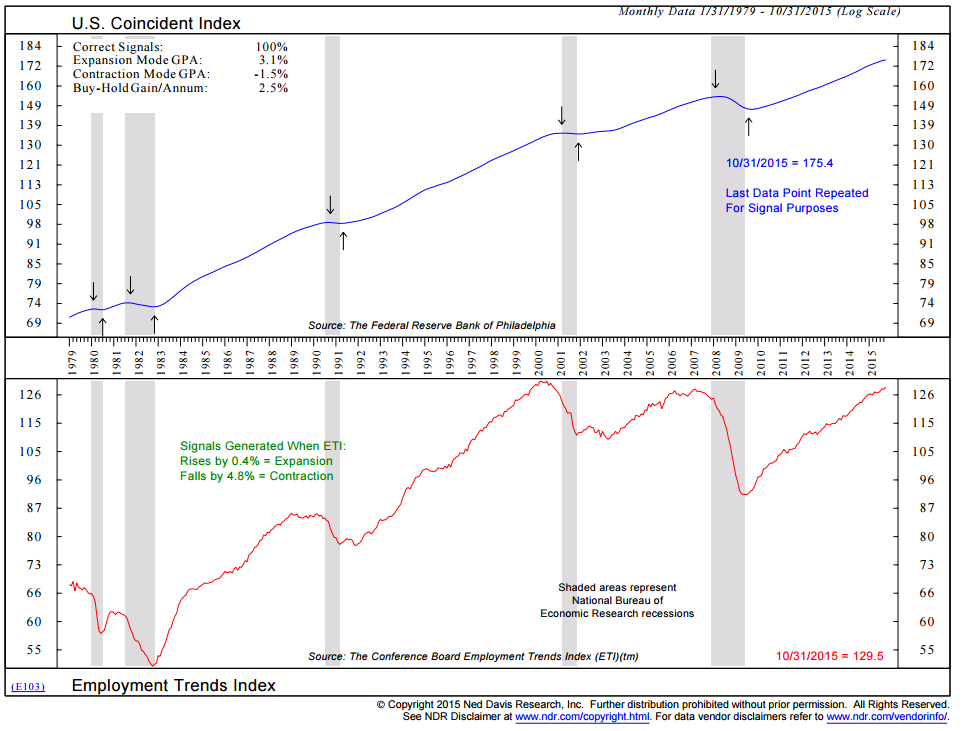
I find it hard to bet against the current odds of a global recession. I believe we are in one now. The U.S. is in better shape. Though let’s keep a close eye on the next two charts. Chart 1 shows Low Current U.S. Recession Risk:
Chart 2 shows Low Current U.S. Recession Risk:
Keep an eye out for down arrows in the top section of the above two charts. Send me a note if you find the charts confusing. I’ll be happy to walk you through them. A Few Equity Hedging Ideas Here is what you can do:
Let me know if you would like some targeted ideas. The point is that there are many good funds and ETF’s to consider. Trade Signals – Watch Out for Minus 2 (Don’t Fight the Tape or The Fed Indicator is in a Rare -2 Model Reading) – A Strong Sell Signal (Hedge!) The significant signal this week is the -2 reading on the Don’t Fight the Tape or the Fed model. The model looks at the technical health of the broad equity market (how are most stocks doing across the various sectors). When the majority begin to break down and just a few support the market (looking at trend and momentum of thousands of stocks), the technical health is not good. This indicator combined with a 10-year Treasury yield indicator creates a reading from +2 (bullish) to -2 (bearish). The last model reading of -2 was in 2012. As you’ll see below, the annual gain per annum when the reading was -2 was a -46.8% (an occurrence 5.9% of the time since 1998). Note that doesn’t mean a 46.8% decline is coming; it just means that the market has declined during past periods of -2. Thus the “watch out for -2” warning. Also interesting is the relatively high level of investor optimism. This is surprising after last week’s negative week for U.S. equities. This combined with a negative reading in the CMG NDR Large Cap Momentum Index and a collection of other unfavorable technical readings (below), suggests, to me at least, reduce and hedge equity exposure. The market remains richly priced. Risk is high. Included in this week’s Trade Signals: Equity Trade Signals:
Investor Sentiment Indicators:
Fixed Income Trade Signals:
Economic Indicators:
Click here for the link to the charts.
|
|||
| STRATEGIC INVESTMENT INSIGHTS - Weekend Coverage | |||
|
SII | ||
|
11-28-15 | SII | |
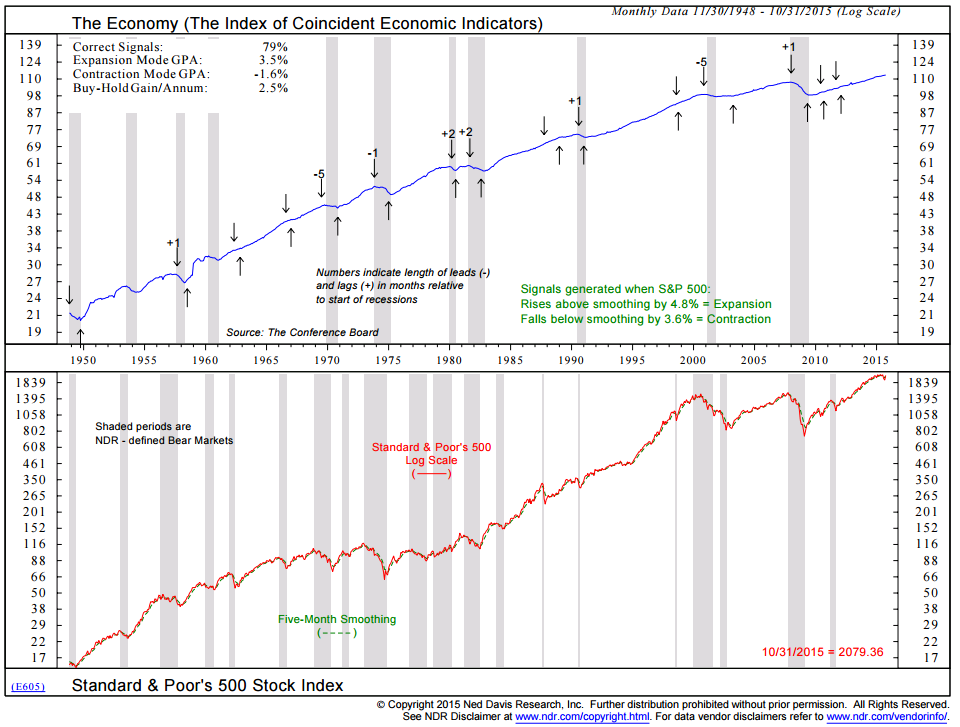
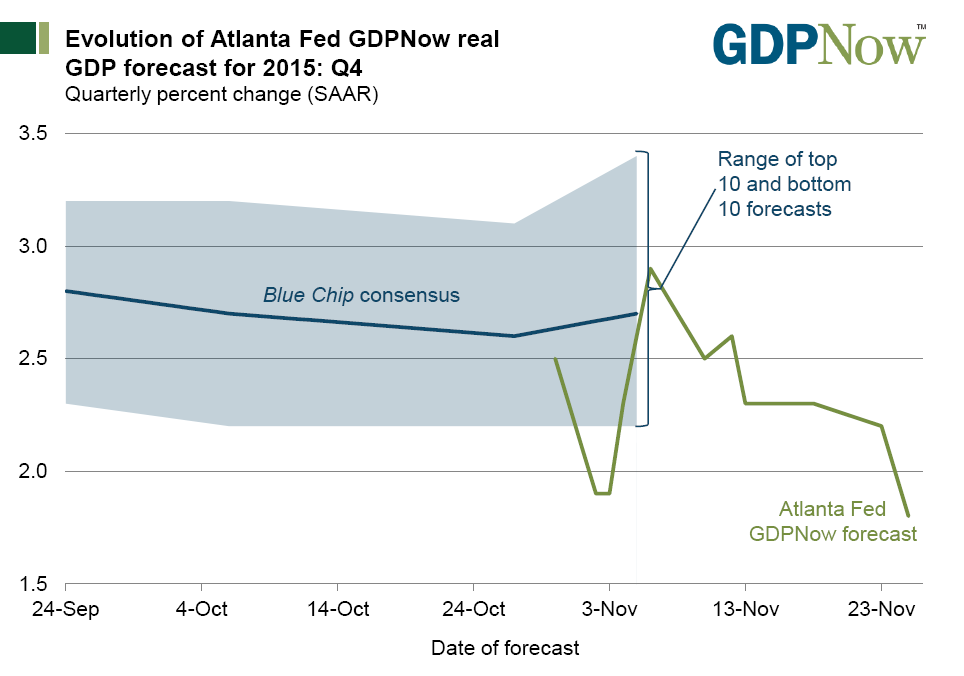
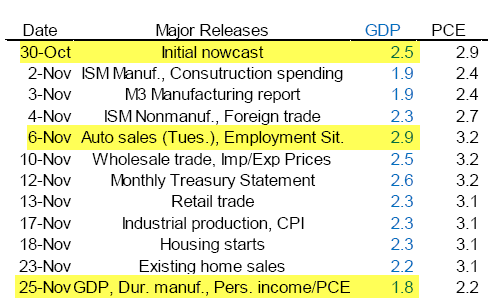
On the Verge of Consumer ExhaustionFourth Quarter GDPNow Forecast Sinks to 1.8%
The latest Blue-Chip forecast for early November was 2.7%, a highly unlikely number at this stage unless season spending picks up big time.
Consumer Exhaustion
Auto sales have been the one consistently bright spot, in this otherwise treading water economy, but what cannot go on forever, won't.
|
|||
|
SII | ||
|
SII | ||
|
SII | ||
| TO TOP | |||
Read More - OUR RESEARCH - Articles Below

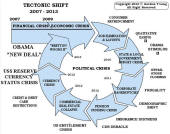
Tipping Points Life Cycle - Explained
Click on image to enlarge
TO TOP
 |
YOUR SOURCE FOR THE LATEST THINKING & RESEARCH
|
�
TO TOP