|
JOHN RUBINO'SLATEST BOOK |
||||||||||||||||||||||||||||||||||||||||||||||||||||||||||||||||||||||||||||||||||||||||||||||||||||||||||||||||||||||||||||||||||||||||||||||||||||||||||||||||||||||||||||||||||||||||||||||||||||||||||||||||||||||||||||||||||||||||||||||||||||||||||||||||||||||||||||||||||||||||||||||||||||||
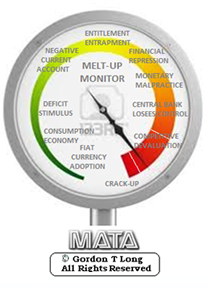
"MELT-UP MONITOR "
Meltup Monitor: FLOWS - The Currency Cartel Carry Cycle - 09 Dec 2013 Meltup Monitor: FLOWS - Liquidity, Credit & Debt - 04 Dec 2013 Meltup Monitor: Euro Pressure Going Critical - 28- Nov 2013 Meltup Monitor: A Regression-to-the-Exponential Mean Required - 25 Nov 2013
|

![]()
"DOW 20,000 "
Lance Roberts Charles Hugh Smith John Rubino Bert Dohman & Ty Andros
|

HELD OVER
Currency Wars
Euro Experiment
Sultans of Swap
Extend & Pretend
Preserve & Protect
Innovation
Showings Below
"Currency Wars "
|


"SULTANS OF SWAP" archives open ACT II ACT III
ALSO Sultans of Swap: Fearing the Gearing! Sultans of Swap: BP Potentially More Devistating than Lehman! |

"EURO EXPERIMENT"
archives open EURO EXPERIMENT : ECB's LTRO Won't Stop Collateral Contagion!
EURO EXPERIMENT: |

![]()
"INNOVATION"
archives open |

"PRESERVE & PROTE CT"
archives open |

Fri. Nov 6th, 2015
Follow Our Updates
onTWITTER
https://twitter.com/GordonTLong
AND FOR EVEN MORE TWITTER COVERAGE
ARCHIVES
| OCTOBER | ||||||
| S | M | T | W | T | F | S |
| 1 | 2 | 3 | ||||
| 4 | 5 | 6 | 7 | 8 | 9 | 10 |
| 11 | 12 | 13 | 14 | 15 | 16 | 17 |
| 18 | 19 | 20 | 21 | 22 | 23 | 24 |
| 25 | 26 | 27 | 28 | 29 | 30 | 31 |
| 1 | 2 | 3 | 4 | 5 | 6 | 7 |
KEY TO TIPPING POINTS |
| 1- Bond Bubble |
| 2 - Risk Reversal |
| 3 - Geo-Political Event |
| 4 - China Hard Landing |
| 5 - Japan Debt Deflation Spiral |
| 6- EU Banking Crisis |
| 7- Sovereign Debt Crisis |
| 8 - Shrinking Revenue Growth Rate |
| 9 - Chronic Unemployment |
| 10 - US Stock Market Valuations |
| 11 - Global Governance Failure |
| 12 - Chronic Global Fiscal ImBalances |
| 13 - Growing Social Unrest |
| 14 - Residential Real Estate - Phase II |
| 15 - Commercial Real Estate |
| 16 - Credit Contraction II |
| 17- State & Local Government |
| 18 - Slowing Retail & Consumer Sales |
| 19 - US Reserve Currency |
| 20 - US Dollar Weakness |
| 21 - Financial Crisis Programs Expiration |
| 22 - US Banking Crisis II |
| 23 - China - Japan Regional Conflict |
| 24 - Corruption |
| 25 - Public Sentiment & Confidence |
| 26 - Food Price Pressures |
| 27 - Global Output Gap |
| 28 - Pension - Entitlement Crisis |
| 29 - Central & Eastern Europe |
| 30 - Terrorist Event |
| 31 - Pandemic / Epidemic |
| 32 - Rising Inflation Pressures & Interest Pressures |
| 33 - Resource Shortage |
| 34 - Cyber Attack or Complexity Failure |
| 35 - Corporate Bankruptcies |
| 36 - Iran Nuclear Threat |
| 37- Finance & Insurance Balance Sheet Write-Offs |
| 38- Government Backstop Insurance |
| 39 - Oil Price Pressures |
| 40 - Natural Physical Disaster |
Reading the right books?
No Time?
We have analyzed & included
these in our latest research papers Macro videos!
OUR MACRO ANALYTIC
CO-HOSTS
John Rubino's Just Released Book
Charles Hugh Smith's Latest Books


Our Macro Watch Partner
Richard Duncan Latest Books
MACRO ANALYTIC
GUESTS
F William Engdahl


OTHERS OF NOTE
Book Review- Five Thumbs Up
for Steve Greenhut's Plunder!


![]()
TODAY'S TIPPING POINTS
|
Have your own site? Offer free content to your visitors with TRIGGER$ Public Edition!
Sell TRIGGER$ from your site and grow a monthly recurring income!
Contact [email protected] for more information - (free ad space for participating affiliates).
HOTTEST TIPPING POINTS |
Theme Groupings |
||
We post throughout the day as we do our Investment Research for: LONGWave - UnderTheLens - Macro
|
|||
|
MOST CRITICAL TIPPING POINT ARTICLES TODAY
|
|
||
|
|||
FLOWS - Liquidity, Credit & Debt |
11-06-15 | FLOWS |
|
Submitted by Tyler Durden on 10/03/2015
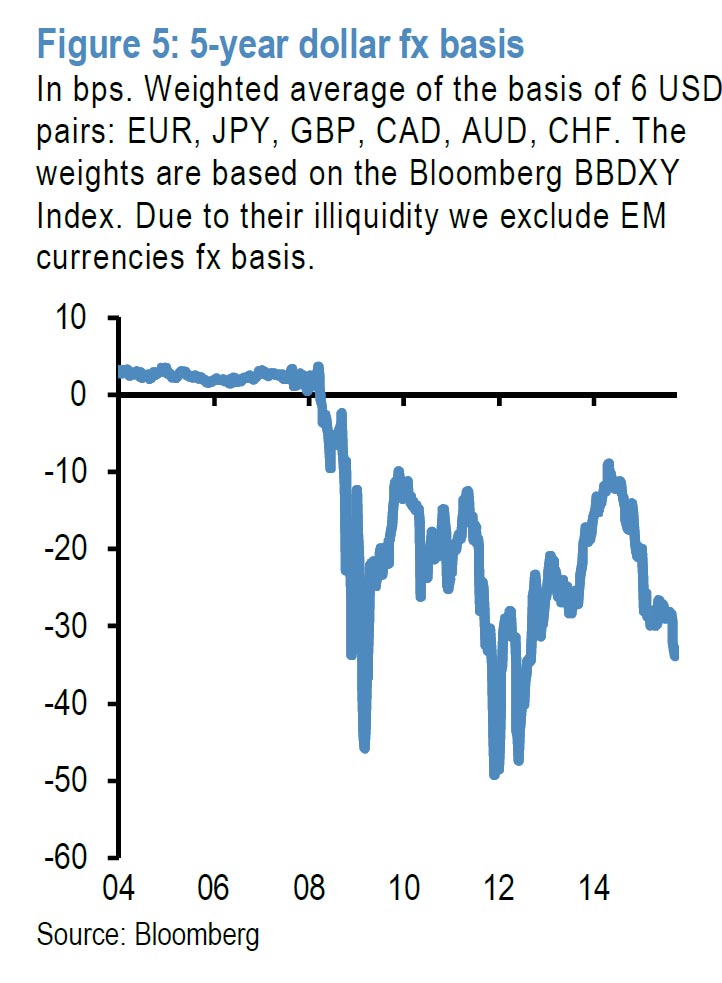
Global Dollar Funding Shortage Intensifies To Worst Level Since 2012The last time we observed one of our long-standing favorite topics (first discussed in early 2009), namely the global USD-shortage which manifests itself in times of stress when the USD surges against all foreign currencies and forces even the BIS and IMF to notice, was in March of this year, when we explained that "unlike the last time, when the global USD funding shortage was entirely the doing of commercial banks, this time it is the central banks' own actions that have led to this global currency funding mismatch - a mismatch that unlike 2008, and 2011, can not be simply resolved by further central bank intervention which happen to be precisely the reason for the mismatch in the first place." Furthermore JPM conveniently noted that "given the absence of a banking crisis currently, what is causing negative basis? The answer is monetary policy divergence. The ECB’s and BoJ’s QE coupled with a chorus of rate cuts across DM and EM central banks has created an imbalance between supply and demand across funding markets. Funding conditions have become a lot easier outside the US with QE-driven liquidity injections and rate cuts raising the supply of euro and other currency funding vs. dollar funding. This divergence manifested itself as one-sided order flow in cross currency swap markets causing a decline in the basis." To which we rhetorically added: "who would have ever thought that a stingy Fed could be sowing the seeds of the next financial crisis (don't answer that rhetorical question)." All this was happening when the market was relentlessly soaring to all time highs, completely oblivious of this dramatic dollar shortage, which just a few months later would manifest itself quite violently first in the Chinese devaluation and sale of Treasurys, and then in the unprecedented capital outflow from emerging markets as the great petrodollar trade - just as we warned in November of 2014 - went into reverse. In fact, there are very few now who do not admit the Fed is responsible for both the current cycle of soaring volatility, or what may be a market crash (as DB just warned) should the Fed not take measures to stimulate "inflation expectations" (read: more easing). In any event, since March we have received numerous requests for follow-up of where said funding shortage is now. So here are the latest observations on the current level of the global dollar funding shortage as measured by the Dollar fx basis, courtesy of JPM:
In other words: the USD funding shortage is even worse than it was when we looked at it in March, it still is a function of conflicting central bank liquidity flows, and while not as bad as it was at its all time worst levels in late 2011, it is slowly but surely getting there with every passing week that the Fed does not ease monetary conditions. A brief history of the three key periods of global USD-funding shortfalls:
More from JPM:
This is how it looks now:
The conclusion:
What does this mean in simple terms? Think back to what David Tepper said several weeks ago on CNBC when, contrary to popular opinion, he admitted he was bearish on risk assets mostly as a result of the "reserve streams" going in two different ways. This is precisely what the dollar shortage as quantified by the negative dollar basis is telling us: the policy divergence between the "tight" Fed and the ultra loose ECB and BOJ is starting to reach extreme levels, and will likely continue until the basis blows out to its theoretical limit of -50bps as set by the Fed-ECB swap line. At that point either the Fed will be forced to admit it was beaten by the market, and either cut rates (to negative) while perhaps unleashing even more QE to offset the monetary imbalance with the rest of the world, or it will once again engage in even more swap lines with foreign central banks as the dollar funding shortage moves beyond simply synthetic and into an actual shortage of USD "bills" all in electronic credit format of course, because as we further explained last week, it is simply impossible to satisfy all global USD-denominated claims.
|
|||
| MOST CRITICAL TIPPING POINT ARTICLES THIS WEEK - Nov. 1st, 2015 - Nov 7th, 2015 | |||
| BOND BUBBLE | 1 | ||
| RISK REVERSAL - WOULD BE MARKED BY: Slowing Momentum, Weakening Earnings, Falling Estimates | 2 | ||
| RISK REVERSAL - WOULD BE MARKED BY: Slowing Momentum, Weakening Earnings, Falling Estimates | 10-29-15 | GLOBAL RISK SIGNALS | 2 |
| GEO-POLITICAL EVENT | 3 | ||
| CHINA BUBBLE | 4 | ||
| CHINA BUBBLE | 4 | ||
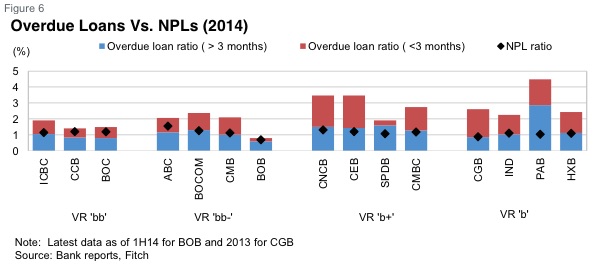
One Analyst Says China's Banking Sector Is Sitting On A $3 Trillion Neutron BombTue, 03 Nov 2015To be sure, we’ve long contended that official data on bad loans at Chinese banks is even less reliable than NBS GDP prints. Indeed, the lengths Beijing goes to in order to obscure the extent to which banks’ balance sheets are in peril is truly something to behold and much like the deficient deflator math which may be causing the country to habitually overstate GDP growth, it’s not even clear that China could report the real numbers if it wanted to. We took an in-depth look at the problem in “How China's Banks Hide Trillions In Credit Risk: Full Frontal”, and we’ve revisited the issue on a number of occasions noting in August that according to a transcript of an internal meeting of the China Banking Regulatory Commission, bad loans jumped CNY322.2 billion in H1 to CNY1.8 trillion, a 36% increase. Of course that’s just the tip of the iceberg. In other words, that comes from a government agency and although the scope of the increase sounds serious, it still translates into an NPL ratio of just 1.82%. Here’s a look at the “official” numbers (note that when one includes doubtful accounts, the ratio jumps to somewhere in the neighborhood of 3-4%):
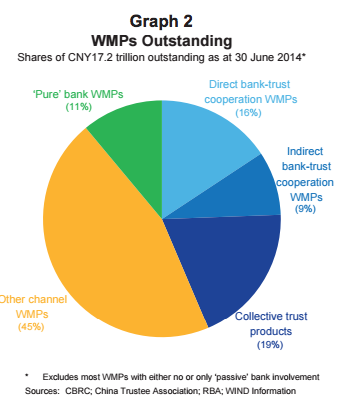
Source: Fitch There are any number of reasons why those figures don’t even come close to approximating reality. For instance, there’s Beijing’s habit of compelling banks to roll over bad loans, and then there’s China’s massive (and by “massive” we mean CNY17 trillion) wealth management product industry which, when coupled with some creative accounting, allows Chinese banks to hold some 40% of credit risk off balance sheet.
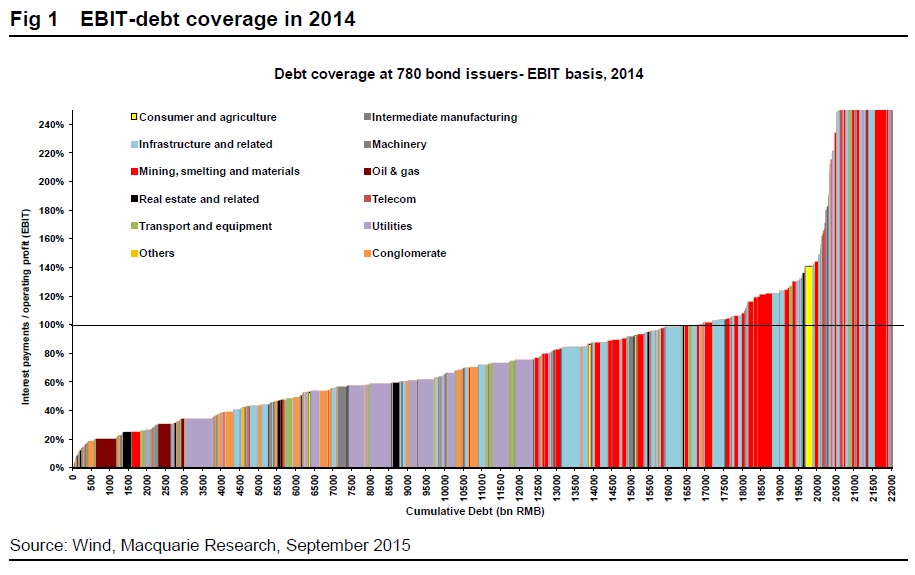
Well as time goes on, and as market participants scrutinize the data coming out of the world’s second most important economy, quite a few analysts are beginning to take a closer look at the NPL data for Chinese banks. Indeed, if Beijing continues to move toward “allowing” defaults to occur (even at SOEs) and if China’s transition from smokestack economy to a consumption and services-driven model continues to put pressure on borrowers from the manufacturing sector, the situation is likely to deteriorate quickly. If you needed evidence of just how precarious things truly are, look no further than a recent report from Macquarie which showed that a quarter of Chinese firms with debt are currently unable to cover their annual interest expense (as you might imagine, it's even worse for commodities firms).
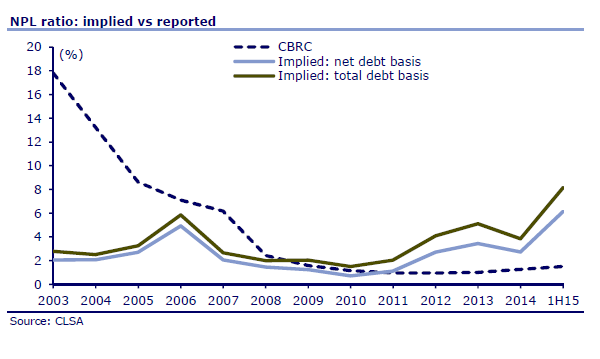
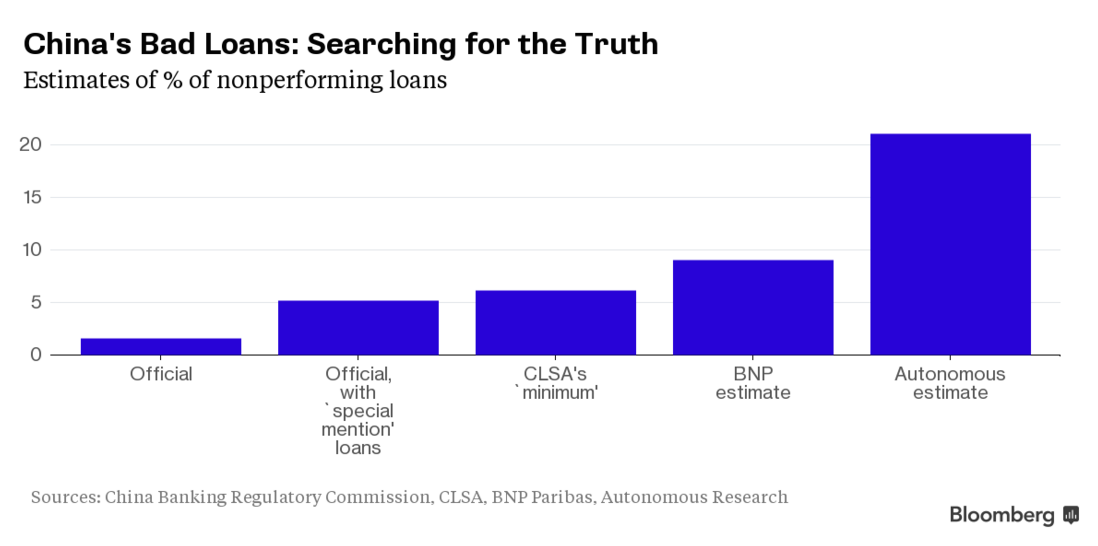
Just two weeks after we highighted the Macquarie report, we took a look at research conducted by Hong-Kong based CLSA. Unsurprisingly, it turns out that Chinese banks' bad debts ratio could be as high 8.1%, a whopping 6 times higher than the official 1.5% NPL level reported by China's banking regulator.
We called that revelation China's "neutron bomb" but it turns out we may have jumped the gun. According to Hong Kong-based "Autonomous Research", the real figure may be closer to 21% when one takes into account the aforementioned shadow banking sector. Here's more from Bloomberg:
As a reminder, here's a look at the scope of the "problem" Chu is describing:
And here's a bit more on special mention loans and the ubiquitous practice of "evergreening":
So let's just be clear: if 8% is a "neutron bomb", a 21% NPL ratio in China is the asteroid that killed the dinosaurs. Here's why:
If one very conservatively assumes that loans are about half of the total asset base (realistically 60-70%), and applies an 20% NPL to this number instead of the official 1.5% NPL estimate, the capital shortfall is a staggering $3 trillion. That, as we suggested three weeks ago, may help to explain why round after round of liquidity injections (via RRR cuts, LTROs, and various short- and medium-term financing ops) haven't done much to boost the credit impulse. In short, banks may be quietly soaking up the funds not to lend them out, but to plug a giant, $3 trillion, solvency shortfall. In the end, we would actually venture to suggest that the real figure is probably far higher than 20%. There's no way to get a read on how the country's vast shadow banking complex plays into this but when you look at the numbers, it's almost inconceivable to imagine that banks aren't staring down sour loans at least on the order of a couple of trillion. To the PBoC we say, "good luck plugging that gap" and to the rest of the world we say "beware, the engine of global growth and trade may be facing a pile of bad loans the size of Germany's GDP." We close with the following from Kroll's senior managing director in Hong Kong Violet Ho (quoted above):
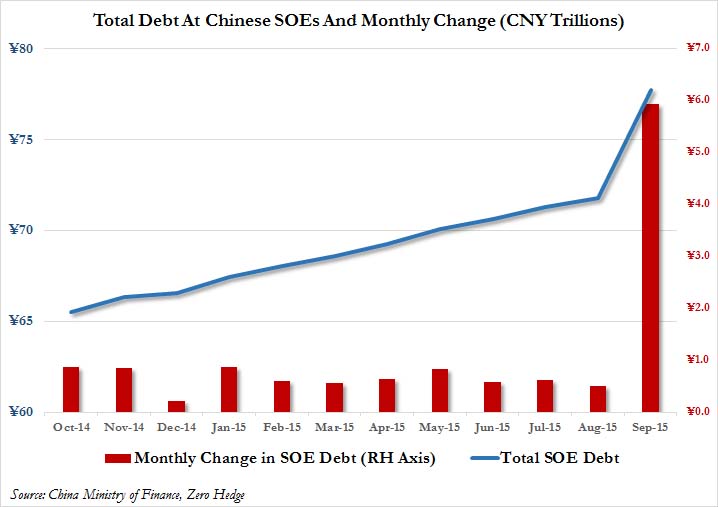
Did Something Just Snap In China: Total SOE Debt Rises By $1 Trillion In One MonthTue, 03 Nov 2015We found something unexpected when skimming through the website of China's finance ministry. While most China pundits keep close track of China's monthly loan creation and, especially these days, its Total Social Financing number to get a sense of what, if any, credit is being created outside of conventional lending channels within China's shadow banking system, one just as critical please to keep track of Chinese credit is the monthly report on national state-owned and state holding enterprises. Such as this one from October 22, which reports that as of September 30, total liabilities of state-owned enterprises had risen to 77.7 trillion yuan. Why is this notable? Because the monthly update just preceding it,reported a total debt figure of "only" 71.8 trillion yuan: a whopping increase of almost CNY 6 trillion, or USD $1 trillion, in just one month. This is the biggest monthly increase by a massive margin among China's SOE by orders of magnitude, and yet just to get a sense of the magnitude of debt held at China's SOEs, even this record monthly increase is not even 10% of the total debt held by China's state-owned enterprises which stood at CNY78 trillion or USD $12 trillion at the end of September, more than the total Chinese GDP.
What can explain this snap? There has been very little commentary on this particular surge aside from a report posted on Wall Street.cn, and translated by Chiecon, which reports the following:
Ironically, "shifting" the debt - no matter how troubling - would be by far the more palatable explanation. Because if somehow China had quietly "created" $1 trillion in debt out of thin air parked subsequently on SOE balance sheets, that would suggest that things in China are orders of magnitude worse than anyone can possibly imagine. Still, if China did not create this debt now, it will eventually:
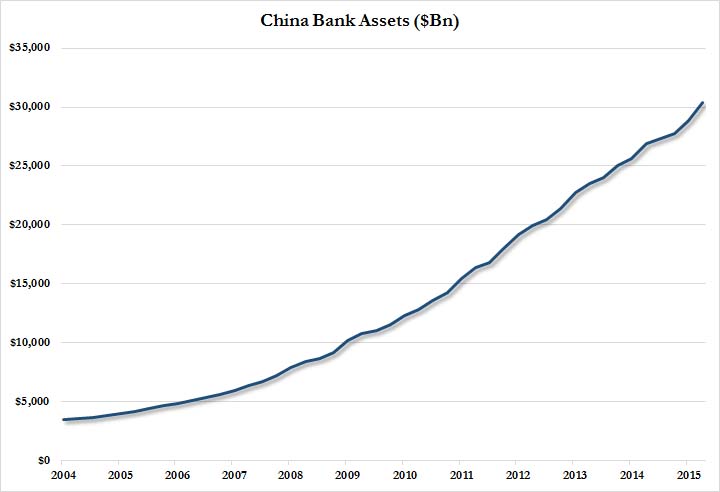
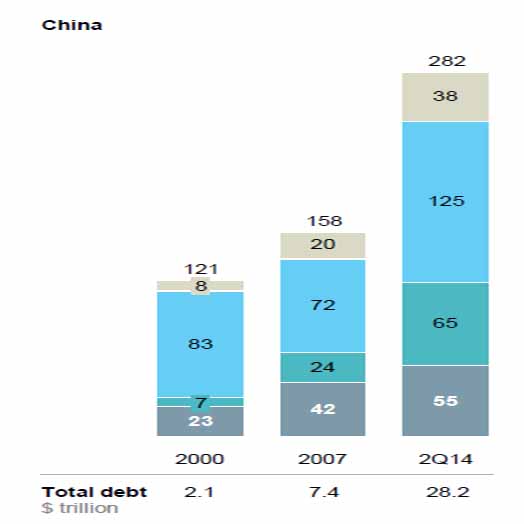
It's low? Really? Because according to the following McKinsey chart total Chinese debt was $28.2 trillion as of Q2 2014 (it has since risen well over $30 trillion), and represents nearly 300% debt/GDP.
But there is another implication. If China's is indeed merely stuffing government debt on SOE balance sheets as the report suggests...
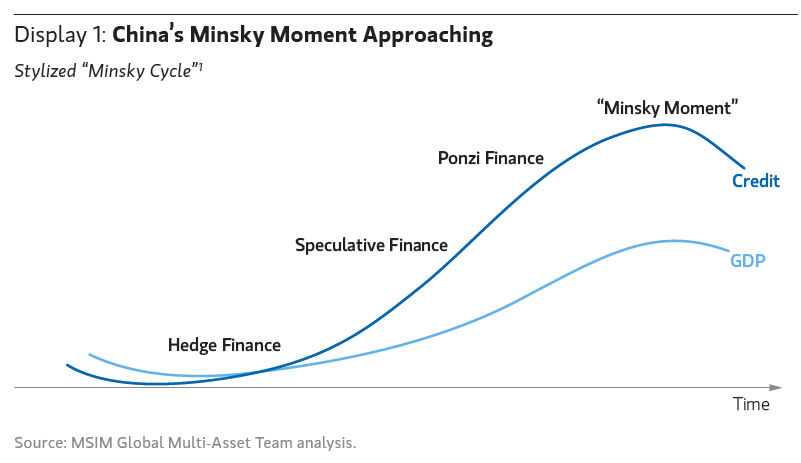
... then China, while ultimately having to engage in QE, will last out the current regime as long as possible, offloading government debt in ever greater amounts to SOE until finally their debt capacity is maxed out. Then, and only then, will China unleash the world's last remaining debt monetization episode, whereby the PBOC will proceed to openly monetize the roughly $3-4 trillion in total debt China creates every year. At that point the "Minsky Moment" of not only China, but the entire world, will have arrived.
|
|||
| JAPAN - DEBT DEFLATION | 5 | ||
EU BANKING CRISIS |
6 |
||
GLOBAL GROWTH - Shrinking Revenue Growth Rate |
8 - Shrinking Revenue Growth Rate |
||
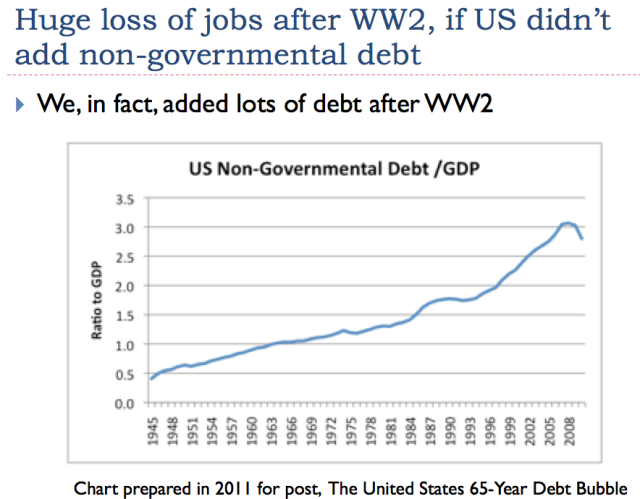
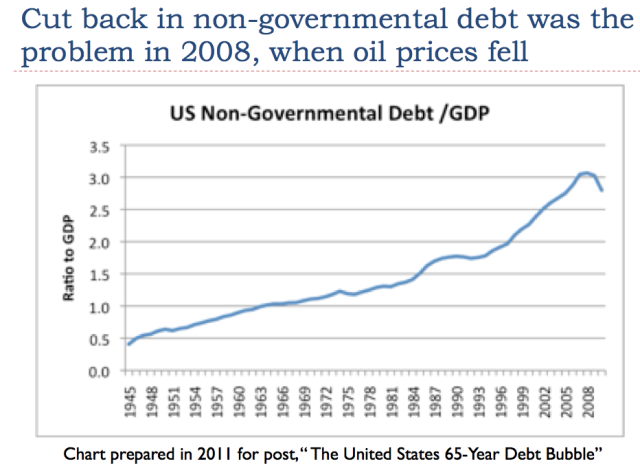
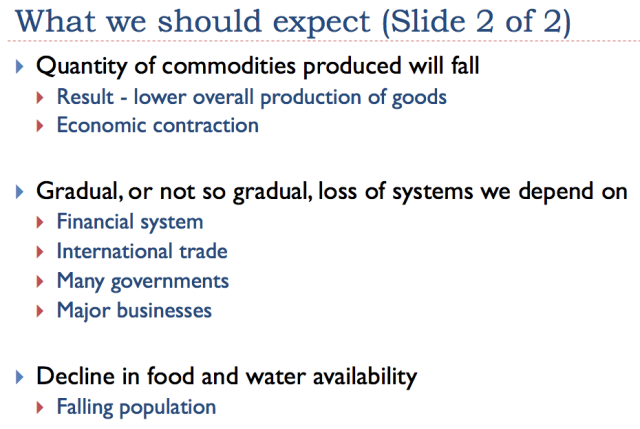
Submitted on 11/04/2015 Submitted by Gail Tverberg via Our Finite World blog, How The Global Debt Bubble Is Crushing Commodity PricesSubmitted by Gail Tverberg via Our Finite World blog, Why is the price of oil so low now? In fact, why are all commodity prices so low? I see the problem as being an affordability issue that has been hidden by a growing debt bubble. As this debt bubble has expanded, it has kept the sales prices of commodities up with the cost of extraction (Figure 1), even though wages have not been rising as fast as commodity prices since about the year 2000. Now many countries are cutting back on the rate of debt growth because debt/GDP ratios are becoming unreasonably high, and because the productivity of additional debt is falling. If wages are stagnating, and debt is not growing very rapidly, the price of commodities tends to fall back to what is affordable by consumers. This is the problem we are experiencing now (Figure 1). 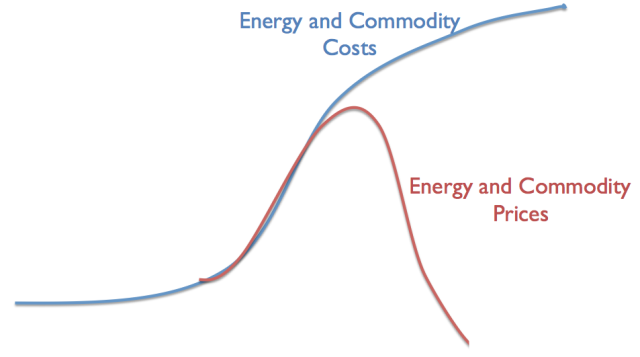 Figure 1. Author’s illustration of problem we are now encountering I will explain the situation more fully in the form of a presentation. It can be downloaded in PDF form: Oops! The world economy depends on an energy-related debt bubble. * * * Let’s start with the first slide, after the title slide. 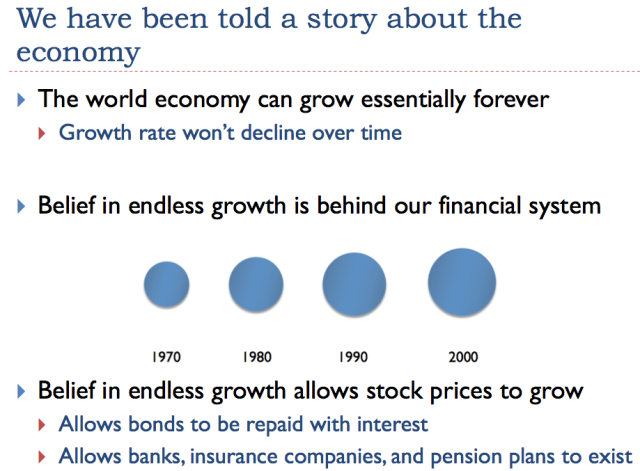 Slide 2 Growth is incredibly important to the economy (Slide 2). If the economy is growing, we keep needing to build more buildings, vehicles, and roads, leading to more jobs. Existing businesses find demand for their products rising. Because of this rising demand, profits of many businesses can be expected to rise over time, thanks to economies of scale. Something that is not as obvious is that a growing economy enables much greater use of debt than would otherwise be the case. When an economy is growing, as illustrated by the ever-increasing sizes of circles, it is possible to “borrow from the future.” This act of borrowing gives consumers the ability to buy more things now than they would otherwise would be able to afford–more “demand” in the language of economists. Customers can thus afford cars and homes, and businesses can afford factories. Companies issuing stock can expect that price of shares will most likely rise in the future. Without economic growth, it would be very hard to have the financial system that we have today, with its stable banks, insurance companies, and pension plans. The pattern of economic growth makes interest and dividend payments easier to make, and reduces the likelihood of debt default. It allows financial planners to set up savings plans for retirement, and gives people confidence that the system will “be there” when it is needed. Without economic growth, debt is more of a last resort–something that might land a person in debtors’ prison if things go wrong. 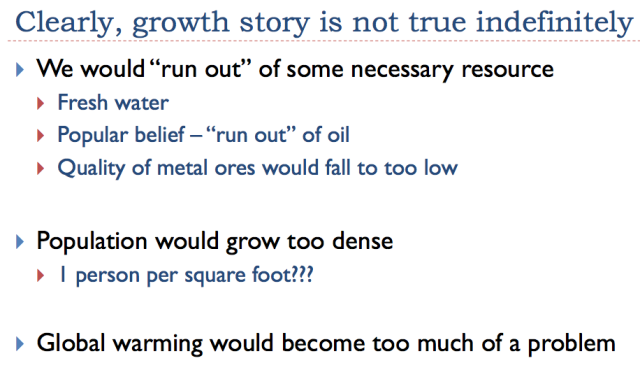 Slide 3 It should be obvious that the economic growth story cannot be true indefinitely. We would run short of resources, and population would grow too dense. Pollution, including CO2 pollution, would become an increasing problem. 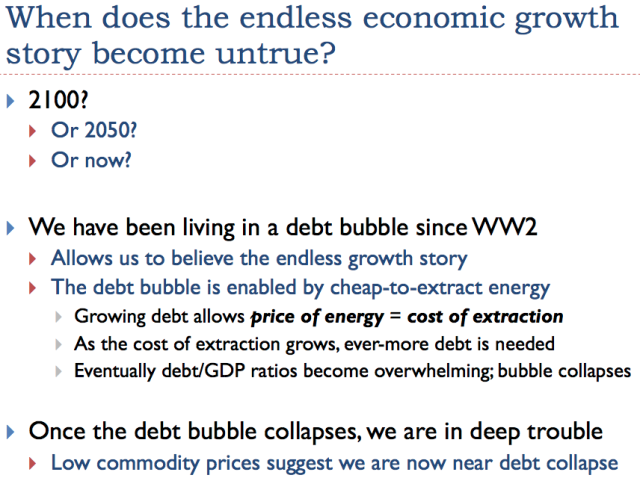 Slide 4 The question without an obvious answer is “When does the endless economic growth story become untrue?” If we listen to the television, the answer would seem to be somewhere in the distant future, if a slowdown in economic growth happens at all. Most of us who read financial newspapers are aware that more debt and lower interest rates are the types of stimulus provided to the economy, to try to help it grow faster. Our current “run up” in debt seems to have started about the time of World War II. This growing debt allows “demand” for goods like houses, cars, and factories to be higher. Because of this higher demand, commodity prices can be higher than they otherwise would be. Thus, if debt is growing quickly enough, it allows the sales price of energy products and other commodities to stay as high as their cost of extraction. The problem is that debt/GDP ratios can’t rise endlessly. Once debt/GDP ratios stop rising quickly enough, commodity prices are likely to fall. In fact, the run-up in debt is a bubble, which is itself in danger of collapsing, because of too many debt defaults. 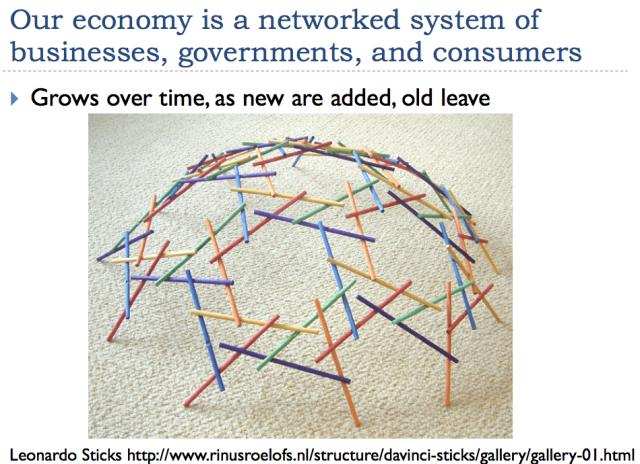 Slide 5 The economy is made up of many parts, including businesses and consumers. The consumers have a second role as well–many of them are workers, and thus get their wages from the system. Governments have many roles, including providing financial systems, building roads, and providing laws and regulations. The economy gradually grows and changes over time, as new businesses are added, and others leave, and as laws change. Consumers make their decisions based on available products in the marketplace and they amount they have to spend. Thus, the economy is a self-organized networked system–see my post Why Standard Economic Models Don’t Work–Our Economy is a Network. One key feature of a self-organized networked system is that it tends to grow over time, as more energy becomes available. As its grows, it changes in ways that make it difficult to shrink back. For example, once cars became the predominant method of transportation, cities changed in ways that made it difficult to go back to using horses for transportation. There are now not enough horses available for this purpose, and there are no facilities for “parking” horses in cities when they are not needed. And, of course, we don’t have services in place for cleaning up the messes that horses leave. 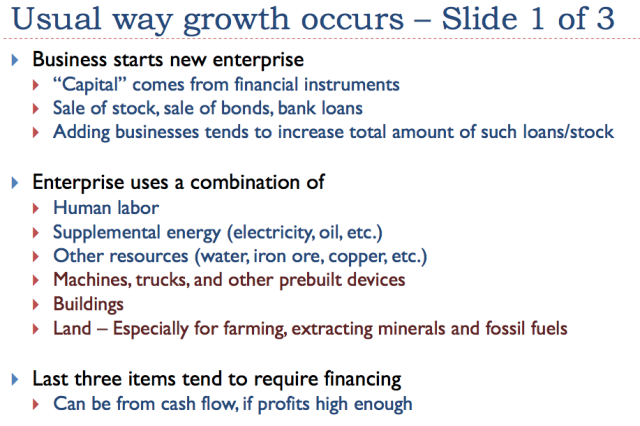 Slide 6 When businesses start, they need capital. Very often they sell shares of stock, and they may get loans from banks. As companies grow and expand, they typically need to buy more land, buildings and equipment. Very often loans are used for this purpose. As the economy grows, the amount of loans outstanding and the number of shares of stock outstanding tends to grow. 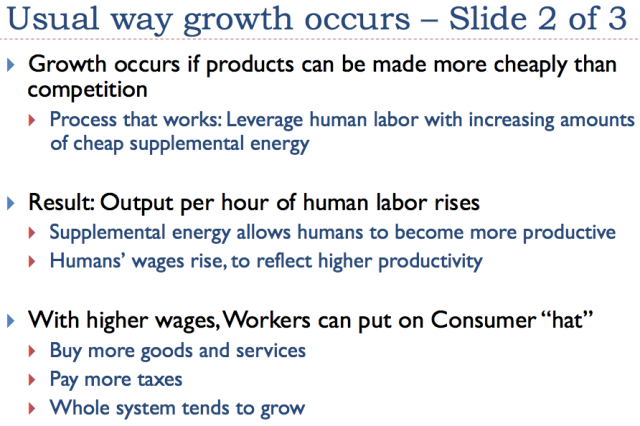 Slide 7 Businesses compete by trying to make goods and services more efficiently than the competition. Human labor tends to be expensive. For example, a sweater knit by hand by someone earning $10 per hour will be very expensive; a sweater knit on a machine will be much less expensive. If a company can add machines to leverage human labor, the workers using those machines become more productive. Wages rise, to reflect the greater productivity of workers, using the machines. We often think of the technology behind the machines as being important, but technology is only part of the story. Machines reflecting the latest in technology are made using energy products (such as coal, diesel and electricity) and operated using energy products. Without the availability of affordable energy products, ideas for inventions would remain just that–simply ideas. The other thing that is needed to make technology widely available is some form of financing–debt or equity financing. So a three-way partnership is needed for economic growth: (1) ideas for inventions, (2) inexpensive energy products and other resources to make them happen, and (3) some sort of financing (debt/equity) for the undertaking. Workers play two roles in the economy; besides making products and services, they are also consumers. If their wages are rising fast enough, thanks to growing efficiency feeding back as higher wages, they can buy increasing amounts of goods and services. The whole system tends to grow. I think of this as the normal “growth pump” in the economy. If the “worker” growth pump isn’t working well enough, it can be supplemented for a time by a “more debt” growth pump. This is why debt-based stimulus tends to work, at least for a while. 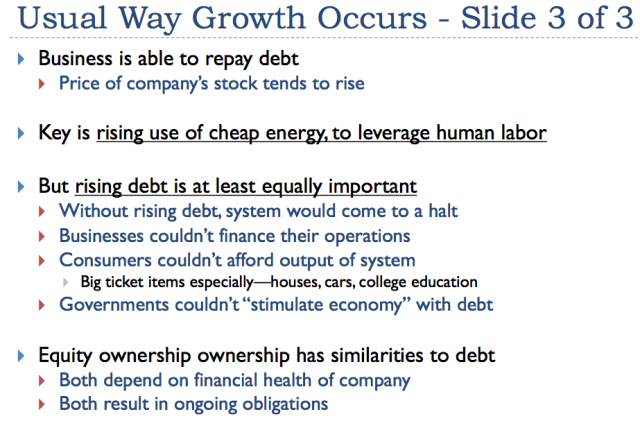 Slide 8 There are really two keys to economic growth–besides technology, which many people assume is primary. One key is the rising availability of cheap energy. When cheap energy is available, businesses find it affordable to add machines and equipment such as trucks to allow workers to be more productive, and thus start the economic growth cycle. The other key is availability of debt, to finance the operation. Businesses use debt, in combination with equity financing, to add new plants and equipment. Customers find long-term debt helpful in financing big-ticket items such as homes and cars. Governments use debt for many purposes, including “stimulating the economy”–trying to get economic growth to speed up. 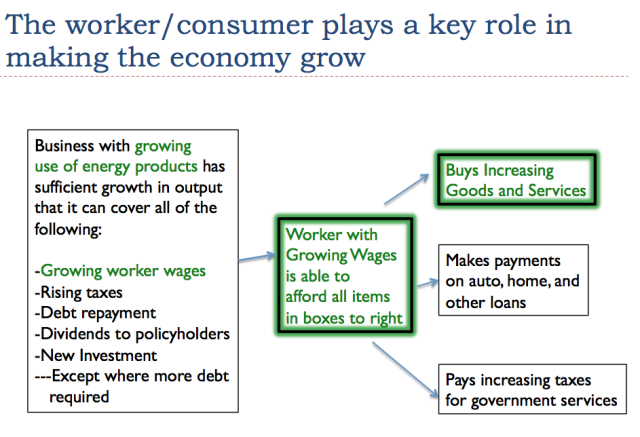 Slide 9 Slide 9 illustrates how workers play a key role in the economy. If businesses can create jobs with rising wages for workers, these workers can in turn use these rising wages to buy an increasing quantity of goods and services. It is the ability of workers to afford goods like homes, cars, motorcycles, and boats that helps the economy to grow. It also helps to keep the price of commodities up, because making these goods uses commodities like iron, steel, copper, oil, and coal. 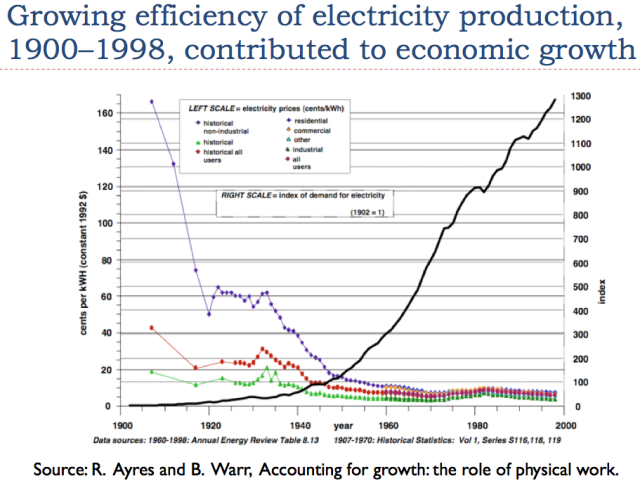 Slide 10 In the 1900 to 1998 period, the price of electricity production fell (shown by the falling purple, red, and green lines) as the production of electricity became more efficient. At the same time, the economy used an increasing quantity of electricity (shown by the rising black line). The reason that electricity use could grow was because electricity became more affordable. This allowed businesses to use more of it to leverage human labor. Consumers could use more electricity as well, so that they could finish tasks at home more quickly, such as washing clothes, leaving more time to work outside the home. 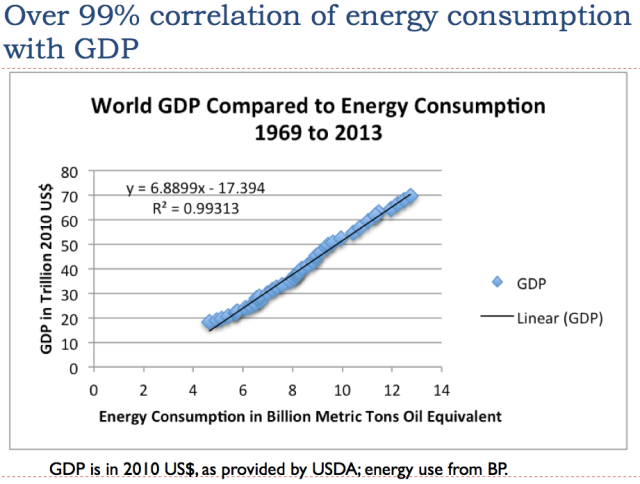 Slide 11 If we compare (1) the amount of energy consumed worldwide (all types added together) with (2) the world GDP in inflation-adjusted dollars, we find a very high correlation. 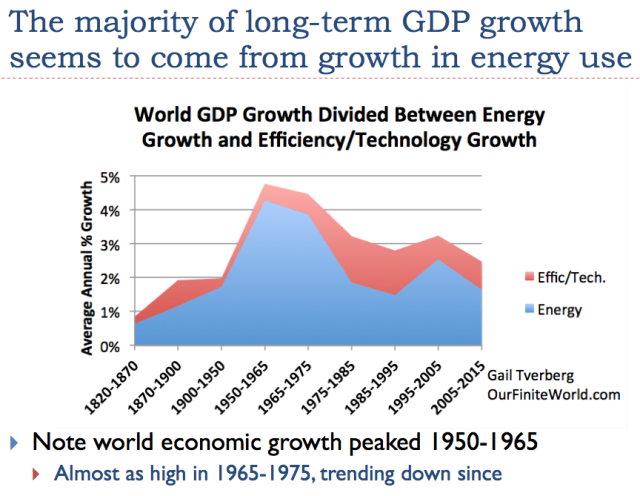 Slide 12 In Slide 12, GDP (represented by the top line on the chart–the sum of the red and the blue areas) was growing very slowly back in the 1820 to 1870 period, at less than 1% per year. This growth rate increased to a little under 2% a year in the 1870 to 1900 and 1900 to 1950 periods. The big spurt in growth of nearly 5% per year came in the 1950 to 1965 period. After that, the GDP growth rate has gradually slowed. On Slide 12, the blue area represents the growth rate in energy products. We can calculate this, based on the amount of energy products used. Growth in energy usage (blue) tends to be close to the total GDP growth rate (sum of red and blue), suggesting that most economic growth comes from increased energy use. The red area, which corresponds to “efficiency/technology,” is calculated by subtraction. The period of time when the efficiency/technology portion was greatest was between 1975 and 1995. This was the period when we were making major changes in the automobile fleet to make cars more fuel efficient, and we were converting home heating to more fuel-efficient heating, not using oil. 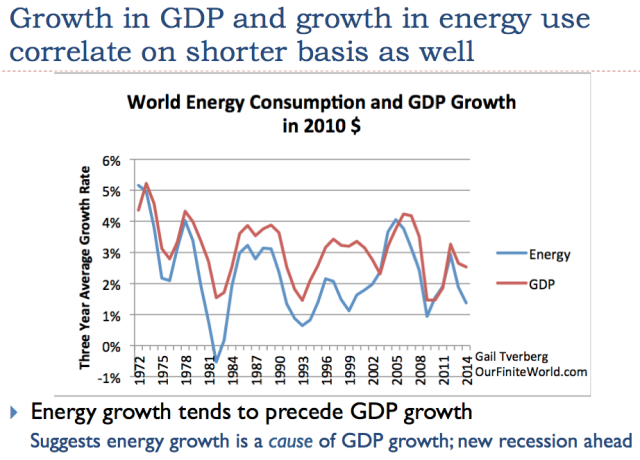 Slide 13 If we look at economic growth rates and the growth in energy use over shorter periods, we see a similar pattern. The growth in GDP is a little higher than the growth in energy consumption, similar to the pattern we saw on Slide 12. If we look carefully at Slide 13, we see that changes in the growth rate for energy (blue line) tends to happen first and is followed by changes in the GDP growth rate (red line). This pattern of energy changes occurring first suggests that growth in the use of energy is a cause of economic growth. It also suggests that lack of growth in the use of energy is a reason for world recessions. Recently, the rate of growth in the world’s consumption of energy has dropped (Slide 13), suggesting that the world economy is heading into a new recession. 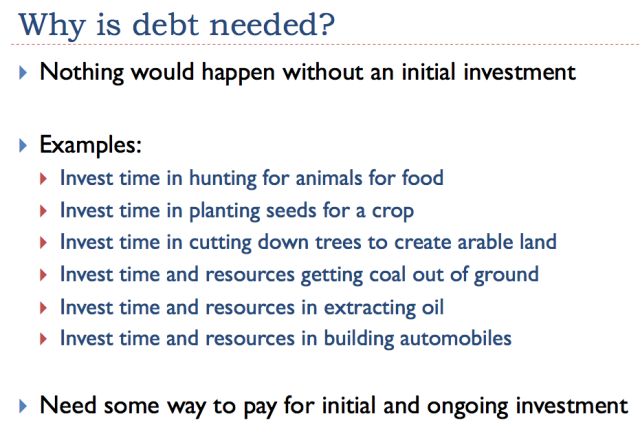 Slide 14 There is nearly always an investment of time and resources, in order to make something happen–anything from the growing of food to the mining of coal. Very often, it takes more than one person to undertake the initial steps; there needs to be a way to pay the other investors. Another issue is the guarantee of payment for resources gathered from a distance. 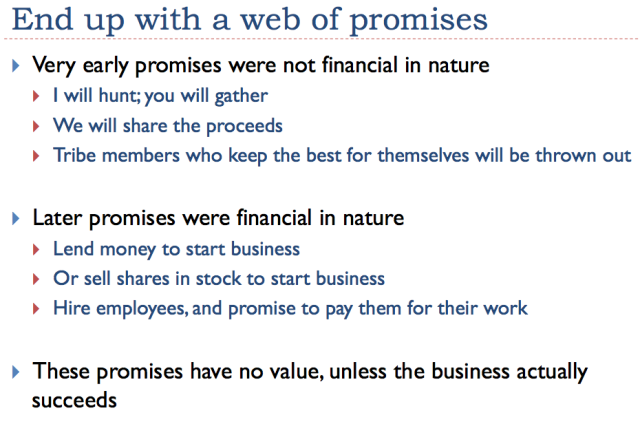 Slide 15 We rarely think about how all-pervasive promises are. Many customs of early tribes seem to reflect informal rules regarding the sharing of goods and services, and penalties if these rules are not followed. Now, financial promises have to some extent replaced informal customs. The thing that we sometimes forget is that the bonds companies offer for sale, and the stock that companies issue, have no value unless the company issuing the stock or bonds is actually successful. As a result, the many promises that are made are, in a sense, contingent promises: the bond will be repaid, if the company is still in business (or if the company is dissolved, if the amount received from the sale of assets is great enough). The future value of a company’s stock also depends on the success of the company. 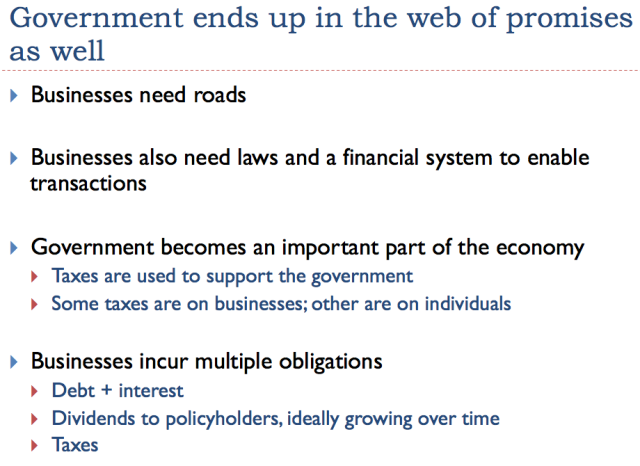 Slide 16 Governments become an important part of the web of promises. Governments collect their assessments through taxes. As an economy grows, the amount of government services tends to increase, and taxes tend to increase. The roles of governments and businesses vary somewhat depending on the type of economy of a country. In a sense, this type of variation is not important. It is the functioning of the overall networked system that is important. 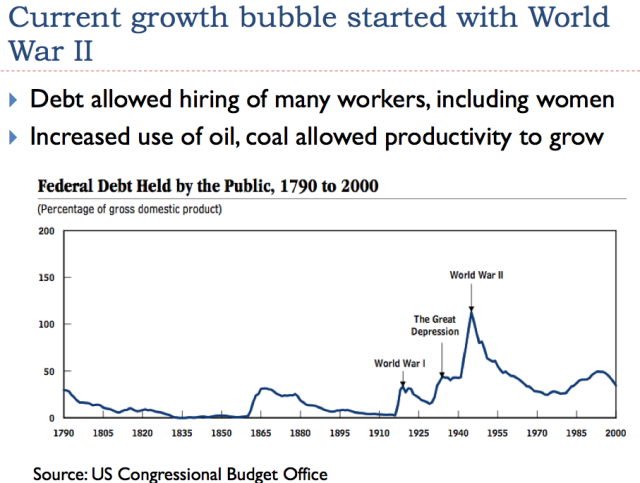 Slide 17 There was a very large run up in US debt about the time of World War II, not just in the US, but also in the other countries involved in World War II. Adding the debt for World War II helped pull the US out of the lingering effects of the Depression. Many women started working outside the home for the first time. There was a ramp-up of production, aimed especially at the war effort. What does a country do when a war is over? Send the soldiers back home again, without jobs, and the women who had been working to support the war effort back home again, also without jobs? This was a time period when non-government debt ramped up in the US. In fact, it seems to have ramped up elsewhere around the world as well. The new debt helped support many growing industries at the time–helping rebuild Europe, and helping build homes and cars for citizens in the US. As noted previously, both energy use and GDP soared during this time period. 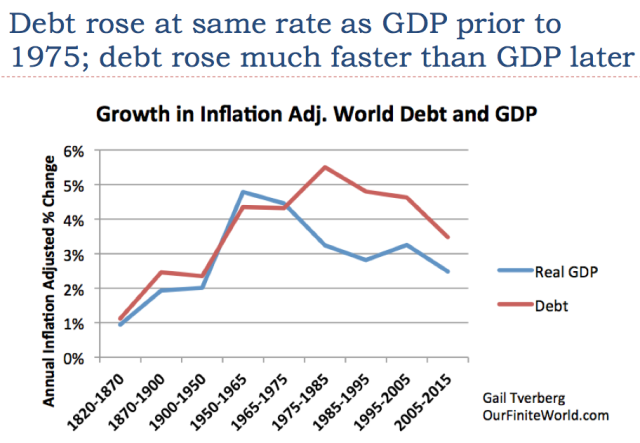 Slide 19 I haven’t found very good records of debt going back very far, but what I can piece together suggests that the rate of debt growth (total debt, including both government and private debt) was similar to the rate of growth of GDP, up until about 1975. Then, debt began growing much more rapidly than GDP. 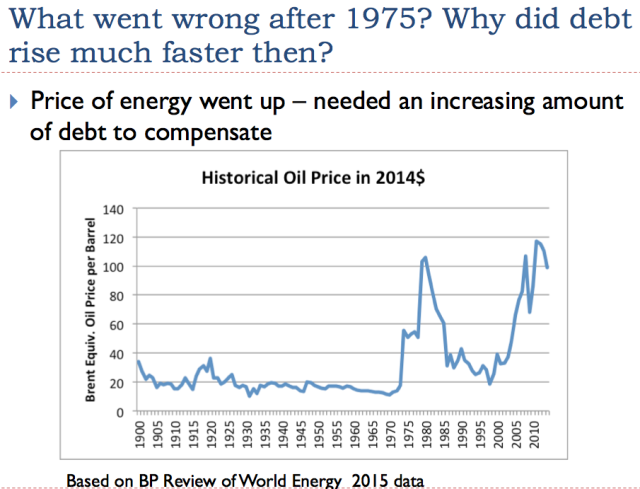 Slide 20 The big issue that led to a big increase in the need for debt in the early 1970s was an increase in the price of oil. Oil is the single largest source of source of energy. It is used in many important ways, including making food, transporting coal, and extracting metals. Thus, when the price of oil rises, so does the price of many other goods. As we noted on Slides 11, 12, and 13, it is the growing quantity of energy consumption that is important in providing economic growth. The natural tendency with high energy prices is to cut back on energy-related consumption. Increasing debt, if it is at a sufficiently low interest rate, helps counteract this natural tendency toward less energy usage. For example, the availability of debt at a low interest makes it possible for more consumers to purchase big-ticket items like houses, cars, and motorcycles. These products indirectly lead to the growing consumption of energy products, because energy is used in making these big-ticket items and because they use energy in their continuing operation. 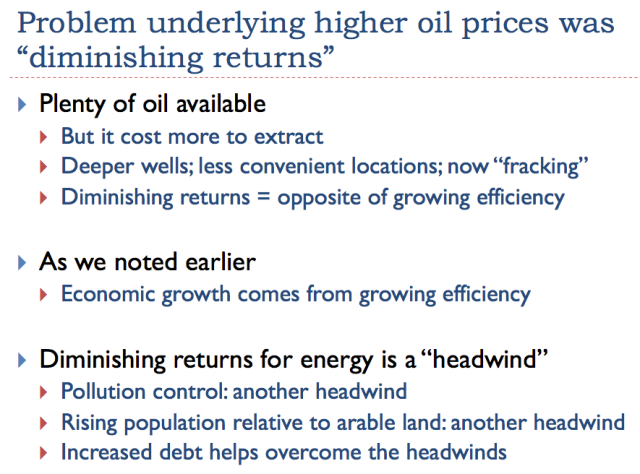 Slide 21 Many people have been concerned about what they call “peak oil”–the idea that oil supply would suddenly drop because we reach geological limits. I think that this is a backward analysis regarding how the system works. There is plenty of oil available, if only the price would rise high enough and stay high for long enough. Much of this oil is non-conventional oil–oil that cannot be extracted using the inexpensive approaches we used in the early days of oil production. In some cases, non-conventional oil is so viscous it needs to be melted with steam, before it will flow freely. Some of the unconventional oil can only be extracted by “fracking.” Some of the unconventional oil is very deep under the ocean. Near Brazil, this oil is under a layer of salt. If prices would remain high enough, for long enough, we could get this oil out. The problem is that in order to get this unconventional oil out, costs are higher. These higher costs are sometimes described as reflecting diminishing returns–more capital goods are needed, as are more resources and human labor, to produce additional barrels of oil. The situation is equivalent to the system of oil extraction becoming less and less efficient, because we need to add more steps to the operation, raising the cost of producing finished oil products. The higher price of oil products spills over to a higher cost for producing food, because oil is used in operating farm equipment and transporting food to market. The higher cost of oil also spills over to the cost of almost anything that is shipped long distance, because oil is used as a transportation fuel. You will remember that increased efficiency is what makes an economy grow faster (Slide 7, also Slide 37). Diminishing returns is the opposite of increased efficiency, so it tends to push the economy toward contraction. We are running into many other forms of increased inefficiency. One such type of inefficiency involves adding devices to reduce pollution, for example in electricity production. Another type of inefficiency involves switching to higher-cost methods of generation, such as solar panels and offshore wind, to reduce pollution. No matter how beneficial these techniques may be from some perspectives, from the perspective of economic growth, they are a problem. They tend to make the economy grow more slowly, rather than faster. The standard workaround for slow economic growth is more debt. If the interest rate is low enough and the length of the loan is long enough, consumers can “sort of” afford increasingly expensive cars and homes. Young people with barely adequate high school grades can “sort of” afford higher education. With cheap debt, businesses can afford to buy back company stock, making reported earnings per share rise–even though after the buy-back, the actual investment used to generate future earnings is lower. With sufficient cheap debt, shale companies can create models showing that even if their cash flow is negative at $100 per barrel oil prices ($2 out for $1 in) and even more negative at $50 per barrel ($4 out for $1 in), somehow, the companies will be profitable in the very long run. The technique of adding more debt doesn’t fix the underlying problem of growing inefficiency, instead of growing efficiency. Instead, as more debt is added, the additional debt becomes increasingly unproductive. It mostly provides a temporary cover-up for economic growth problems, rather than fixing them. 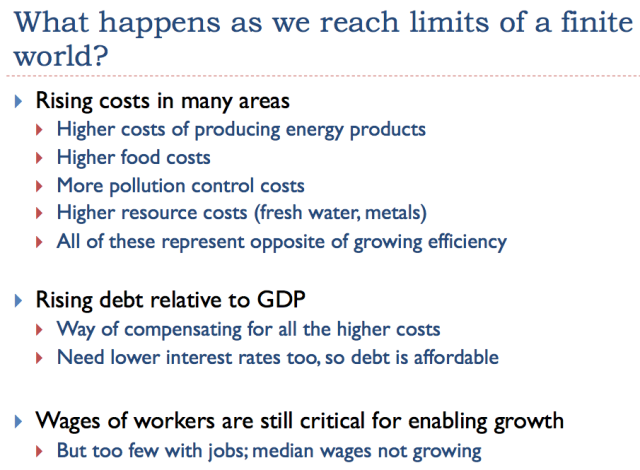 Slide 22 A common belief has been that as we reach limits of a finite world, oil prices and perhaps other prices will spike. In my view, this is a wrong understanding of how things work. What we have is a combination of rising costs of production for many kinds of goods at the same time that wages are not rising very quickly. This problem can be temporarily hidden by a rising amount of debt at ever-lower interest rates, but this is not a long-term solution. We end up with a conflict between the prices businesses need and the prices that workers can afford. For a while, this conflict can be resolved by a spike in prices, as we experienced in the 2005-2008 period. These spikes tend to lead to recession, for reasons shown on the next slide. Recession tends to lead to lower prices again. 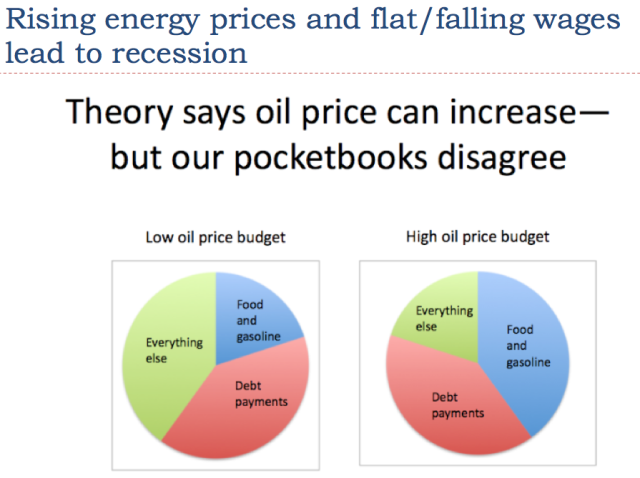 Slide 26 The image on Slide 26 shows an exaggeration to make clear the shift that takes place, if the price of oil spikes. When the price of one necessary part of consumers’ budgets increases–namely the food and gasoline segment–there is a problem. Debt payments already committed to, such as those on homes and automobiles, remain constant. Consumers find that they must cut back on discretionary spending–in other words, “Everything else,” shown in green. This tends to lead to recession. 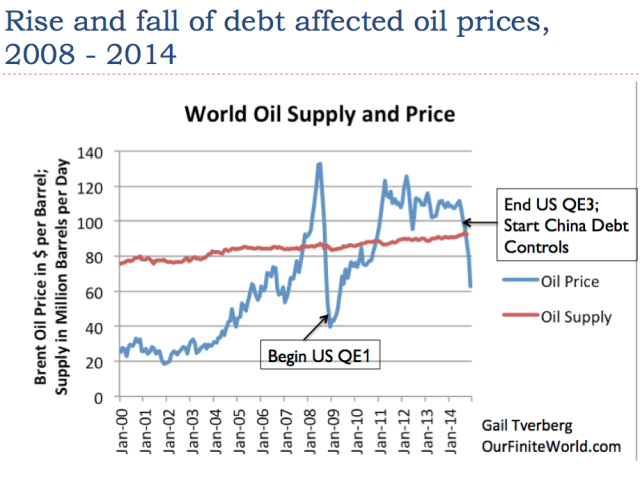 Slide 27 If we look at oil prices since 2000, we see that the period is marked by steep rises and falls in oil prices. In Slides 27 – 29, we will see that changes in the price of oil tend to correspond to changes in debt availability and cost. In 2008, oil prices rose to a peak in July, and then dropped precipitously to under $40 per barrel in December of the same year. Slide 27 shows that the United States began its program of Quantitative Easing (QE) in late 2008. This helped to lower interest rates, especially longer-term interest rates. China and a number of other countries also raised their debt levels during this period. We would expect greater debt and lower interest rates to increase demand for commodities, and thus raise their prices, and in fact, this is what happened between December 2008 and 2011. The drop in prices in 2014 corresponds to the time that the US phased out its program of QE, and China cut back on debt availability. Here, the economy is encountering less cheap debt availability, and the impact is in the direction expected–a drop in prices. If we go back to the steep drop in oil prices in July 2008, we find that the timing of the drop in prices matches the timing when US non-governmental debt started falling. In my academic article, Oil Supply Limits and the Continuing Financial Crisis, I show that this drop in debt outstanding takes place for both mortgages and credit card debt. 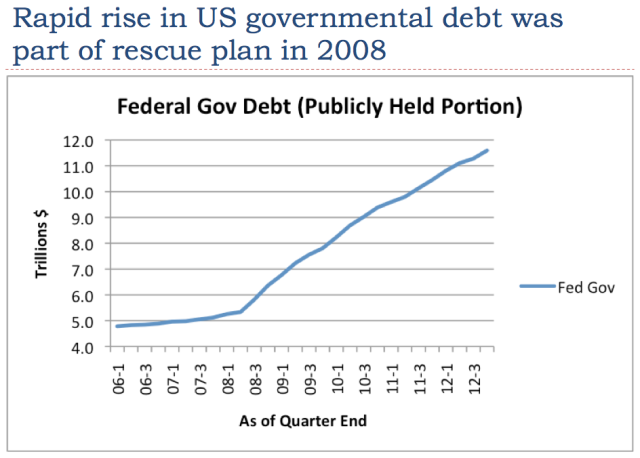 Slide 29 The US government, as well as other governments around the world, responded by sharply increasing their debt levels. This increase in governmental debt (known as sovereign debt) is part of what helped oil and other commodity prices to rise again after 2008. 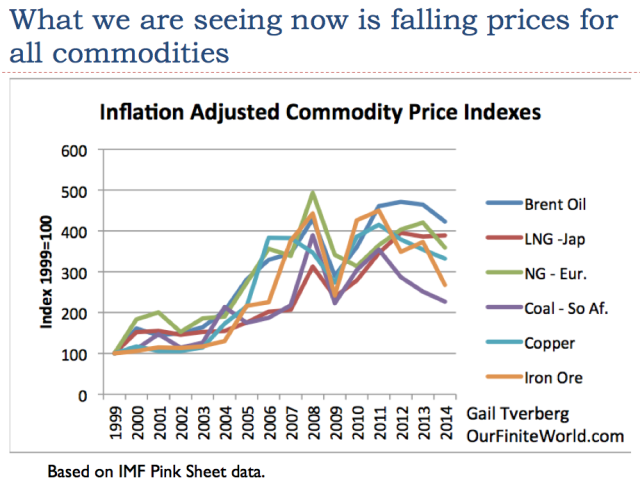 Slide 30 We often hear about the drop in oil prices, but the drop in prices is far more widespread. Nearly all commodities have dropped in price since 2011. Today’s commodity price levels are below the cost of production for many producers, for all of these types of commodities. In fact, for oil, there is hardly any country that can produce at today’s price level, even Saudi Arabia and Iraq, when needed tax levels by governments are considered as well. Producers don’t go out of business immediately. Instead, they tend to “hold on” as best they can, deferring new investment and trying to generate as much cash flow as possible. Because most of them have no alternative way of making a living, they often continue producing, as best they can, even with low prices, deferring the day of bankruptcy as long as possible. Thus, the glut of supply doesn’t go away quickly. Instead, low prices tend to get worse, and low prices tend to persist for a very long period. 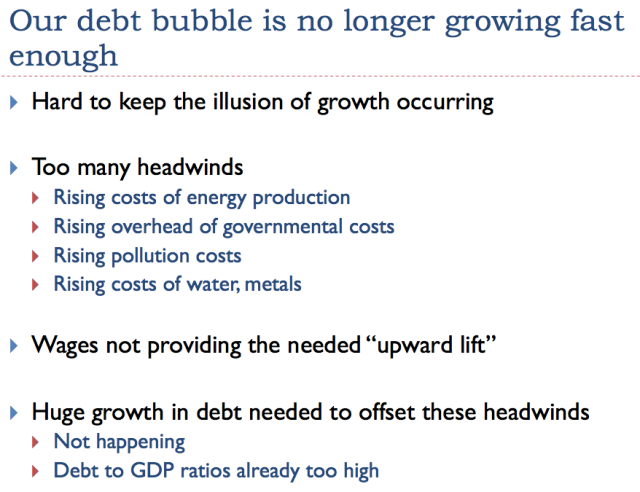 Slide 31 In 2008, we had an illustration of what can go wrong when the economy runs into too many headwinds. In that situation, the price of oil and other commodities dropped dramatically. Now we have a somewhat different set of headwinds, but the impact is the same–the price of commodities has dropped dramatically. Wages are not rising much, so they are not providing the necessary uplift to the economy. Without wage growth, the only other approach to growing the economy is debt, but this reaches limits as well. See my post, Why We Have an Oversupply of Almost Everything (Oil, labor, capital, etc.) There is some evidence that the Great Depression in the 1930s involved the collapse of a debt bubble. It seems to me that it may very well have also involved wages that were falling in inflation-adjusted terms for a significant number of wage-earners. I say this, because farmers were moving to the city in the early 1900s, as mechanization led to lower prices for food and less need for farmers. I haven’t seen figures on incomes of farmers, but I wouldn’t be surprised if they were dropping as well, especially for the many farmers who couldn’t afford mechanization. Wages for those who wanted to work as laborers on farms were likely also dropping, since they now needed to compete with mechanization. In many ways, the situation that led up to the Great Depression appears to be not too different from our situation today. In the early 1900s, many farmers were being displaced by changes to agriculture. Now, wages for many are depressed, as workers in developed economies increasingly compete with workers in historically low-wage countries. Additional mechanization of manufacturing also plays a role in reducing job opportunities. If my conjecture is right, the Great Depression may have been caused by problems similar to what we are seeing today–wages that were too low for a large segment of the economy, thus reducing economic growth, and a temporary debt bubble that tended to cover up the wage problem. Once the debt bubble collapsed, demand for commodities of all types collapsed, and prices collapsed. This problem was very difficult to fix. 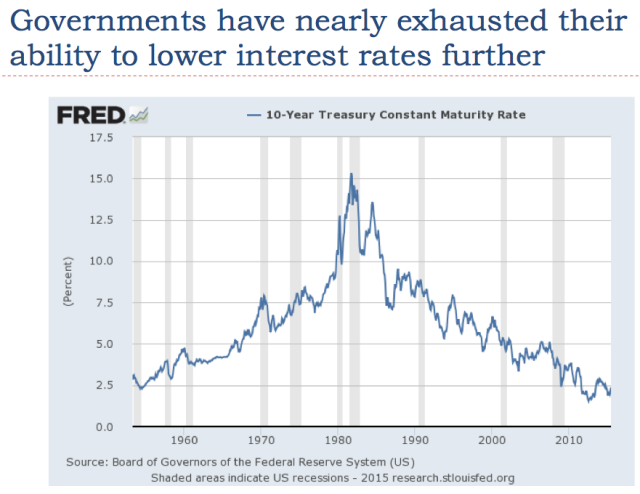 Slide 32 When we add more debt to the economy, users of debt-financing find that more of their future income goes toward repaying that debt, cutting off the ability to buy other goods. For example, a young person with a large balance of student loans is unlikely to be able to afford buying a house as well. A way of somewhat mitigating the problem of too much income going toward debt repayment is lowering interest rates. In fact, in quite a few countries, the interest rates governments pay on debt are now negative. 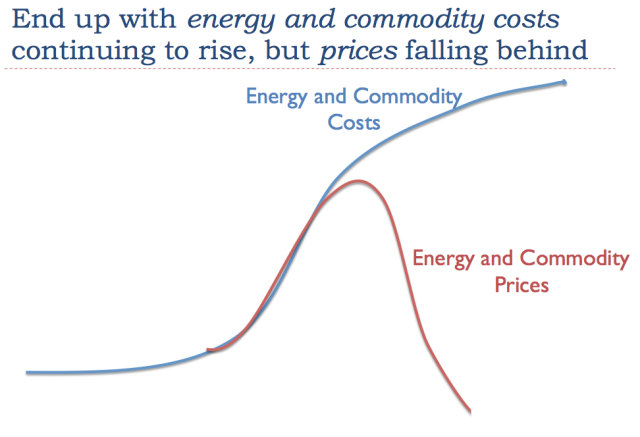 Slide 33 If the cost of producing commodities continues to rise, but the price that consumers can afford to pay does not rise sufficiently, at some point there is a problem. Instead of continuing to rise, prices start to fall below their cost of production. This drop can be very sharp, as it was in 2008. The falling price of commodities is the same situation we encountered in 2008 (Slide 27); it is the same situation we reached at the beginning of the Great Depression back in 1929. It seems to happen when wage growth is inadequate, and the debt level is not growing fast enough to hide the inadequate wage growth. This time around, we are also challenged by the cost of producing commodities rising, something that was not a problem at the time of the Great Depression. 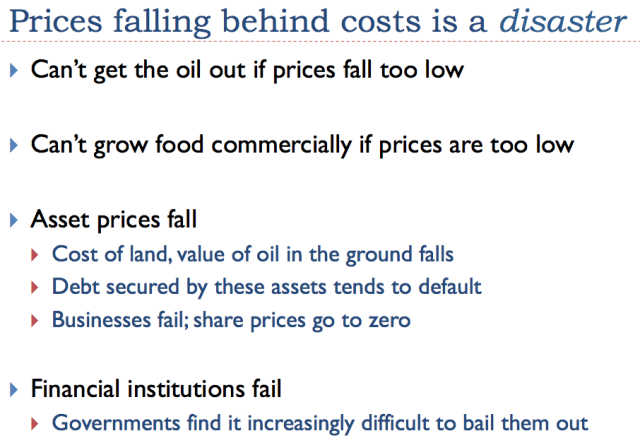 Slide 34 If we think about the situation, having prices fall behind the cost of production is a disaster. We can’t get oil out of the ground, if prices are too low. Farmers can’t afford to grow food commercially, if prices remain too low. Prices of assets such as the value of farmland, the value of oil held by leases, and the value of metal ores in mines will fall. Assets such as these secure many loans. If an oil company has a loan secured by the value of oil held by lease, and this value falls permanently, there is a significant chance that the oil company will default on the loan. The usual belief is, “The cure for low prices is low prices.” In other words, the situation will fix itself. What really happens, though, is that everyone is so afraid of a big crash that all parties make extreme efforts to avoid a crash. In fact, there is evidence today that banks are “looking the other way,” rather than taking steps to cut off lending to shale drillers, when current operations are clearly unprofitable. By the time the crash does come around, it is likely to be a huge one, affecting many segments of the economy at once. Oil exporters and exporters of other commodities will be especially affected. Some of them, such as Venezuela, Yemen, and even Iraq may collapse. Financial institutions are likely to find themselves burdened with many “underwater loans.” The usual technique of lowering interest rates to try to aid the economy doesn’t look like it would work this time, because rates are already so low. Governments are not in sufficiently good financial condition to be able to bail out all of the banks and others needing assistance. In fact, governments may fail. The fall of the former Soviet Union occurred when oil prices were low. Once there are major debt defaults, lenders will want to wait to see that prices will stay consistently high for a period (say, two or three years) before extending credit again. Thus, even if commodity prices should bounce back in 2017, it is doubtful that producers will be able to find financing at a reasonable interest rate until, say, 2020. By that time, depletion will have taken its toll. It will be impossible to make up for the many years of low investment at that time. Production is likely to continue falling, even if prices do rise. The indirect impact of low oil and other commodity prices is likely to be a collapse in our current debt bubble. This collapsing bubble may lead to the failures of banks and even governments. It seems quite possible that these indirect impacts will affect us most, even more than the direct loss of commodities. These impacts could come quite quickly–in the next few months, in some cases. 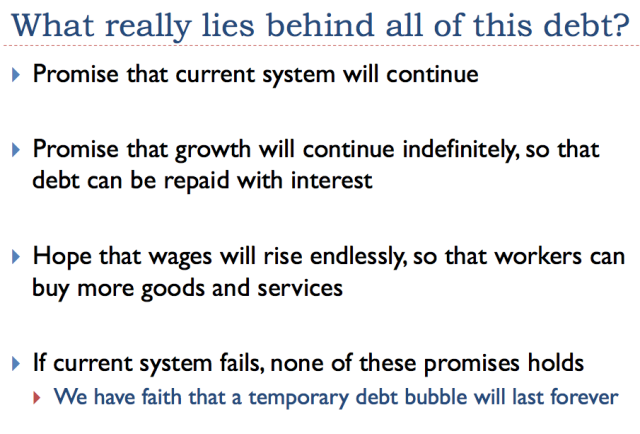 Slide 35 Stocks, bonds, pension programs, insurance programs, bank accounts, and many other things of a financial nature seem to be very “solid” things–things that we can expect to be here and grow, for many years to come. Yet these things, directly and indirectly, depend on the ability of our system to produce goods and services. If something goes terribly wrong, we may find that financial assets have little more value than the pieces of paper that represent them. 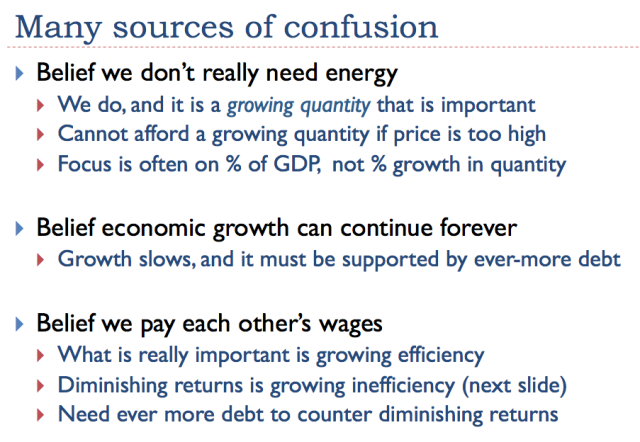 Slide 36 I won’t try to explain Slide 36 further. 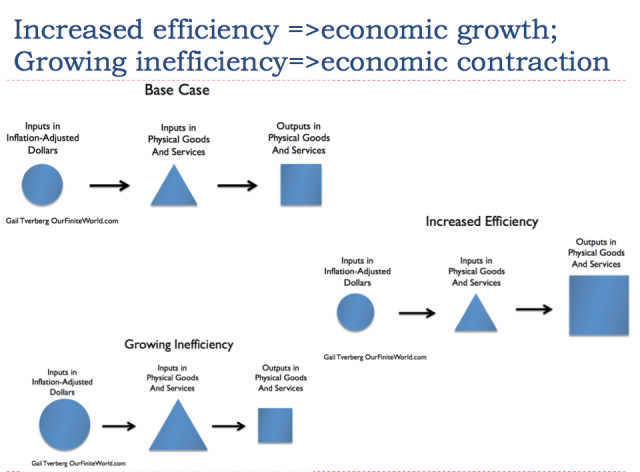 Slide 37 Slide 37 illustrates the principle of increased efficiency. If a smaller amount of resources and human labor can be used to create a larger amount of end product, this is growing efficiency. If more and more resources and labor are used to produce a smaller amount of end product, this is growing inefficiency. The other part of the story is that simply automating processes is not enough. Instead, the economy must also produce a sufficiently large number of jobs, and these jobs must pay high enough wages that the workers can afford to buy the output of the economy. It is really the health of the whole interconnected system that is important. 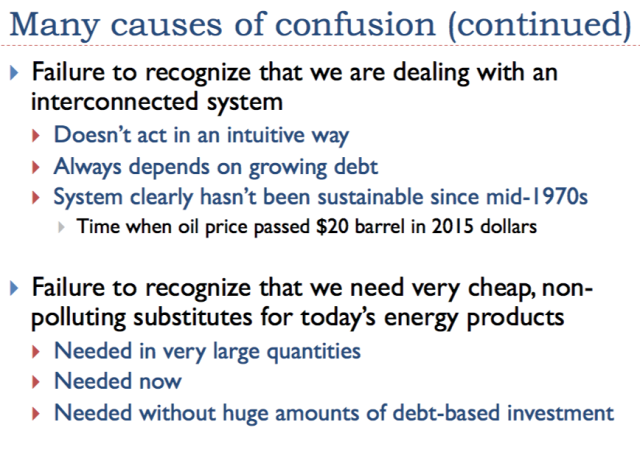 Slide 38 Our low price problems are here now. That is why we need very cheap non-polluting energy products now, in large quantity, if there is any chance of fixing the system. These energy products must work in today’s devices, so we aren’t faced with the cost and delay involved with changing to new devices, such as cars and trucks that use a different fuel than petroleum. 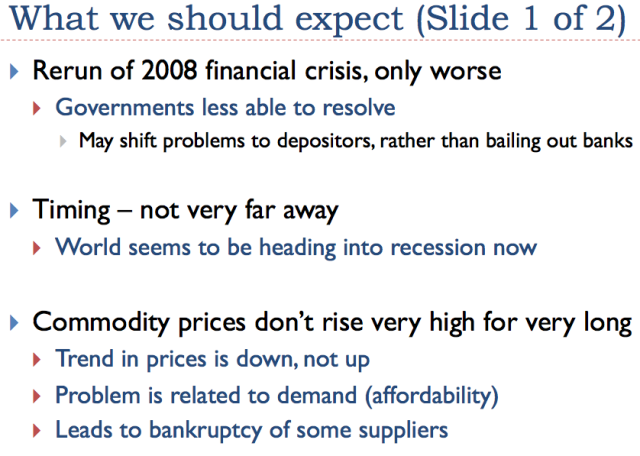 Slide 39 Regarding Slides 39 and 40, we are sitting on the edge, waiting to see what will happen next. The US economy temporarily seems to be in somewhat of a bubble, now that it does not have QE, while several other countries still do. This bubble is related to a “flight to quality,” and leads to a higher dollar, relative to other currencies. It also leads to high stock market valuations. As a result, the US economy seems to be doing better than much of the rest of the world.
Regardless of how well the US economy seems to be doing, the underlying problems of rising costs of producing commodities and prices that lag below the cost of production are still present, making the situation unstable. Wages continue to lag behind as well. We should not be too surprised if the economy starts taking major downward steps in the next few months.
|
|||
| TO TOP | |||
| MACRO News Items of Importance - This Week | |||
GLOBAL MACRO REPORTS & ANALYSIS |
|||
US ECONOMIC REPORTS & ANALYSIS |
|||
| CENTRAL BANKING MONETARY POLICIES, ACTIONS & ACTIVITIES | |||
| Market | |||
| TECHNICALS & MARKET |
|
||
| Market - WEDNESDAY STUDIES | |||
| TECHNICALS & MARKET |
|
||
| STUDIES - MACRO pdf | |||
Q3 EARNINGS SEASON |
11-04-15 | STUDIES | |
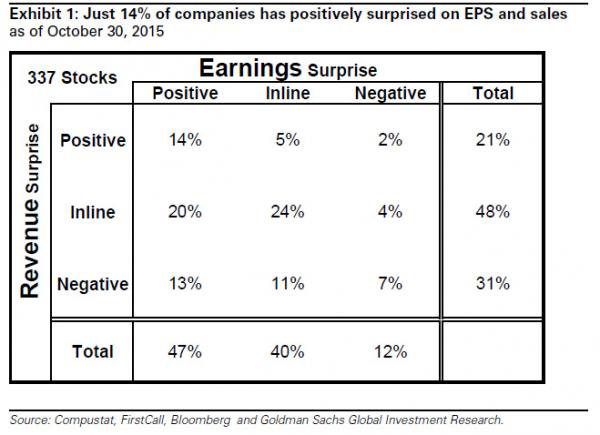
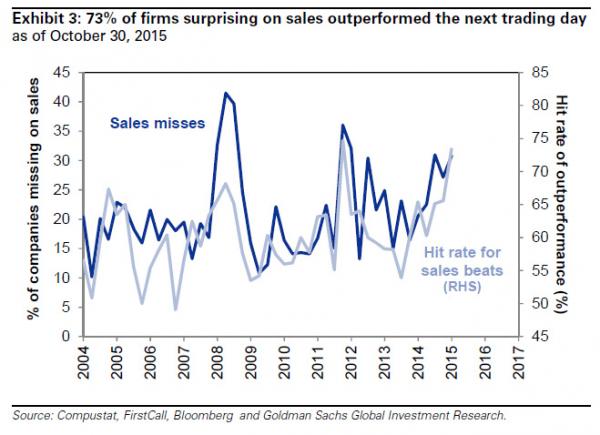
Submitted by Tyler Durden on 10/31/2015 Goldman's 4 Word Summary Of Q3 Earnings Season: "Adequate Earnings, Dismal Sales"Haven't bothered to check in on the third quarter earnings season (which at this rate will mark the first two back-to-back quarters of earnings declines since 2009, aka an earnings recession)? Then here is the 4 word summary from Goldman Sachs: "adequate earnings, dismal sales."
If companies beat on earnings do they also beat on revenues?
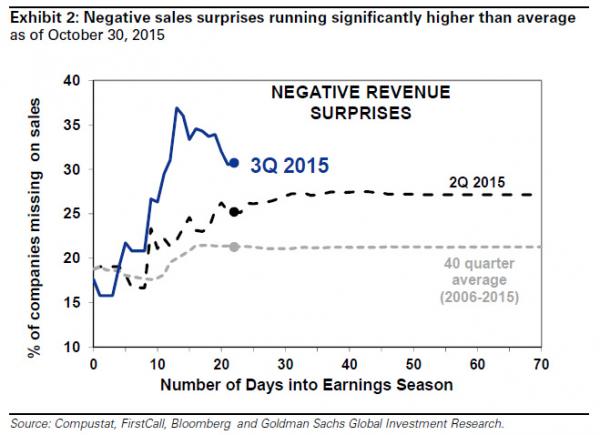
So as corporate teams seek to push margins even higher in the coming quarters, there will be even more layoffs in the coming quarters, and even more disappointing employment numbers... which is great news for a "lower for longer" addicted market. What is the cause of the ongoing revenue slowdown, aside from lack of capital investment of course? The strong dollar is the biggest culprit, a dollar which keeps getting stronger.
For those wondering if the weak top line number means a slowing economy, the answer is yes.
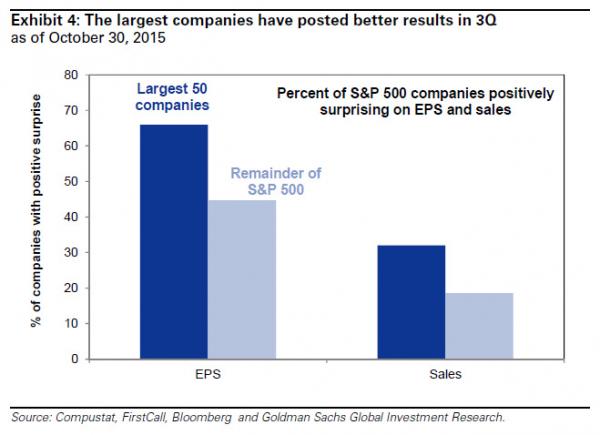
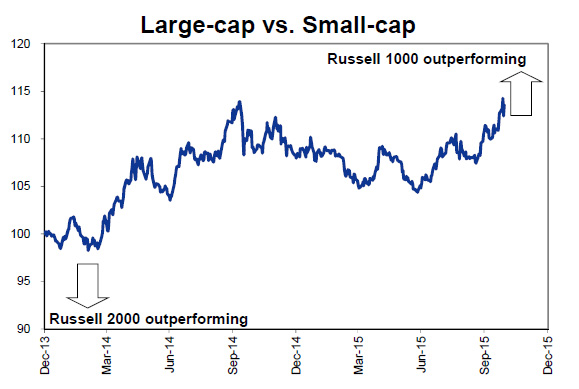
It's not bad news for all though: the biggest companies will survive and will likely get even bigger.
... something the market has noticed and rewarded.
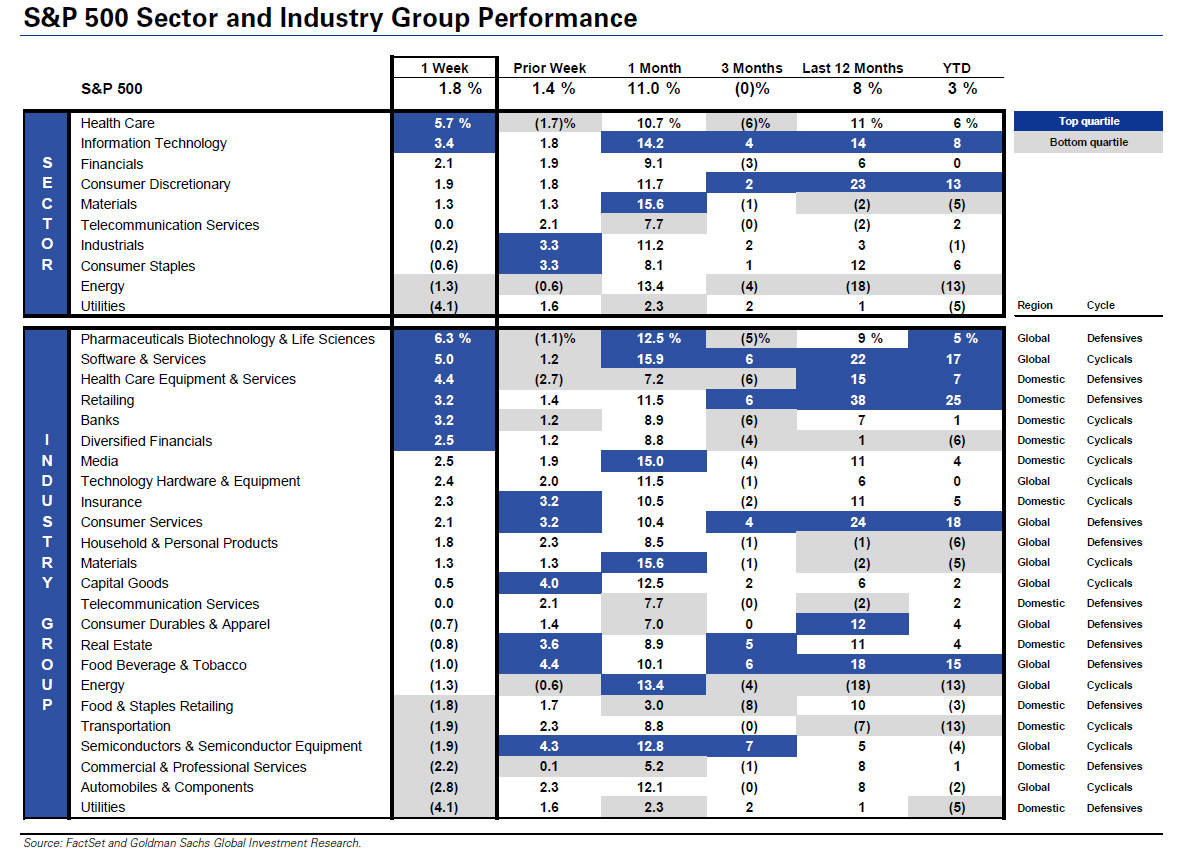
Finally here is the full sector and industry performance broken down in various periods:
* * * Finally, this is where Goldman sees the S&P trading in 1 year: "We expect the S&P 500 will likely trade at 2075 in 12 months (-0.7%).
|
|||
| COMMODITY CORNER - AGRI-COMPLEX | PORTFOLIO | ||
| SECURITY-SURVEILANCE COMPLEX | PORTFOLIO | ||
| THESIS - Mondays Posts on Financial Repression & Posts on Thursday as Key Updates Occur | |||
| 2015 - FIDUCIARY FAILURE | 2015 | THESIS 2015 |  |
| 2014 - GLOBALIZATION TRAP | 2014 |  |
|
 |
|||
|
2013 2014 |
 |
||
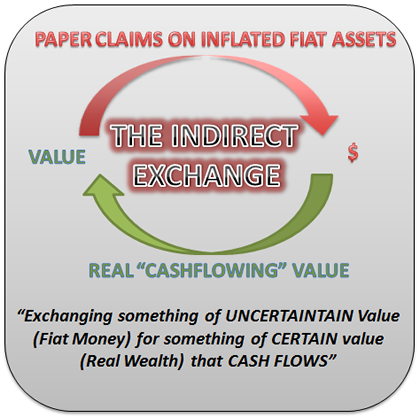
FINANCIAL REPRESSION THE AUSTRIAN SCHOOL OF ECONOMICS USES THE "INDIRECT EXCHANGE" TO CAPTURE REAL WEALTH Ty Andros, Editor of Tedbits and Austrianism Purist FRA Co-Founder Gordon T. Long deliberates the Austrian School of Economics with Ty Andros of Tedbits Newsletter. Ty Andros began his commodity career in the early 1980's and became a managed futures specialist beginning in 1985.Mr. Andros attended the University of San Diego, and the University of Miami, majoring in Marketing, Economics and Business Administration. Mr. Andros is active in Economic analysis and brings this information and analysis to his clients on a regular basis. WHAT IS AUSTRIAN ECONOMICS? “Austrian economics is just human behaviour, and common sense, and history.” “But what’s happening is human behaviour, nonsense, and history. We are at a period where people have forgotten history and are doomed to repeat it. “ “Austrian school and capitalism are one in the same.” “Austrian Economics is production of wealth, producing more than you consume. Meeting people’s needs and doing it in a superior manner; in other words, capitalism.” The historical school, had argued that economic science is incapable of generating universal principles and that scientific research should instead be focused on detailed historical examination. The school thought the English classical economists mistaken in believing in economic laws that transcended time and national boundaries. APPLYING AUSTRIANISM TO INVESTING “You have to prey on paper.” “The only real way the middle class will get to success is going out serving others and getting rewarded for it.” “Austrian school is just history, common sense, and the production of wealth; everything else will flow from there. The reason middle classes cannot rise is somehow the public has gotten the idea that they are going to raise their lifestyle through the stroke of a pen at a central bank or other government bodies.” THE INDIRECT EXCHANGE “In today’s world economic growth is a function of a printing press; consumption presented as production.”
It is a situation in which goods, services, etc. are traded between two countries using the currency of a third country. Real wealth can only be created by growing it, mining it, building it, manufacturing it; being rewarded for providing more goods and services for less to consumers. What we have now is phony capitalism, which is more money for less goods and services, while consumer demand is being mandated by government planning and controlled by central banking. EVENTS TO UNFOLD IN THE UPCOMING YEARS “We are in a death event.” “If you date interest rates going back 600-600 years, we have never once had a scenario where they were kept at zero for 6 years. What we have is a flat line; just like in any medical monitor a flat line is fatal.” “The system is dead, we are just sitting there on the fumes and they can’t relight it because they have outlawed free enterprise capitalism, and wealth creation. Look at the health care system right now, it is just a leviathan. They went in there and wrote Obama Care for themselves and that’s how they became supporters. It was government sanctioned.” “Just look at Japan, we are headed right there.” “The long term the yield curve is going to invert, but it is going to invert near zero. There is no growth, the only growth there is, is just credit creation. To spurt credit creation they have to make it easier for people to borrow so people can miscalculate their returns.” CURRENCY EXTINCTION “Currencies expire when people wake up, the value that currencies hold are only values within people’s minds.” There is absolutely no value in them. As long as they are perceived as having real worth, you can purchase real things; this is the indirect exchange. Money is a store of value because it is not pegged to anything, as long as this allusion is there; we are substituting it to grab a hold of real cash flowing assets. THE LEVERAGE COLLAPSE “The dollar is going down, and it is going to die; but it will be the last to die.” “They really have people thinking that the dollar is a risk free asset, and it is not. It is a worthless junk bond. Currencies don’t float, they just sink at different rates, and the sinking is managed by the BIS and the ECB, Bank of England, Bank of Japan etc. and they all mange the theft of remaining value with their printing presses.” “The financial systems were given the keys to the castle. These economies are not run for the benefit of the entrepreneur; they are run for the benefit of the financiers. It is a game that the central banks have been playing since the 1600’s when the Rothschild’s went after the Bank of England. We are in troubling times and we need to be well informed. If you are an investor and you do it right, it will be the greatest time in history.” “A Depression is incoming and this one will be nasty, in fact it will be the worst one ever.”
Abstract written by Karan Singh [email protected]
|
11-02-15 | THESIS | |
2011 2012 2013 2014 |
 |
||
| THEMES - Normally a Thursday Themes Post & a Friday Flows Post | |||
I - POLITICAL |
|||
| CENTRAL PLANNING - SHIFTING ECONOMIC POWER - STATISM | THEME | ||
- - CORRUPTION & MALFEASANCE - MORAL DECAY - DESPERATION, SHORTAGES. |
THEME |  |
|
| - - SECURITY-SURVEILLANCE COMPLEX - STATISM | M | THEME | |
| - - CATALYSTS - FEAR (POLITICALLY) & GREED (FINANCIALLY) | G | THEME | |
II-ECONOMIC |
|||
| GLOBAL RISK | |||
| - GLOBAL FINANCIAL IMBALANCE - FRAGILITY, COMPLEXITY & INSTABILITY | G | THEME | |
| - - SOCIAL UNREST - INEQUALITY & A BROKEN SOCIAL CONTRACT | US | THEME | |
| - - ECHO BOOM - PERIPHERAL PROBLEM | M | THEME | |
| - -GLOBAL GROWTH & JOBS CRISIS | |||
| - - - PRODUCTIVITY PARADOX - NATURE OF WORK | THEME | MACRO w/ CHS |
|
| - - - STANDARD OF LIVING - EMPLOYMENT CRISIS, SUB-PRIME ECONOMY | US | THEME | MACRO w/ CHS |
| STANDARD OF LIVING - SUB-PRIME ECONOMY | US | THEME | MACRO w/ CHS |
III-FINANCIAL |
|||
| FLOWS -FRIDAY FLOWS | MATA RISK ON-OFF |
THEME |  |
| CRACKUP BOOM - ASSET BUBBLE | THEME | ||
| SHADOW BANKING - LIQUIDITY / CREDIT ENGINE | M | THEME | |
| GENERAL INTEREST |
|
||
| STRATEGIC INVESTMENT INSIGHTS - Weekend Coverage | |||
|
SII | ||
|
SII | ||
|
SII | ||
|
SII | ||
| 10-31-15 | SII | ||
| TO TOP | |||
Read More - OUR RESEARCH - Articles Below

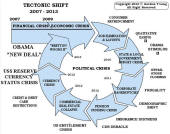
Tipping Points Life Cycle - Explained
Click on image to enlarge
TO TOP
 |
YOUR SOURCE FOR THE LATEST THINKING & RESEARCH
|
�
TO TOP