|
JOHN RUBINO'SLATEST BOOK |
||||||||||||||||||||||||||||||||||||||||||||||||||||||||||||||||||||||||||||||||||||||||||||||||||||||||||||||||||||||||||||||||||||||||||||||||||||||||||||||||||||||||||||||||||||||||||||||||||||||||||||||||||||||||||||||||||||||||||||||||||||||||||||||||||||||||||||||||||
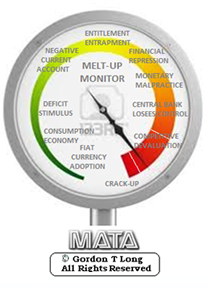
"MELT-UP MONITOR "
Meltup Monitor: FLOWS - The Currency Cartel Carry Cycle - 09 Dec 2013 Meltup Monitor: FLOWS - Liquidity, Credit & Debt - 04 Dec 2013 Meltup Monitor: Euro Pressure Going Critical - 28- Nov 2013 Meltup Monitor: A Regression-to-the-Exponential Mean Required - 25 Nov 2013
|

![]()
"DOW 20,000 "
Lance Roberts Charles Hugh Smith John Rubino Bert Dohman & Ty Andros
|
HELD OVER
Currency Wars
Euro Experiment
Sultans of Swap
Extend & Pretend
Preserve & Protect
Innovation
Showings Below
"Currency Wars "
|
"SULTANS OF SWAP" archives open ACT II ACT III
ALSO Sultans of Swap: Fearing the Gearing! Sultans of Swap: BP Potentially More Devistating than Lehman! |

"EURO EXPERIMENT"
archives open EURO EXPERIMENT : ECB's LTRO Won't Stop Collateral Contagion!
EURO EXPERIMENT: |

![]()
"INNOVATION"
archives open |

"PRESERVE & PROTE CT"
archives open |

Weekend Oct. 10th, 2015
Follow Our Updates
onTWITTER
https://twitter.com/GordonTLong
AND FOR EVEN MORE TWITTER COVERAGE
ANNUAL THESIS PAPERS
FREE (With Password)
THESIS 2010-Extended & Pretend
THESIS 2011-Currency Wars
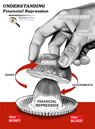
THESIS 2012-Financial Repression
THESIS 2013-Statism
THESIS 2014-Globalization Trap
THESIS 2015-Fiduciary Failure
NEWS DEVELOPMENT UPDATES:
FINANCIAL REPRESSION
FIDUCIARY FAILURE
WHAT WE ARE RESEARCHING
2015 THEMES
SUB-PRIME ECONOMY
PENSION POVERITY
WAR ON CASH
ECHO BOOM
PRODUCTIVITY PARADOX
FLOWS - LIQUIDITY, CREDIT & DEBT
GLOBAL GOVERNANCE
- COMING NWO
WHAT WE ARE WATCHING
(A) Active, (C) Closed
MATA
Q3 '15- Chinese Market Crash
(A)
Q3 '15-
GMTP
Q3 '15- Greek Negotiations
(A)
Q3 '15- Puerto Rico Bond Default
MMC
OUR STRATEGIC INVESTMENT INSIGHTS (SII)
NEGATIVE-US RETAIL
NEGATIVE-ENERGY SECTOR
NEGATIVE-YEN
NEGATIVE-EURYEN
NEGATIVE-MONOLINES
POSITIVE-US DOLLAR
ARCHIVES
| OCTOBER | ||||||
| S | M | T | W | T | F | S |
| 1 | 2 | 3 | ||||
| 4 | 5 | 6 | 7 | 8 | 9 | 10 |
| 11 | 12 | 13 | 14 | 15 | 16 | 17 |
| 18 | 19 | 20 | 21 | 22 | 23 | 24 |
| 25 | 26 | 27 | 28 | 29 | 30 | 31 |
KEY TO TIPPING POINTS |
| 1- Bond Bubble |
| 2 - Risk Reversal |
| 3 - Geo-Political Event |
| 4 - China Hard Landing |
| 5 - Japan Debt Deflation Spiral |
| 6- EU Banking Crisis |
| 7- Sovereign Debt Crisis |
| 8 - Shrinking Revenue Growth Rate |
| 9 - Chronic Unemployment |
| 10 - US Stock Market Valuations |
| 11 - Global Governance Failure |
| 12 - Chronic Global Fiscal ImBalances |
| 13 - Growing Social Unrest |
| 14 - Residential Real Estate - Phase II |
| 15 - Commercial Real Estate |
| 16 - Credit Contraction II |
| 17- State & Local Government |
| 18 - Slowing Retail & Consumer Sales |
| 19 - US Reserve Currency |
| 20 - US Dollar Weakness |
| 21 - Financial Crisis Programs Expiration |
| 22 - US Banking Crisis II |
| 23 - China - Japan Regional Conflict |
| 24 - Corruption |
| 25 - Public Sentiment & Confidence |
| 26 - Food Price Pressures |
| 27 - Global Output Gap |
| 28 - Pension - Entitlement Crisis |
| 29 - Central & Eastern Europe |
| 30 - Terrorist Event |
| 31 - Pandemic / Epidemic |
| 32 - Rising Inflation Pressures & Interest Pressures |
| 33 - Resource Shortage |
| 34 - Cyber Attack or Complexity Failure |
| 35 - Corporate Bankruptcies |
| 36 - Iran Nuclear Threat |
| 37- Finance & Insurance Balance Sheet Write-Offs |
| 38- Government Backstop Insurance |
| 39 - Oil Price Pressures |
| 40 - Natural Physical Disaster |
Reading the right books?
No Time?
We have analyzed & included
these in our latest research papers Macro videos!
OUR MACRO ANALYTIC
CO-HOSTS
John Rubino's Just Released Book
Charles Hugh Smith's Latest Books


Our Macro Watch Partner
Richard Duncan Latest Books
MACRO ANALYTIC
GUESTS
F William Engdahl


OTHERS OF NOTE
Book Review- Five Thumbs Up
for Steve Greenhut's Plunder!


![]()
TODAY'S TIPPING POINTS
|
Have your own site? Offer free content to your visitors with TRIGGER$ Public Edition!
Sell TRIGGER$ from your site and grow a monthly recurring income!
Contact [email protected] for more information - (free ad space for participating affiliates).
HOTTEST TIPPING POINTS |
Theme Groupings |
||
We post throughout the day as we do our Investment Research for: LONGWave - UnderTheLens - Macro
|
|||
|
MOST CRITICAL TIPPING POINT ARTICLES TODAY
|
|
||
|
|||
|
|
10-10-15 | SII | |
Submitted by Tyler Durden on 10/06/2015
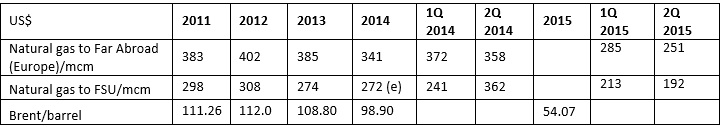
Is Russia Plotting To Bring Down OPEC?Submitted by Dalan McEndree of OilPrice Is Russia Plotting To Bring Down OPEC? President Putin’s recent moves in the Middle East—to shore up Bashar al-Assad’s regime in Syria through deployment of combat aircraft, equipment, and manpower and build-out of air-, naval-, and ground-force bases, and the agreement in the last week with Iran, Iraq, and Syria on intelligence and security cooperation—could contribute to Russian efforts to combat the myriad negative pressures on Russia’s vital energy industry. Live by Energy… Energy is the foundation of Russia, its economy, its government, and its political system. Putin has highlighted on various occasions the contribution Russia’s mineral wealth, in particular oil and natural gas, must make for Russia to be able to sustain economic growth, promote industrial development, catch up with the developed economies, and modernize Russia’s military and military industry. Even a casual glance at the IMF’s World Economic Outlook statistics for Russia shows the tight correlation since 1992 between GDP growth on the one hand and oil and gas output, exports, and prices on the other (economic series available here). According to the IMF’s 2015 Article Iv Consultation-Press Release and Staff Report, published August 3, oil and natural gas exports comprised 65 percent of exports, 52 percent of the Federal government budget, and 14.5 percent of GDP in 2014. Including their domestic contribution, hydrocarbons represent ~30 percent of GDP. While oil and natural gas are crucial to Russia, Russia’s crude and natural gas are crucial to its neighbors on the Eurasian landmass. Russia supplied about 30 percent (146.6 bcm) of Europe’s natural gas in 2014, and about 25 percent of its crude (3.5 mmbbl/day) in 2013. Russia’s oil and natural gas are also important to its Asian and Central Asian neighbors. It is not only the commodities that make Russia crucial, but its massive land-based infrastructure for their distribution throughout the Eurasian landmass. As Tatiana Mitrova, head of the oil and gas department, Energy Research Institute, Russian Academy of Sciences, pointed out regarding natural gas in The Geopolitics of Russian Natural Gas: “Russia has a unique transcontinental infrastructure in the heart of Eurasia (150,000 km of trunk pipelines), which also makes it a backbone of the evolving, huge Eurasian gas market (which could include Europe, North Africa, the Commonwealth of Independent States (CIS), Caspian Sea region, and Northeast Asia). Control over the transportation assets in this region together with vast gas reserves make Russia the key element of this new market.” The land-based oil distribution network is smaller, but also important. The 4,000 km Druzhba pipeline delivers about 1 mmbbl/day of crude to Europe—about 30 percent of total shipments to Europe. In the Far East, Rosneft shipped 22.6 million tons of crude to China in 2014 through the East Siberian Pacific Ocean (ESPO) pipeline. The Russian government continues to seek to extend and expand the natural gas distribution infrastructure—into Europe, with various proposed pipeline projects (Nord Stream 2, Turkish Stream 2, 3, and 4, South European Pipeline), and into China, with two large pipeline projects, Power of Siberia Pipeline (to supply China from East Siberia), and the proposed Altai pipeline (to supply China from West Siberia). …Death by Energy In the last few years, the threats to Russia’s energy industry have multiplied and intensified. They pose an existential threat to the industry and therefore to the Russian economy: - The revenues Russia can earn from its crude and natural gas exports face intense pressure. The Saudi decision to let the market set prices and to pursue market share, has led to steep declines in crude and petroleum product prices. The decision also has impacted natural gas export prices negatively, since, for Russia’s long-term supply agreements, they wholly or partially are indexed to oil prices. The transition in Europe to hybrid natural gas pricing models (which take European spot hub prices into account) also has pressured natural gas pricing. (Natural gas data from Gazprom).
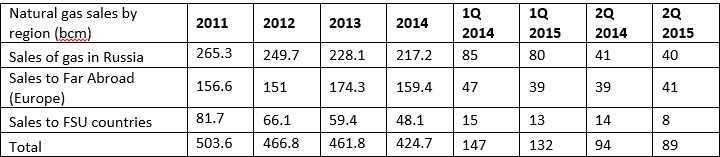
(Click to enlarge) Adding to the revenue pain, natural gas export volumes have been falling, according to Gazprom (which has a monopoly on pipeline exports), as have domestic volumes within Russia:
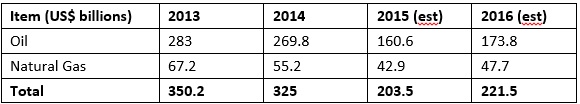
(Click to enlarge) It is therefore not surprising that the aforementioned IMF Article Iv Consultation-Press Release and Staff Report projected sharp declines in 2015 and 2016 from 2014 levels for oil export revenues ($109.8 billion and $96 billion respectively) and natural gas export revenues ($12 billion and $14.3 billion respectively).
(Click to enlarge) Since these IMF projections are based on $60.1 and $65.8 per barrel prices in 2015 and 2016, oil export revenues will undershoot these pessimistic IMF projections, as crude prices are projected to stay below $60 through 2016 (EIA estimates for Brent are $54.07 and 58.57 in 2015 and 2016 respectively). - The U.S. and European Union’s decisions to impose—and maintain—sanctions on Russia after its invasion and annexation of Crimea and invasion and informal annexation eastern Ukraine will pile more pressure on the Russian energy industry. They include bans on financing for and the supply of critical equipment and technology to important Russian energy projects. Novatek and its partners Total and Chinese National Petroleum Company still lack $15 billion of the $27 billion needed to finance the Yamal LNG plant. Denis Khramov, Russia’s deputy Minister of Natural Resources, said September 28 at a conference in Russia’s Far East that Rosneft and Gazprom are delaying some offshore drilling by two to three years because of sanctions and low oil prices. The sanctions are also impeding Gazprom’s ability to develop the Chayandinskoye and Kovyktinskoye fields in eastern Siberia, from which it plans to supply natural gas to China under the bilateral $400 billion, thirty year deal signed in 2014. - Following the Russian invasion of Crimea and eastern Ukraine, The European Union is now even more determined to reduce its dependence on Russia for natural gas and to force Gazprom submit to EU competition rules. Europe has sought and continues to seek alternatives Russian natural gas (among them, U.S. LNG and Iranian pipeline and/or LNG). The European Commission, the European Union’s executive body, has refused to bless Gazprom’s proposed 55 bcm/year Nord Stream 2 natural gas pipeline project, citing existing surplus Gazprom pipeline capacity into Europe and insufficient future demand for Russian natural gas. Also, the EU Commission in April charged Gazprom with violating the EU’s anti-trust laws for anti-competitive practices and unfair pricing in Central and Eastern Europe. If found guilty, Gazprom could face substantial fines of around $1 billion. Even if Gazprom avoids fines and manages to reach a settlement with the EU, as it hopes to do, its European market share and pricing will remain under pressure into the future. - The emergence of the U.S., along with Canada, as powerful crude, NGL, and natural gas producers is also a major concern for the Russian economy. This has transformed the U.S. from a market for Russian crude and natural gas (via LNG) to a global competitor. If, as seems increasingly likely, the ban on crude exports is lifted, U.S. crude will compete with Russian crude in several key markets. It would also force foreign suppliers to seek other markets for all or part of the exports they previously sent to the U.S. This in turn would intensify competition among these crude exporting countries for share in those markets. In regard to natural gas, its explosive output growth in the U.S. undercut Gazprom’s rationale for its Baltic LNG project (10 mtpa), turned the U.S. into a major (potential) LNG competitor in global LNG import markets, and, via the U.S. toll- and Henry Hub- pricing model, weakened Gazprom’s ability to insist on oil-indexed, long-term contracts. Saving Russian Energy (and Russia) through the Middle East? Putin’s moves in the Middle East could help Russia address the impact of these threats to the Russian energy industry. They potentially enhance the attractiveness of Russian crude and natural gas supplies compared to those from Saudi Arabia and its Gulf Arab allies. In the selection of crude and natural gas suppliers, security is a key consideration for importers. Wary of U.S. naval power, the Chinese, for example, prefer pipeline natural gas supplies over seaborne LNG supplies. Importers therefore must take into consideration the potential threats to transport. In this critical area, Russia enjoys a decided advantage over Saudi Arabia and the Gulf Arab producers, which depend on sea transport through the Persian Gulf and the Red Sea to ship their oil and LNG. Each of the three routes from these two bodies of water passes through a “choke point” (from the Red Sea, through the Suez Canal to Europe and through the Mandeb Strait to Asia, from the Persian Gulf through the Strait of Hormuz). By adding an airbase to their military presence in Syria, the Russians—coordinating with Iran, Syrian President Assad, and eventually possibly Iraq—would have the capability to disrupt shipments from Persian Gulf and Red Sea terminals. Russia’s export channels are less susceptible to disruption. With the exception of LNG exports to Asia from Sakhalin, Russia sends natural gas to its customers via pipeline. About 70 percent of Russia’s seaborne oil exports are susceptible to choke points (shipments from two ports on the Gulf of Finland through the Baltic Sea to the Atlantic and one port on the Black Sea through the Turkish Strait/Bosporus to the Mediterranean), while 30 percent are not (pipeline shipments to Europe and ESPO pipeline shipments to the port of Primorsk near Vladivostok). Putin’s moves also are strengthening Russia’s influence with OPEC. Russia already has extensive and close ties with Iran and Venezuela, and is now laying the basis for such ties with Iraq. Putin has aligned Russia with OPEC’s have nots–the members lacking financial resources to withstand low crude prices for an extended period and that have objected to Saudi policies (Iran, Iraq, Angola, Nigeria, Libya, Algeria, Ecuador, and Venezuela)—against the haves (Saudi Arabia, Kuwait, the UAE, and Qatar). He has continually supported Venezuelan President Maduro’s calls for an emergency OPEC meeting on prices and his efforts to persuade Saudi Arabia to reverse its policy. Most recently, in the beginning of September, Putin told Maduro that the two countries “must team up to shore up oil prices”. In addition, Russia’s deputy prime minister in charge of energy policy, Arkady Dvorkovich, in the beginning of September made comments that, in tone and substance, mocked Saudi policy, saying that “OPEC producers are suffering the ricochet effects of their attempt to flush out rivals by flooding the world with excess output,” expressing doubt that OPEC members “really want to live with low oil prices for a long time,” and implying that Saudi policy is irrational. Indeed, Russia can be seen as maneuvering to split OPEC into two blocs, with Russia, although not a member, persuading the “Russian bloc” to isolate Saudi Arabia and the Gulf Arab OPEC members within OPEC. This might persuade the Saudis to seek a compromise with the have nots. A strategic alliance with Iran and Iraq offers Putin two more potential avenues to pressure the Saudis. They can test Saudi determination to defend their market share at any price and its wherewithal financially to do so. Iran claims it can raise crude output by one million barrels within six or so months of the lifting of sanctions. The Saudis may be calculating that Iran must first rehabilitate its oil fields and that Iran, cash poor, cannot do so quickly. If this is the case, Russia could step in, offer Iran financing, and force the Saudis to contemplate prices staying lower longer than they anticipated and therefore continuing pressure on their economy. Russia also could cooperate with Iran and Iraq to take market share from Saudi Arabia in the vital Chinese market. As a recent Bloomberg article pointed out, Saudi Arabia, Iran, Russia, Iraq and other countries are vying intensely for sales to China, the second largest import market and the major source of demand growth in coming years. Coordinating their pricing and consistently offering the Chinese prices below the Saudi price, they could seek to win market share. Such a price war would pressure the competitors’ currencies. Since the Russians allow the Ruble to float, Iran maintains an informal and unofficial peg for its Rial to the US$, and Iraq has indicated it is willing to adjust its peg if necessary, while the Saudis are committed to the Riyal’s peg to the US$, Russia, Iran, and Iraq would have any advantage over Saudi Arabia. To the extent that Iran and Iraq allowed their currencies to adjust, Russian, Iranian, and Iraqi revenues in local currency terms would not decline as much as Saudi revenues fixed in US$ (and might even increase) as their currencies depreciated. Results Each of these opportunities offers the possibility to address the pressures on the Russian energy industry. However, Putin will have to play his cards carefully. Played heavy-handedly, he could intensify fears in Europe of excessive dependence on Russian energy supplies and awaken such fears in China. This could lead the Europeans and Chinese to search for other suppliers. In addition, mismanaged confrontation with the U.S. and Europe in and over Syria could lead to broadening and strengthening of economic and financial sanctions. Moreover, neither Iran nor Iraq will want to become overly dependent on Russia, which lacks the resources they need develop their energy industries. Finally, the opportunities assume Putin’s gambits in Syria and with Syria, Iran, and Iraq in intelligence and security cooperation will succeed. And this, given the Soviet experience in Afghanistan and Putin’s experience in eastern Ukraine, is far from certain. |
|||
| MOST CRITICAL TIPPING POINT ARTICLES THIS WEEK - Oct 4th, 2015 - Oct 10th, 2015 | |||
| BOND BUBBLE | 1 | ||
| RISK REVERSAL - WOULD BE MARKED BY: Slowing Momentum, Weakening Earnings, Falling Estimates | 2 | ||
| GEO-POLITICAL EVENT | 3 | ||
| CHINA BUBBLE | 4 | ||
| JAPAN - DEBT DEFLATION | 5 | ||
EU BANKING CRISIS |
6 |
||
| CREDIT CONTRACTION | 16 - Credit Contraction II | ||
GLENCORE TIMELINE
|
|||
CREDIT CONTRACTION Commodity Trading Giants Unleash Liquidity Scramble, Issue Record Amounts Of Secured DebtSubmitted by Tyler Durden on 10/06/2015 - 21:54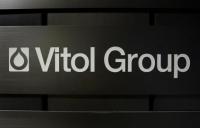
In a furious race to shore up as much liquidity as possible, Glencore - which a month ago announced a dramatic deleveraging plan - and its peers have been quietly scrambling to raise billions in secured funding. Case in point none other than Glencore's biggest competitor and the largest independent oil trader in the world, Swiss-based, Dutch-owned Vitol Group, whose Swiss unit Vitol SA earlier today raised a record $8 billion in loans. Glencore Explains What Would Happen If It Is Downgraded To JunkSubmitted by Tyler Durden on 10/06/2015 - 15:43
"In the event of a downgrade by Standard & Poor’s and/or Moody’s from current ratings to the level(s) immediately below... there are $4.5 billion of bonds outstanding, where a 125bps margin step-up would apply, in the event that the bonds were rated sub-investment grade by either major ratings agency." |
16 - Credit Contraction II | ||
Submitted by Tyler Durden on 10/06/201 Commodity Trading Giants Unleash Liquidity Scramble, Issue Record Amounts Of Secured DebtEarlier today, in its latest attempt to restore confidence in its brand and business model after suffering a historic stock price collapse, Glencore - whose CDS recently blew out to a level implying a 50% probability of default - released a 4 page funding worksheet which was meant to serve as a simplified summary of its balance sheet funding obligations and lending arrangements to equity research analysts who have never opened a bond indenture, and which among other things provided a simplified and watered-down estimate of what could happen if and when the company is downgraded to junk. Meanwhile, in a furious race to shore up as much liquidity as possible, Glencore - which a month ago announced a dramatic deleveraging plan - and its peers have been quietly scrambling to raise billions in secured funding. Case in point none other than Glencore's biggest competitor and the largest independent oil trader in the world, Swiss-based, Dutch-owned Vitol Group, whose Swiss unit Vitol SA earlier today raised a record $8 billion in loans. It is not alone. As Bloomberg reports, another name profiled previously here, privately-held (but with publicly-traded debt) Trafigura "won improved terms on a $2.2 billion loan refinancing deal on Oct. 1 via a group of 28 banks. Swiss commodity traders Gunvor Group Ltd. and Mercuria Energy Group Ltd. are also marketing credit facilities totaling $2 billion."
In short - a race against time to pledge as much unencumbered collateral as possible for future funding needs, because as every CEO knows you raise capital when you can, not when you have to. Yet this is odd, because even as the companies hold investor meetings and publicly comfort investors that they are adequatly funded and see no need for a liquidity-raising scramble, that's precisely what the world's commodity traders are doing. Bloomberg's take was more optimistic: "The transactions show banks are still eager to loan money to commodity traders even after debt concerns caused by wild swings in Glencore’s stock and bond prices."
According to Bloomberg, Vitol’s record credit facilities from a group of 57 banks were increased by a third after the initial $6 billion sought by the trading house was oversubscribed by $2.7 billion, the Rotterdam-based company said in a statement. The facilities, refinancing a debt package signed 12 months ago, are the biggest in the firm’s 49-year history, a Vitol spokeswoman in London said. Then comes even more spin:
Actually analysts (at least credit) understand the business of trading houses very well; what Bloomberg's reporters don't seems to understand, however, is the principle of muturally assured megaleverage destruction, or the implied threat for a company's secured lending syndicate that a borrower which already has billions of exposure to banks has all the leverage in demanding even more debt. After all, should Vitol fail, it would lead to a cascade of bank failures as all the banks that have lent money to the giant commodity trader are forced to charge off their exposure, in the process leading to serial defaults among undercapitalized financial institutions. It is these institutions whose credit officers underwrote the loans, that are the ones who "don't understand the business of trading houses" because based on the recent collapse in publicly traded securities, they never modelled what happens to cash flows in a world in which the price of oil, copper, zinc, aluminum or other commodities, suffer a 50%+ plunge in prices.
As they well should, and in order to avoid answering, the banks are perfectly happy to throw a little more good money after lots of bad money in order to avoid remarking their entire exposure to the sector to something resembling fair value. But the day of remarking is coming: as Bernstein calculates, commodity traders have raised at least $125 billion of debt, of which about $75 billion is loans. In other words, there is about $75 billion in secured debt, collateralized by either inventory and/or receivables collateral whose value has cratered in the past year, and as a result the LTV on the secured loans has soared. It is this that is prompting the panicked banks to be more eager to provide funds to the suddenly distressed energy-trading sector than even the borrowers themselves. And after all, if the banks do blow up, there is always the taxpayer-funded bailout as a last reserve. And here is a pop quiz to either analyst, or Bloomberg writers who don't "understand the the business of trading houses" - if you issue secured debt to shore up liquidity as a result of what is fundamentally a massively overlevered capital structure, does the pro forma debt increase or decrease. This is not a trick question. The good news for the Vitols of the world is that by pledging even more of their unencumbered assets to banks, they buy themselves a few more months, or quarters, of liquidity to pay down upcoming maturities and interest. Which is what Glencore did with its "doomsday" plan in early September... a plan which calmed the stock for all of two weeks before investors saw right through it for what it was: a desperate scramble to put lipstick on a declining-stage supercycle pig. In the meantime, the end result is this: companies that are even more levered to commodity prices in a world in which at last check commodity prices, a proxy for China's economy, are sliding. Which, incidentally, was our thesis in March of 2014 when we said that buying Glencore CDS is the best way to trade China's hard landing. This is precisely what happened. Which is why both the companies, and their lending banks, better pray that commodity prices pick up in the coming weeks and months, because for the Vitols, the Glencores, the Trafiguras, the Mercurias and so on, that is all that matters. Ironically, by levering up even more, they bought themselves some time now, but if and when the next leg down in the commodity supercycle takes place, the pain will only be that much greater.
|
|||
Submitted by Tyler Durden on 10/06/2015 - 15:43
Glencore Explains What Would Happen If It Is Downgraded To JunkAs part of its ongoing scramble to defend itself against "speculators" and concerns about its balance sheet, earlier today Glencore released a 4 page "funding worksheet" detailing all of its obligations. Among the highlights was Glencore's disclosure of total available liquidity as of this moment, which the firm reported to be materially above its June level of $10.5 billion:
It also presented its sources of funding among which the well-known $31.1 billion in bonds, as well as $20 billion in short-term funding split between a $15.25 revolver (of which a "substantial portion" is undrawn), $1.2 billion in AR/Inventory secured funding, and $3.4 billion in bilateral bank facilities. Glencore was quick to point out the gullibility of its bank lenders: "No financial covenants, no rating events of default or rating prepayment events, no material adverse change events of default or material adverse change prepayment events." Next Glencore details the terms of its notes and cross-guarantees which it lays out as follows:
Glencore also notes the $17.9 billion in Letter of Credit commitments it had outstanding as of June 30:
An interesting tangent is when Glencore discusses it readily marketable inventories:
Which brings up the very interesting question: with Glencore touting its revolver availability, and its various secured facilities, just how is Glencore marking the fair value of its inventories, because a ton of copper a year ago as collateral is worth just a little bit more than a ton of copper currently. We are confident Glencore's banks are aware of this. But finally, and most importantly, Glencore presents what it believes would happen if it is downgraded from Investment Grade to Junk. This is what it says:
Which reminds us of the waterfall analysis being shared around in the weeks before the AIG downgrade unleashed a series of events that ultimately led to the insurance company's bail out. It too presented glowing picture of the potential risks. In the end it was very deficient. One can only hope that Glencore has learned the lesson of never misrepresenting the worst case scenario. Full letter below (link) � |
|||
| TO TOP | |||
| MACRO News Items of Importance - This Week | |||
GLOBAL MACRO REPORTS & ANALYSIS |
|||
US ECONOMIC REPORTS & ANALYSIS |
|||
| CENTRAL BANKING MONETARY POLICIES, ACTIONS & ACTIVITIES | |||
| Market | |||
| TECHNICALS & MARKET |
|
||
| COMMODITY CORNER - AGRI-COMPLEX | PORTFOLIO | ||
| SECURITY-SURVEILANCE COMPLEX | PORTFOLIO | ||
| THESIS - Mondays Posts on Financial Repression & Posts on Thursday as Key Updates Occur | |||
| 2015 - FIDUCIARY FAILURE | 2015 | THESIS 2015 |  |
| 2014 - GLOBALIZATION TRAP | 2014 |  |
|
 |
|||
|
2013 2014 |
 |
||
FINANCIAL REPRESSION PAUL CRAIG ROBERTS PhD Talks About the Alarming Decline In Western Democracy FRA’s Gordon T Long talks financial repression and the decline in democracy with Paul Craig Roberts. Paul is the chairman of the institute for political economy, he was also the former assistant secretary of the US treasury for economic policy in the Reagan administration. “As far as I can tell not only has democracy departed the western world but also compassion empathy for others, morality integrity respect for truth justice fairness self-respect western civilization has become a hollow shell there is nothing left but greed and coercion and the threat of coercion”. He believes this outcome is based on the behavior and statements of the government and the public’s acceptance of it. Part of the reason the public doesn’t care, is due to a lack of information as about 90% of the American media is owned by 6 large mega corporations that manipulate the news. “The story that is told by the American media is Washington’s propaganda line and of course whatever the corporation’s propaganda line is and there is no challenge to either”. On the republican debates, Paul questions the aggressive stands that most of the candidates seemed to have towards foreign policy. He states that this stand will simply create distrust among nuclear wielding powers. “Every American president since John F Kennedy worked with the soviet leadership to diffuse the nuclear issue”. He says that this shift in culture across the candidates is a combination of both campaign finance and a shift in culture. “There’s no such thing as a free market in the United States, it requires many producers none of which can affect price…….look at the banks, the banks are so concentrated that they are too big to fail. How do you have capitalism if a failed enterprise doesn’t close down instead it is bailed out by the people or by the Federal Reserve printing money to buy its worthless portfolio. This not capitalism, there’s no capitalism here, this is an oligarchy!” “What has the government said that’s true? Think of anything, can you think of anything they’ve said that’s true? We know that the unemployment rate they’re reporting is false, inflation rate is false, and the gross domestic product is false. We know all of this, we know that Saddam Hussein did not have weapons of mass destruction, he did not have Al Qaeda connections, that Assad of Syria did not use chemical weapons. We know Russia did not invade Ukraine but they say this over and over and over. I can’t think of one thing that the government or corporate world has said in 20 years that’s true”.
|
10-05-15 | THESIS | |
2011 2012 2013 2014 |
 |
||
| THEMES - Normally a Thursday Themes Post & a Friday Flows Post | |||
I - POLITICAL |
|||
| CENTRAL PLANNING - SHIFTING ECONOMIC POWER - STATISM | THEME | ||
- - CORRUPTION & MALFEASANCE - MORAL DECAY - DESPERATION, SHORTAGES. |
THEME |  |
|
| - - SECURITY-SURVEILLANCE COMPLEX - STATISM | M | THEME | |
| - - CATALYSTS - FEAR (POLITICALLY) & GREED (FINANCIALLY) | G | THEME | |
II-ECONOMIC |
|||
| GLOBAL RISK | |||
| - GLOBAL FINANCIAL IMBALANCE - FRAGILITY, COMPLEXITY & INSTABILITY | G | THEME | |
| - - SOCIAL UNREST - INEQUALITY & A BROKEN SOCIAL CONTRACT | US | THEME | |
| - - ECHO BOOM - PERIPHERAL PROBLEM | M | THEME | |
| - -GLOBAL GROWTH & JOBS CRISIS | |||
| - - - PRODUCTIVITY PARADOX - NATURE OF WORK | THEME | MACRO w/ CHS |
|
| - - - STANDARD OF LIVING - EMPLOYMENT CRISIS, SUB-PRIME ECONOMY | US | THEME | MACRO w/ CHS |
| STANDARD OF LIVING - SUB-PRIME ECONOMY | US | THEME | MACRO w/ CHS |
Submitted by Tyler Durden on 10/07/2015
The Source Of The US Economy's Only Bright Spot: $1 Trillion In Car Loans
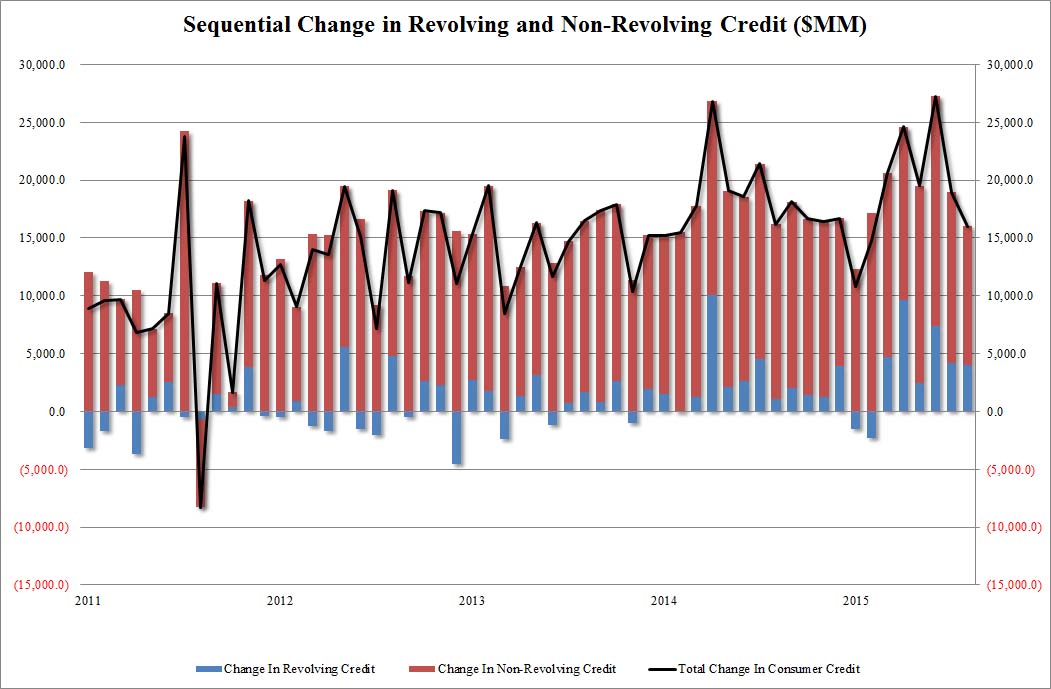
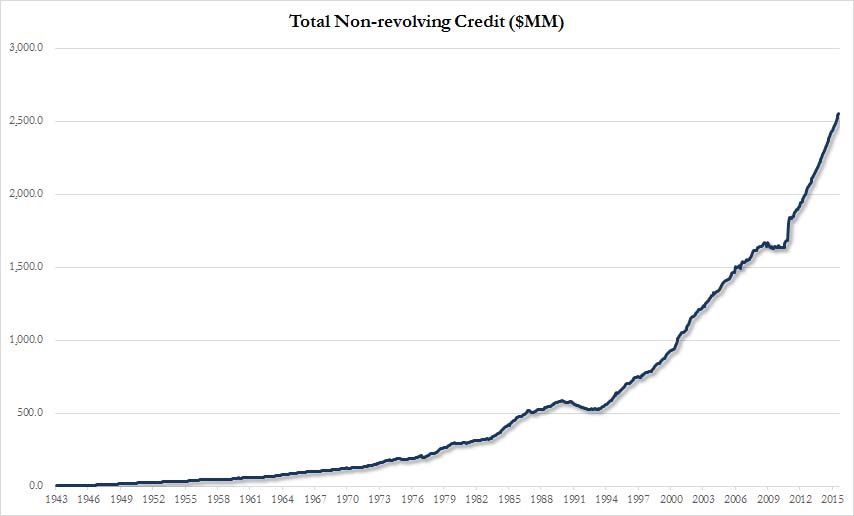
Moments ago, the Federal Reserve released the latest, August, data on consumer credit which rose by $16 billion in the month, below the $19.5 billion expected, consisting of a $4 billion increase in credit card debt, and $12 billion in non-revolving, or auto and student loans, which at a combined total of $2.55 trillion now account for 73% of total US consumer credit. The combined total monthly increase was the lowest since February on the back of a slowdown in non-revolving debt, while the increase in revolving credit was the weakest since May.
And while the headline number was uninspiring, focusing on what has been the biggest source of consumer spending in recent years, namely auto and student loans reveals the following interest charts. First, only one word can describe the chart of total non-revolving credit: parabolic.
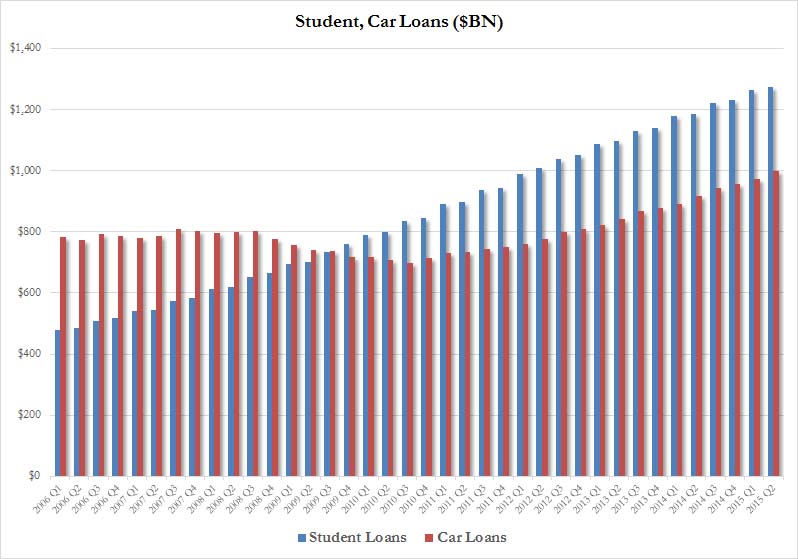
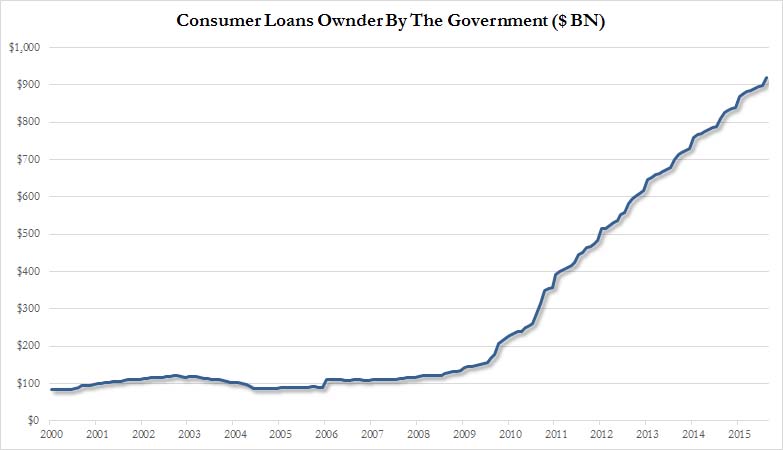
Second, while it will come as no surprise to anyone that government student loans, which surpassed $1 trillion over 3 years ago, continue soaring...
and are now funded entirely by the government...
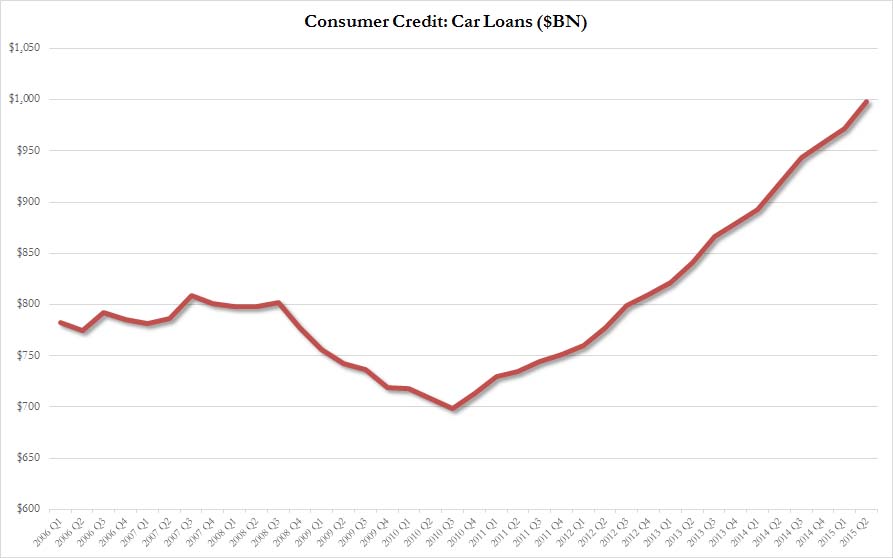
... it is auto loans where the real action is. In fact, as the following chart shows, after langushing between $70 and $800 billion in the second half of the last decade, since Q2 2010 US auto loans have been on an absolute tear, and have increased by over 40% in the past five years alone, to just shy of $1 trillion as of June 30!
This means that as of this moment both auto and student loans are well above the $1 trillion mark. It also explains why as most other parts of the US economy continue to stagnate, the US auto sector remains the only bright spot in an otherwise dreary landscape. The flipside, of course, is that once (or rather if) rates eventually rise, and banks start demanding higher interest payments for all new car loans which have become the only source of incremental buying power, that will be the day one can finally kiss the US auto golden age, propped by some $300 billion in debt (not to mention a couple of government bailouts to boot) in the past 5 years, goodbye. |
|||
III-FINANCIAL |
|||
| FLOWS -FRIDAY FLOWS | MATA RISK ON-OFF |
THEME |  |
FLOWS - Liqudity, Credit & Debt
A Liquidity Crisis Hit The Banking System In September |
10-09-15 | THEMES | |
Something occurred in the banking system in September that required a massive reverse repo operation in order to force the largest ever Treasury collateral injection into the repo market. Ordinarily the Fed might engage in routine reverse repos as a means of managing the Fed funds rate. However, as you can see from the graph below, there have been sudden spikes up in the amount of reverse repos that tend to correspond the some kind of crisis – the obvious one being the de facto collapse of the financial system in 2008: You can also see from this graph that the size of the “spike” occurrences in reverse repo operations has significantly increased since 2014 relative to the spike up in 2008. In fact, the latest two-week spike is by far the largest reverse repo operation on record. Besides using repos to manage term banking reserves in order to target the Fed funds rate, reverse repos put Treasury collateral on to bank balance sheets. We know that in 2008 there was a derivatives counter-party default melt-down. This required the Fed to “inject” Treasury collateral into the banking system which could be used as margin collateral by banks or hedge funds/financial firms holding losing derivatives positions OR to “patch up” counter-party defaults (see AIG/Goldman). What’s eerie about the pattern in the graph above is that since 2014, the “spike” occurrences have occurred more frequently and are much larger in size than the one in 2008. This would suggest that whatever is imploding behind the scenes is far worse than what occurred in 2008. What’s even more interesting is that the spike-up in reverse repos occurred at the same time – September 16 – that the stock market embarked on an 8-day cliff dive, with the S&P 500 falling 6% in that time period. You’ll note that this is around the same time that a crash in Glencore stock and bonds began. It has been suggested by analysts that a default on Glencore credit derivatives either by Glencore or by financial entities using derivatives to bet against that event would be analogous to the “Lehman moment” that triggered the 2008 collapse. The blame on the general stock market plunge was cast on the Fed’s inability to raise interest rates. However that seems to be nothing more than a clever cover story for something much more catastrophic which began to develop out sight in the general liquidity functions of the global banking system. Without a doubt, the graphs above are telling us that something “broke” in the banking system which necessitated the biggest injection of Treasury collateral in history into the global banking system by the Fed. |
|||
| CRACKUP BOOM - ASSET BUBBLE | THEME | ||
| SHADOW BANKING - LIQUIDITY / CREDIT ENGINE | M | THEME | |
| GENERAL INTEREST |
|
||
| STRATEGIC INVESTMENT INSIGHTS - Weekend Coverage | |||
|
SII | ||
|
SII | ||
|
SII | ||
|
SII | ||
| TO TOP | |||


Read More - OUR RESEARCH - Articles Below

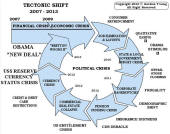
Tipping Points Life Cycle - Explained
Click on image to enlarge
TO TOP
 |
YOUR SOURCE FOR THE LATEST THINKING & RESEARCH
|
�
TO TOP