|
JOHN RUBINO'SLATEST BOOK |
||||||||||||||||||||||||||||||||||||||||||||||||||||||||||||||||||||||||||||||||||||||||||||||||||||||||||||||||||||||||||||||||||||||||||||||||||||||||||||||||||||||||||||||||||||||||||||||||||||||||||||||||||||||||||||||||||||||||||||||||||||||||||||||||||||||||||||||||||||||||||||||
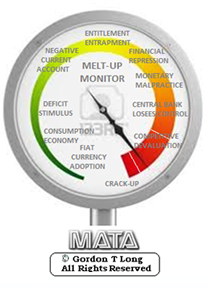
"MELT-UP MONITOR "
Meltup Monitor: FLOWS - The Currency Cartel Carry Cycle - 09 Dec 2013 Meltup Monitor: FLOWS - Liquidity, Credit & Debt - 04 Dec 2013 Meltup Monitor: Euro Pressure Going Critical - 28- Nov 2013 Meltup Monitor: A Regression-to-the-Exponential Mean Required - 25 Nov 2013
|

![]()
"DOW 20,000 "
Lance Roberts Charles Hugh Smith John Rubino Bert Dohman & Ty Andros
|

HELD OVER
Currency Wars
Euro Experiment
Sultans of Swap
Extend & Pretend
Preserve & Protect
Innovation
Showings Below
"Currency Wars "
|


"SULTANS OF SWAP" archives open ACT II ACT III
ALSO Sultans of Swap: Fearing the Gearing! Sultans of Swap: BP Potentially More Devistating than Lehman! |

"EURO EXPERIMENT"
archives open EURO EXPERIMENT : ECB's LTRO Won't Stop Collateral Contagion!
EURO EXPERIMENT: |

![]()
"INNOVATION"
archives open |

"PRESERVE & PROTE CT"
archives open |

Weekend Oct. 17th, 2015
Follow Our Updates
onTWITTER
https://twitter.com/GordonTLong
AND FOR EVEN MORE TWITTER COVERAGE
ARCHIVES
| OCTOBER | ||||||
| S | M | T | W | T | F | S |
| 1 | 2 | 3 | ||||
| 4 | 5 | 6 | 7 | 8 | 9 | 10 |
| 11 | 12 | 13 | 14 | 15 | 16 | 17 |
| 18 | 19 | 20 | 21 | 22 | 23 | 24 |
| 25 | 26 | 27 | 28 | 29 | 30 | 31 |
KEY TO TIPPING POINTS |
| 1- Bond Bubble |
| 2 - Risk Reversal |
| 3 - Geo-Political Event |
| 4 - China Hard Landing |
| 5 - Japan Debt Deflation Spiral |
| 6- EU Banking Crisis |
| 7- Sovereign Debt Crisis |
| 8 - Shrinking Revenue Growth Rate |
| 9 - Chronic Unemployment |
| 10 - US Stock Market Valuations |
| 11 - Global Governance Failure |
| 12 - Chronic Global Fiscal ImBalances |
| 13 - Growing Social Unrest |
| 14 - Residential Real Estate - Phase II |
| 15 - Commercial Real Estate |
| 16 - Credit Contraction II |
| 17- State & Local Government |
| 18 - Slowing Retail & Consumer Sales |
| 19 - US Reserve Currency |
| 20 - US Dollar Weakness |
| 21 - Financial Crisis Programs Expiration |
| 22 - US Banking Crisis II |
| 23 - China - Japan Regional Conflict |
| 24 - Corruption |
| 25 - Public Sentiment & Confidence |
| 26 - Food Price Pressures |
| 27 - Global Output Gap |
| 28 - Pension - Entitlement Crisis |
| 29 - Central & Eastern Europe |
| 30 - Terrorist Event |
| 31 - Pandemic / Epidemic |
| 32 - Rising Inflation Pressures & Interest Pressures |
| 33 - Resource Shortage |
| 34 - Cyber Attack or Complexity Failure |
| 35 - Corporate Bankruptcies |
| 36 - Iran Nuclear Threat |
| 37- Finance & Insurance Balance Sheet Write-Offs |
| 38- Government Backstop Insurance |
| 39 - Oil Price Pressures |
| 40 - Natural Physical Disaster |
Reading the right books?
No Time?
We have analyzed & included
these in our latest research papers Macro videos!
OUR MACRO ANALYTIC
CO-HOSTS
John Rubino's Just Released Book
Charles Hugh Smith's Latest Books


Our Macro Watch Partner
Richard Duncan Latest Books
MACRO ANALYTIC
GUESTS
F William Engdahl


OTHERS OF NOTE
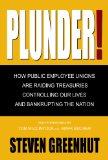
Book Review- Five Thumbs Up
for Steve Greenhut's Plunder!


![]()
TODAY'S TIPPING POINTS
|
Have your own site? Offer free content to your visitors with TRIGGER$ Public Edition!
Sell TRIGGER$ from your site and grow a monthly recurring income!
Contact [email protected] for more information - (free ad space for participating affiliates).
HOTTEST TIPPING POINTS |
Theme Groupings |
||
We post throughout the day as we do our Investment Research for: LONGWave - UnderTheLens - Macro
|
|||
|
MOST CRITICAL TIPPING POINT ARTICLES TODAY
|
|
||
 |
|||
|
|
SII | ||
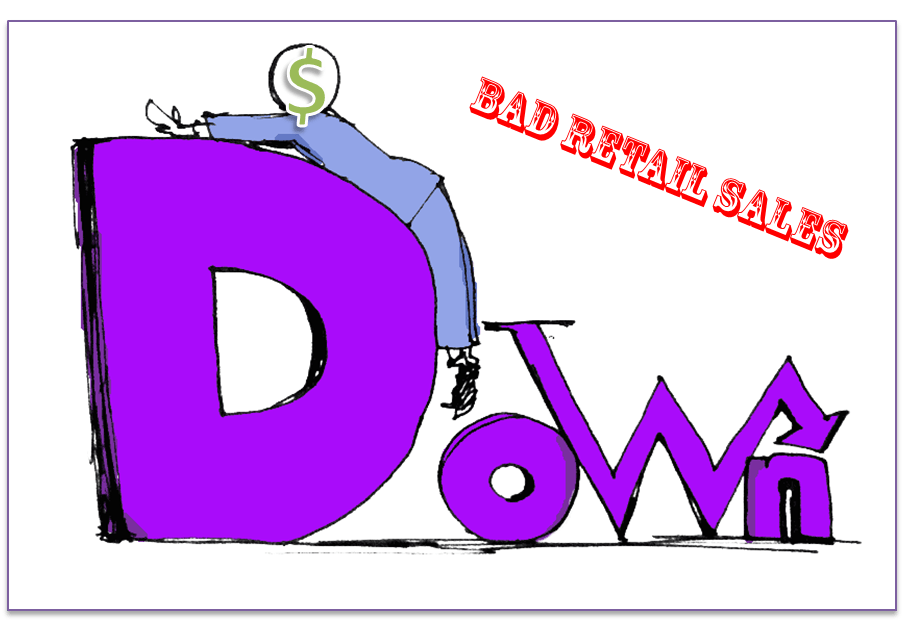
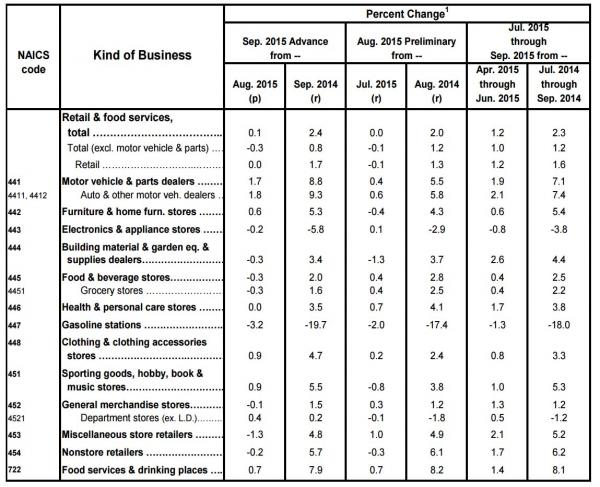
IGNORE THE MEDIA BULLSH*T – RETAIL IMPLOSION PROVES WE ARE IN RECESSION
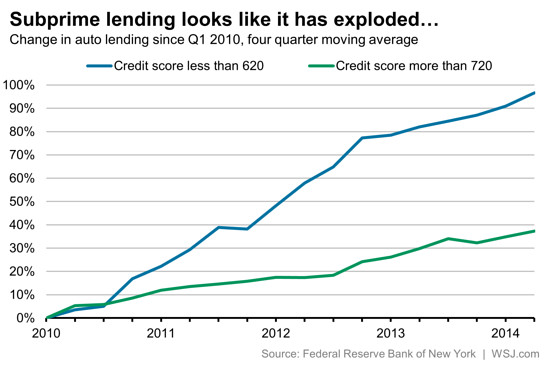
Here we go again. The dying legacy media will continue to support the status quo, who provide their dwindling advertising revenue, by papering over the truth with platitudes, lies, and misinformation. I have been detailing the long slow death of retail in America for the last few years. The data and facts are unequivocal. Therefore, the establishment and their media mouthpieces need to suppress the truth. They spin every terrible report in the most positive way possible. They blame lousy retail results on the weather. They blame them on calendar effects. They blame them on gasoline sales plunging. That one is funny, because we heard for months that retail spending would surge because people had more money in their pockets from the huge decline in gasoline prices. September retail sales were grudgingly reported by the Census Bureau this morning and they were absolutely dreadful. This followed an atrocious August report. The MSM couldn’t blame it on snow, cold, flooding, drought, or even swarms of locusts. So they just buried the story in their small print headlines. The propaganda media machine had nothing. They continue to spew the drivel about a 5.1% unemployment rate as a reflection of a booming jobs market. If we really have a booming jobs market, we would have a booming retail sector. The stagnant retail market reveals the jobs data to be fraudulent. The 94 million people supposedly not in the job market can’t buy shit with their good looks. Despite the storyline about consumer austerity being the reason for sluggish spending, the facts prove otherwise. Consumer spending accounted for 68% of GDP in 2008 at the peak. Seven years later it still represents 68% of GDP. The difference is the spending has shifted dramatically towards services since the Wall Street created financial crisis. Spending on services has grown by 31% versus 20% for goods since 2008. Guess what has caused that surge? OBAMACARE Spending on healthcare has skyrocketed for the average person. Rent, taxes, utilities and educational expenses have all exploded higher. Meanwhile, real median household incomes are 7% lower than they were in 2008. They are 7% lower than they were in 2000 and equal to the level of 1989. And the bubble headed bimbos on CNBC can’t understand why retail sales aren’t booming? Did they get their journalism degrees from the University of Phoenix or Trump University? Let’s dig into the data for some shits and giggles. First off, you need to realize how bad it really is when you consider US automakers are essentially giving away vehicles to anyone who can fog a mirror, as long as they are willing to obligate themselves into never ending debt enslavement. The average amount financed of $27,000 and the average length of loan of 65 months are both record highs. As the automakers get more desperate by the day, 7 year 0% loans are now becoming the norm. Dealer incentives in the thousands proliferate. And subprime auto loans now constitute over 20% of all sales. The pace of subprime auto loans has more than doubled the pace of prime loans since 2010.
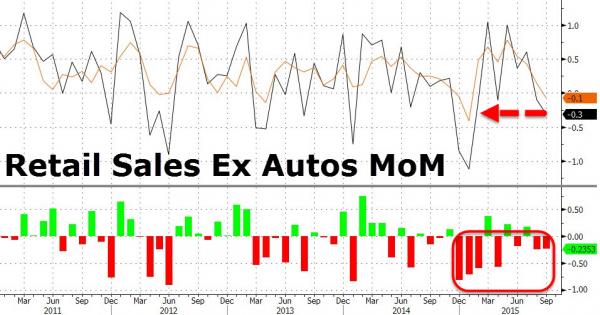
The Fed, Treasury and Wall Street decided auto sales would be the tonic to cure our economic ills, so they opened up the debt floodgate to get everyone and anyone into a new vehicle. They needed booming auto sales to provide the appearance of economic recovery. So, while overall consumer expenditures increased by 21% since 2010, auto loan debt grew by an astounding 41%. An this is just the debt side of the equation. Over 27% of all vehicle “sales” are actually leases. Calling a three year rental a car sale stretches the concept of sale to the limits. Anyone who finances a car over seven years or leases a car, can never escape the chains of monthly payment debt. They will always be underwater, just the way Wall Street likes it. The proof these “strong” auto sales are just another debt based scheme are the non-existent profits of automakers and stock prices at 2010 levels. If auto sales are so healthy why would GM stock be down 18% since 2013 and Ford stock down 14% in the last year? If you strip out the debt financed auto bonanza, retail sales are pitiful on a monthly and annual basis. I thought the later Labor Day was the reason for poor August sales. Maybe kids didn’t go back to school this year. The categories with NEGATIVE monthly sales was immense: Electronics & appliances (what about that housing boom), Building materials & garden equipment, Food & beverage, Gasoline stations, General Merchandise (Wal-Mart), Misc stores, Nonstore (Amazon). Overall, retail sales excluding autos was down 0.3% over the prior month. August sales were down 0.1% over July. The news just gets worse and worse as the government reports lower and lower unemployment. A fascinating dichotomy.
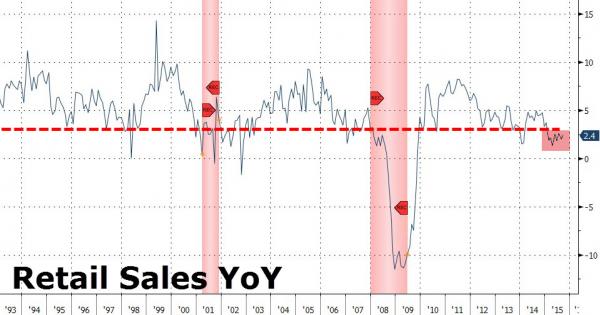
The annual and year to date figures are even more disturbing. The annualized and year to date numbers show 0.8% to 1.2% increases. If you believe your government that there is no inflation (Social Security recipients will get a 0% increase in their benefits next year – should do wonders for retail sales), then those pitiful increases are valid. If you live in the real world where your costs to live are going up by 5% or more, real retail sales are negative. The way to figure out who is lying is to look at the profits of retailers. They are plunging, so shockingly the government is lying about inflation. Retail sales have missed the expectations of highly paid Wall Street economists 7 out of the last 10 months and 10 out of the last 15 months. But they guarantee sales will be strong next month. Maybe they should double seasonally adjust retail sales like they did GDP because it gets cold in the winter. How could the retail sales be so pitiful when the unemployment rate has fallen from 8.9% to 5.1% over the same time frame? Maybe someone could ask Obama at his next press conference.
The fact of the matter is that year over year retail sales at these levels only happen during recessions. It’s really that simple. Without the crutch of subprime auto loans and student loan debt being spent by pretend University of Phoenix students on iGadgets, fitbits, hookers and blow, this economy would already be in free fall.
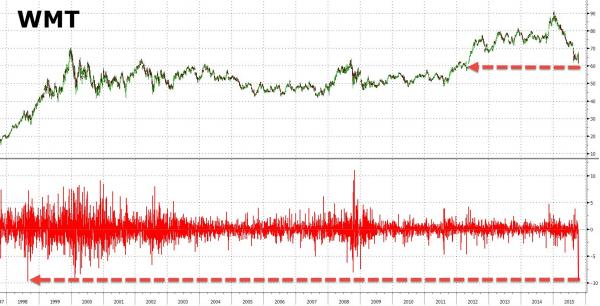
Look no further than what happened to Wal-Mart today for confirmation we are in the midst of a worldwide recession, if not depression. Their stock fell by 10%, the largest one day loss in their history as a public company. Their stock is down 30% this year.
Make no mistake about it, Wal-Mart is a global retailer whose annual sales dwarf the GDP of most of the countries on the planet. They announced flat revenue for the current year and slashed next year’s earnings expectations by 12%. As usual, they blame external factors for their failures. The strong dollar seems to be the excuse de jour among the multi-national corporations who rule the globe. If they didn’t want to deal with currency risk, they shouldn’t have gone global. It’s a cost of doing business, not an excuse. I found it amusing that Marketwatch had their headline as Wal-Mart to Buyback $20 Billion of Stock, rather than reporting that Wal-Mart’s profits are crashing by billions. The propaganda machine just doing their job. Every clueless highly educated CEO of floundering corporate behemoths follows the exact same game plan. Borrow money as your profits are in decline to buyback your stock near record highs to give the appearance that EPS is growing. If you can’t make profits, fake them. At least the executives will get their million dollar bonuses while announcing more layoffs. That always delights Wall Street. All economic indicators are flashing red and warning of recession. Retail sales, that account for two thirds of economic activity, are falling. Corporate profits are plunging. Middle class Americans haven’t seen their household income rise since 1989. The last two employment reports were horrific. The number of job layoff announcements by corporations is up 36% year to date and has already exceeded the total for 2014. The only people who refuse to acknowledge recession reality are the Wall Street hucksters, looking to fleece a few more muppets before their party is over. They’ve created a short covering rally, despite the awful economic news, ridiculously high valuations, record levels of margin debt, and a public who left the markets years ago. Rigging the markets, utilizing free money from the Fed, producing fake profits through government sanctioned accounting fraud and using high frequency trading machines to manipulate the market can only get you so far. Propaganda and lies can’t stop this recession. The Fed never took their foot off the gas, so we are headed for the cliff at 100 miles per hour. I wonder what happens next.
|
|||
| MOST CRITICAL TIPPING POINT ARTICLES THIS WEEK - Oct 11th, 2015 - Oct 17th, 2015 | |||
| BOND BUBBLE | 1 | ||
| RISK REVERSAL - WOULD BE MARKED BY: Slowing Momentum, Weakening Earnings, Falling Estimates | 2 | ||
| GEO-POLITICAL EVENT | 3 | ||
| CHINA BUBBLE | 4 | ||
| JAPAN - DEBT DEFLATION | 5 | ||
EU BANKING CRISIS |
6 |
||
9 - CHRONIC UNEMPLOYMENT |
10-15-15 | US CATALYST
|
9 - Chronic Unemployment |
"A Generation In Crisis" - The World Needs 5 Million Jobs/Month To Stymie Youth ExtremismThe global economy will need to create 600 million jobs over the next 10 years: that’s 5 million jobs each month simply to keep employment rates constant. For over 3 years we have pointed out that the surging youth unemployment was Europe's (if not the world's) scariest chart, because the last thing Europe needs is a discontented, disenfranchised, and devoid of hope youth roving the streets with nothing to do, easily susceptible to extremist and xenophobic tendencies: after all, it must be "someone's" fault that there are no job opportunities for anyone. Well, as Bloomberg reports, The World Bank has an unsettling message for young people around the globe: unless we create 5 million jobs a month, the situation is going to get worse. As The World Bank notes, Unemployment in any form is a drag on an economy and society.
In other words, even with that 'growth' we are going nowhere!!
* * * Full World Bank Report below... �
|
|||
US BANKING CRISIS II |
22 - US Banking Crisis II |
||
Bloomberg Briewf 10-12-15 Having bailed them out and then helped to repair their balance sheets with record-low interest rates and bond-buying, policy makers may assist the financial industry once more when the U.S. Federal Reserve begins tightening monetary policy. That’s according to two recently published reports by the Bank for International Settlements and McKinsey & Co., both of which have highlighted the downsides of ultra-easy borrowing costs in the past. Based on seven years of data from 109 large international banks in 14 countries, the BIS confirmed a relationship between short-term rates and the slope of the curve for bond yields with bank profitability. The conclusion drawn by Claudio Borio, the head of the monetary and economic department at the BIS, and colleagues is that the positive impact of being able to earn income by lending money out for higher rates over time is bigger than the hit of defaults and income that doesn’t carry interest. Even better news for the banks is that the effect is strongest when rates are lower and the yield curve isn’t that steep, as is now the case. That provides another reason for the BIS’s economists to again decry the unintended side-effects of accommodative monetary policy. They reckon that between 2011 and 2014, the average bank of those studied lost one year of profits as a result of low rates. “All this suggests that over time, unusually low interest rates and an unusually flat term structure erode bank profitability,” said Borio, Leonardo Gambacorta and Boris Hofmann in the report, which was published on Oct. 1. Return on equity at 500 global lenders was unchanged in 2014 at 9.5 percent, about the average of the last 35 years, according to the Sept. 30 study by McKinsey. Profit margins also continued a steady decline, dropping by 185 basis points in 2014, in part because of lower rates. It reckons tighter policy would boost return on equity by about 2 percentage points. “Many in the industry are waiting for an interest rate rise or some other structural lift to profits,” McKinsey said. There is a sting in the tale. It warned that even if rates do rise, profit margins may still not return to their pre-crisis highs. “Much of the benefit will get competed away, and risk-costs will likely increase, especially in economies where the recovery is still fragile,” McKinsey said. |
|||
| TO TOP | |||
| MACRO News Items of Importance - This Week | |||
GLOBAL MACRO REPORTS & ANALYSIS |
|||
US ECONOMIC REPORTS & ANALYSIS |
|||
| CENTRAL BANKING MONETARY POLICIES, ACTIONS & ACTIVITIES | |||
| Market | |||
| TECHNICALS & MARKET |
|
||
| Market | |||
| TECHNICALS & MARKET | 10-14-15 |
STUDY | 1- Bond Bubble |
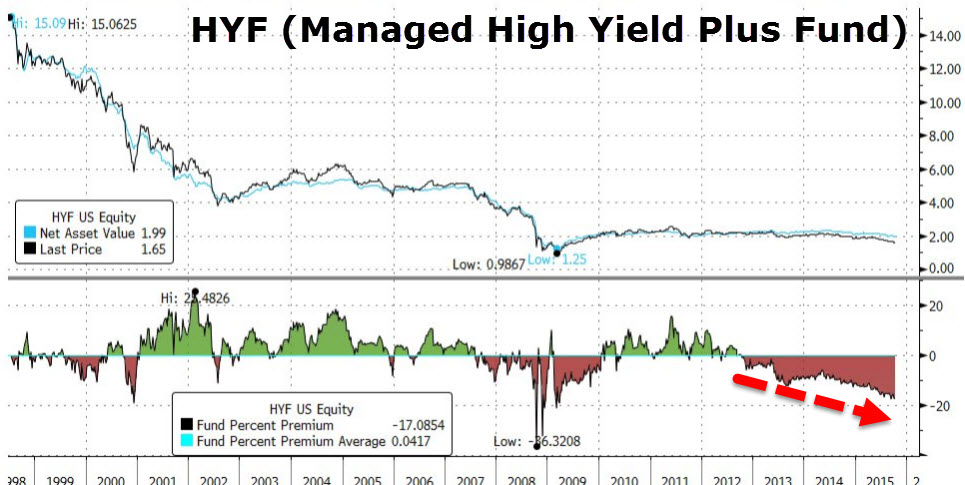
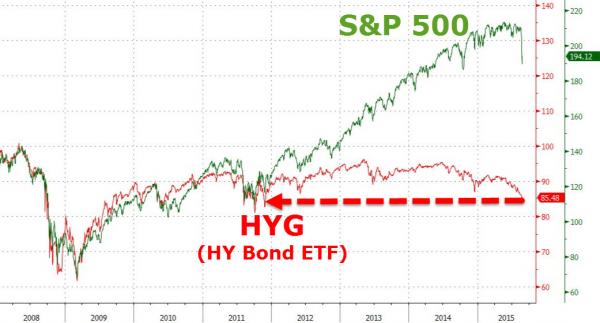
It Begins - Managed High Yield Bond Fund Liquidates After 17 YearsPosted:Wed, 14 Oct 2015 01:30:00 GMTSince inception in June 1998, UBS' Managed High Yield Plus Fund survived through the dot-com (and Telco) collapse and the post-Lehman credit carnage but, based on the press release today, has been felled by the current credit cycle's crash. After 3 years of trading at an increasingly large discount to NAV, and plunging to its worst levels since the peak of the financial crisis, the board of the Fund has approved a proposal to liquidate the Fund. While timing is unclear, this is the worst case for an increasingly fragile cash bond market as BWICs galore are set to hit with "liquidty thin to zero." Having survived 17 years...
It's Over... (as The Fund Statement reads):
* * *
In Treasury markets, traders have turned to futures to mitigate illiquidty...
...while corporate bond fund managers utilize ETFs and other portfolio products to avoid trading the underlying assets...
With the stage thus set, Bloomberg has more on the move to smaller trades and cash market substitutes:
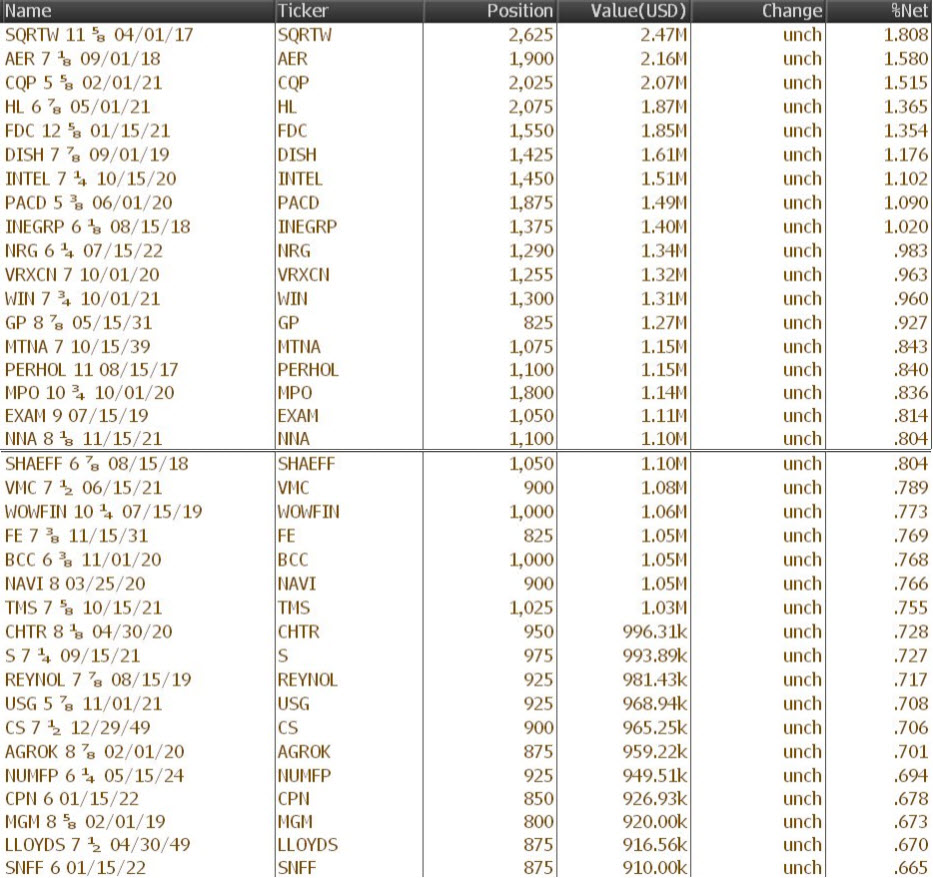
The conundrum here is that the more reluctant market participants are to venture into increasingly illiquid cash markets, the more illiquid those markets become. And here are the fund's largest holdings...
* * * Of course, this should not be a total surprise, in light of the near-record up/downgrade ratio...
Deteriorating fundamentals... U.S. companies have increased borrowing to levels exceeding those just before the financial crisis, as firms pursue big acquisitions and seek to boost stock prices by buying back shares. According to one metric, the ratio of debt to earnings before interest, taxes, depreciation and amortization for companies that carry investment-grade ratings, meaning triple-B-minus or above, was 2.29 times in the second quarter. That’s higher than the 1.91 times in June 2007, just before the crisis, according to figures from Morgan Stanley.
* * * And as we noted earlier, the credit cycle has well and truly rolled over...
And no lesser market veteran than Art Cashin is concerned, What are the signals you are looking for to stay on top in such a market? I continue to monitor the high yield market and see where that goes. The high yield market has been of some concern of the last several weeks. If that begins to show appreciable weakness than I would think the caution flags stay up.
Charts: Bloomberg
|
|||
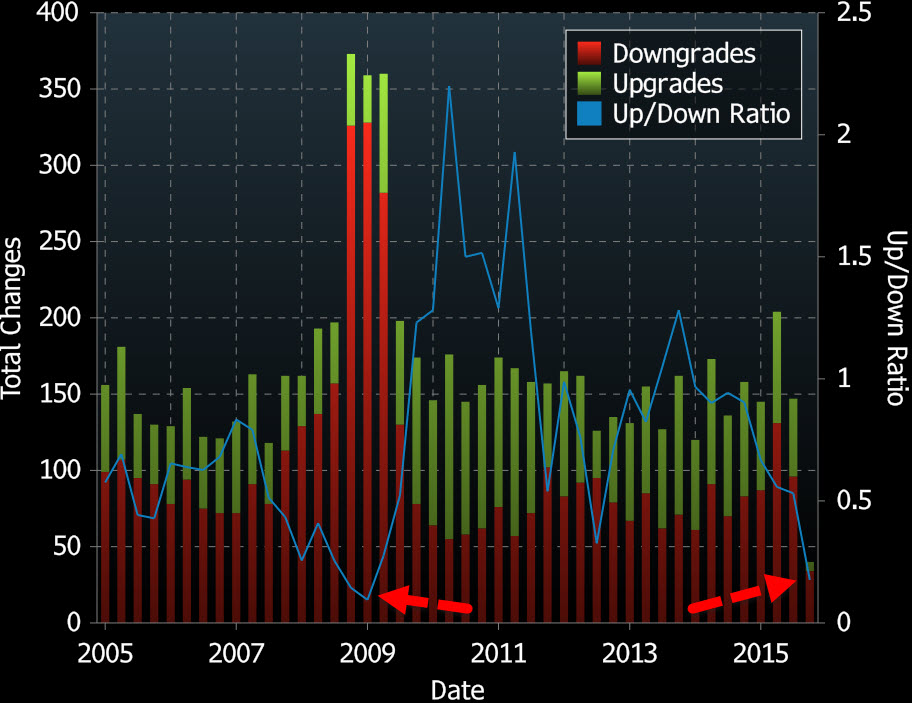
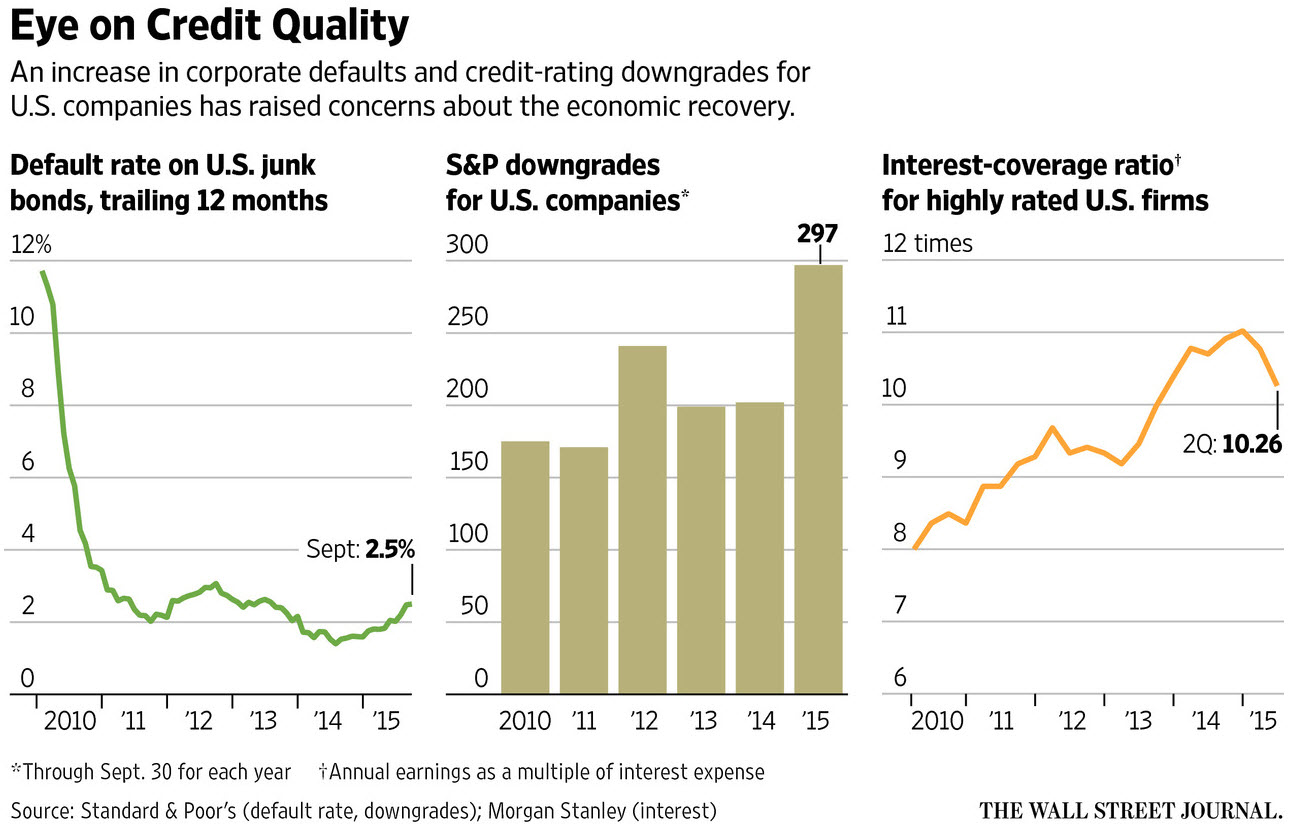
Bond Market Breaking Bad - Credit Downgrades Highest Since 2009Posted:Tue, 13 Oct 2015Despite The Fed's best efforts to crush the business cycle, the crucial credit-cycle has reared its ugly headas releveraging firms (gotta fund those buybacks) and deflationary pressures (liabilities fixed, assets tumble) have led to a surging market cost of capital. As WSJ reports, softening U.S. corporate fundamentals have been largely overlooked but the markets for riskier debt have become snarled with rising downgrades and an increase in U.S. corporate defaults indicate “some cracks on the surface” of the domestic-growth outlook. In fact, in the latest quarter, theratio of upgrades-to-downgrades is its weakest since the peak of the financial crisis in 2009.
U.S. companies have increased borrowing to levels exceeding those just before the financial crisis, as firms pursue big acquisitions and seek to boost stock prices by buying back shares. According to one metric, the ratio of debt to earnings before interest, taxes, depreciation and amortization for companies that carry investment-grade ratings, meaning triple-B-minus or above, was 2.29 times in the second quarter. That’s higher than the 1.91 times in June 2007, just before the crisis, according to figures from Morgan Stanley.
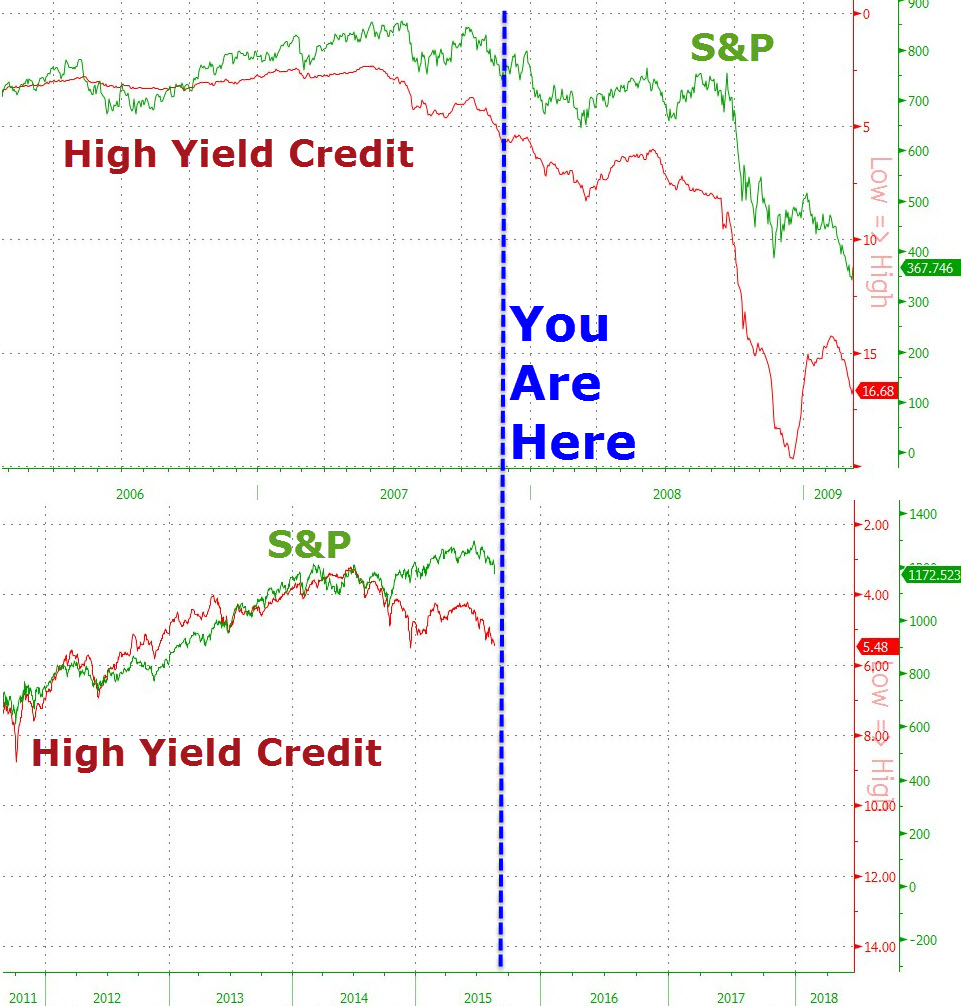
* * * You Are Here...
|
|||
| COMMODITY CORNER - AGRI-COMPLEX | PORTFOLIO | ||
| SECURITY-SURVEILANCE COMPLEX | PORTFOLIO | ||
| THESIS - Mondays Posts on Financial Repression & Posts on Thursday as Key Updates Occur | |||
| 2015 - FIDUCIARY FAILURE | 2015 | THESIS 2015 |  |
| 2014 - GLOBALIZATION TRAP | 2014 |  |
|
 |
|||
|
2013 2014 |
 |
||
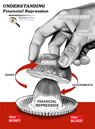
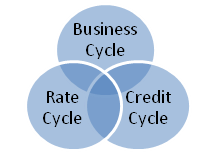
FINANCIAL REPRESSION JEFF DAVIS Talks FINANCIAL REPRESSION & THE EFFECTS ON THE US BANKING SECTOR FRA Co-Founder Gordon T. Long interviews Jeff Davis of Mercer Capital, and discusses financial repression and its effects on the banking sector. Davis is currently a Managing Director of Financial Institutions Group at Mercer Capital. Davis also provides financial advisory services primarily related to the valuation of privately-held equity and debt issued by financial services companies and advisory related to capital structures and M&A. FINANCIAL REPRESSION’S EFFECT ON THE US BANKING SECTOR “Financial repression is a price control that relates to all facets of the economy and has profound impact.” The 3 major cycles: Business Cycle, Credit Cycle and Rate Cycle.
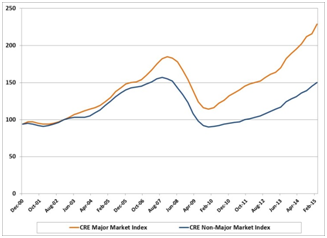
“The banks straddle all 3 to be a key contributor of capital in the US economy. Financial repression impacts at a very base level for all 3 cycles.” “Financial repression has artificially pumped up asset value. “Commercial real estate values really pivoted in 2010. There is additional risk in the system now that asset values are pumped up” Commercial Real Estate Values
Leverage Ratio “If you look at the leverage ratio we can see that over the last 20 years the industry has been raising capital. I don’t think that’s a bad thing. We are significantly much better capitalized than Europe which is a good thing, but as it relates to an investor there is a lower return on equity.” “Regarding financial repression, if you think about interest rates today, it is very painful for an institution to hold cash. There is significant risk taking occurring amongst commercial banks in taking additional credit risk and duration risk. Structurally banks aren’t as spread in terms of their assets relative to their borrowings that fund these assets.” “Companies don’t go broke because they don’t make money. Companies go broke when they have no liquidity, so what financial repression has done is push liquidity into the system. So now heavily indebted companies are able to borrow money and we will soon see the consequences of that.” HOW BANKS FUNCTION “The banks are special for being separated from commerce.” SHADOW BANKING “Over the last several decades the shadow banking system has developed into an alternative lender as well as another place for people to put their money.” The term “shadow bank” was coined by economist Paul McCulley in a 2007 speech at the annual financial symposium hosted by the Kansas City Federal Reserve Bank in Jackson Hole, Wyoming. In McCulley’s talk, shadow banking referred mainly to nonbank financial institutions that engaged in what economists call maturity transformation. Commercial banks engage in maturity transformation when they use deposits, which are normally short term, to fund loans that are longer term. Shadow banks do something similar. “Shadow banking system is separate from commercial banking system, but is a very large piece of the credit allocator. A lot of risk has been pushed out of commercial banks and is now in the shadow banking system, where it is not as opaque as a commercial bank.” CONCERNS WITH SUSTAINED LOW INTEREST RATES One day there will be a reckoning. It’s simply a buildup of risk; an attempt by central authorities to guide the economy. Malinvestment: A mistaken investment in wrong lines of production, which inevitably lead to wasted capital and economic losses, subsequently requiring the reallocation of resources to more productive uses. “A delay of lost recognition and mass malinvestment which is all a credit risk within the banking systems. However, my biggest concern is a dramatic slowdown in the economy, short rates at zero.”
|
10-12-15 | THESIS | |
2011 2012 2013 2014 |
 |
||
| THEMES - Normally a Thursday Themes Post & a Friday Flows Post | |||
I - POLITICAL |
|||
| CENTRAL PLANNING - SHIFTING ECONOMIC POWER - STATISM | THEME | ||
- - CORRUPTION & MALFEASANCE - MORAL DECAY - DESPERATION, SHORTAGES. |
THEME |  |
|
| - - SECURITY-SURVEILLANCE COMPLEX - STATISM | M | THEME | |
| - - CATALYSTS - FEAR (POLITICALLY) & GREED (FINANCIALLY) | G | THEME | |
II-ECONOMIC |
|||
| GLOBAL RISK | |||
| - GLOBAL FINANCIAL IMBALANCE - FRAGILITY, COMPLEXITY & INSTABILITY | G | THEME | |
| - - SOCIAL UNREST - INEQUALITY & A BROKEN SOCIAL CONTRACT | US | THEME | |
| - - ECHO BOOM - PERIPHERAL PROBLEM | M | THEME | |
| - -GLOBAL GROWTH & JOBS CRISIS | |||
| - - - PRODUCTIVITY PARADOX - NATURE OF WORK | THEME | MACRO w/ CHS |
|
| - - - STANDARD OF LIVING - EMPLOYMENT CRISIS, SUB-PRIME ECONOMY | US | THEME | MACRO w/ CHS |
| STANDARD OF LIVING - SUB-PRIME ECONOMY | US | THEME | MACRO w/ CHS |
III-FINANCIAL |
|||
| FLOWS -FRIDAY FLOWS | MATA RISK ON-OFF |
THEME |  |
FLOWS - Liquidity, Credit & Debt |
10-16-15 | THEMES |
|
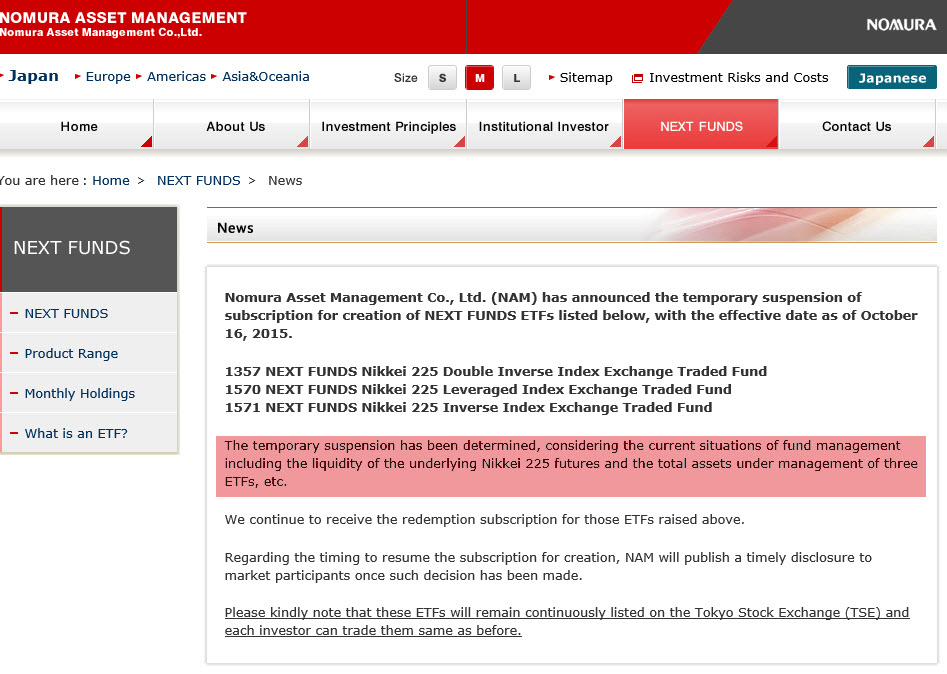
World's Largest Leveraged ETF Halts Orders, Citing "Liquidity Constraints"First The Bank of Japan destroyed the Japanese bond market, and then, back in May we warned that The Bank of Japan had 'broken' the stock market. Now, it appears the all too obvious consequences of being the sole provider of buying power in an antirely false market are coming home to roost as Nomura reports the "temporary suspension" of new orders for 3 leveraged ETFs - the largest in the world - citing "liquidity of the underlying Nikkei 225 futures market."
As Bloomberg reported previously on Nomura's funds,
Who could have seen this coming? Well we did... numerous times...and here is the explanation...
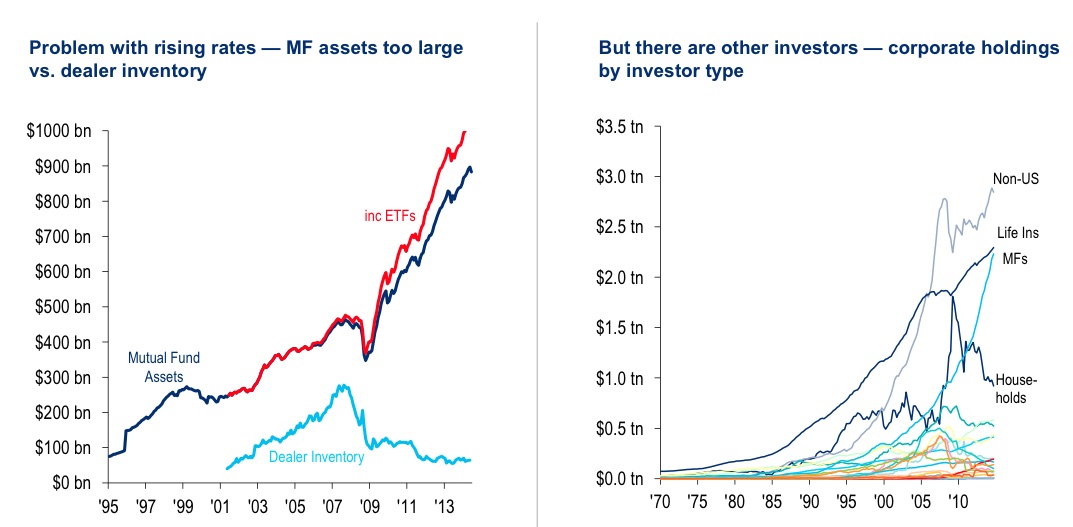
All of the above can be summarized as follows. "MF assets too large versus dealer inventories" (via Citi)...
... clear evidence of "structural damage in corporate bond trading liquidity" (via JP Morgan)...
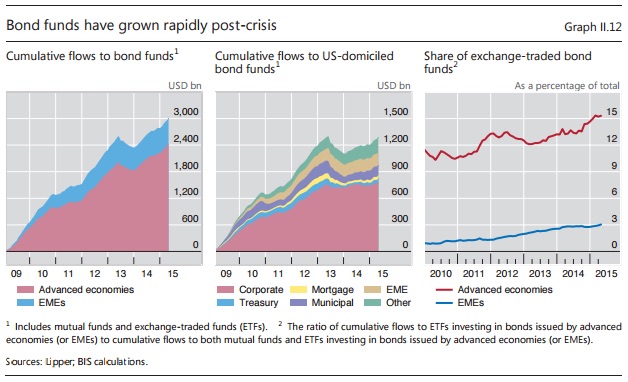
... and the rapid growth of bond funds in the post-crisis world (via BIS)...
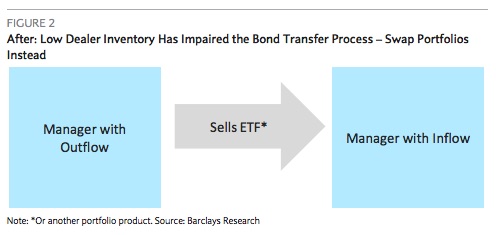
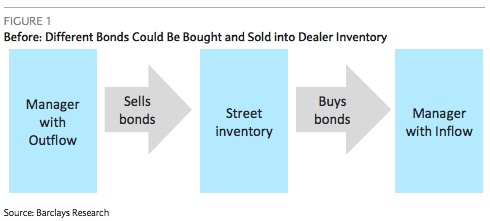
So given the above, the question is this: if something were to spook the market - a rate hike cycle for instance, or an October revolver raid on HY energy names, or an exogenous geopolitical shock - causing an exodus from these funds, what would happen to prices if fund managers were suddenly forced to transact in size in an illiquid secondary market in order to meet redemptions? "Nothing good", is the answer. The solution is to avoid selling the underlying bonds - even when investors are selling their shares in the funds. But how is this possible? To a certain extent, outflows in one fund can be offset by inflows to another. These "diversifiable flows" are one happy byproduct of the great ETF proliferation. Here's a refresher on how this works courtesy of Barclays. * * * Portfolio Products Replace Dealer Inventory While diversifiable flows limit the risks to portfolio managers in principle, the reality of the high yield market is more complicated. Managers have specific views on tenor, callability, sectors, covenants, and, most importantly, individual credits, such that actually finding buyers for specific bonds can be quite difficult. In the pre-crisis period, dealers ran large inventories that effectively facilitated the netting of flows across funds (Figure 1). A fund with an outflow would sell bonds into the dealer community, and funds with outflows would buy bonds out of the dealer inventory. When inventory is large, the fact that the specific bonds bought and sold did not match was largely irrelevant. Funds with outflows could sell the bonds of their choice, and the funds with inflows could pick investments from the large variety of inventory held by dealers.
The matching problem has become more acute as dealer inventories have declined. Even funds can net flows in principle, dealers are much less willing to warehouse bonds, and are much more likely to buy only when they believe they can quickly offload the risk. Under this scenario, the fact that flows can theoretically be netted is of little practical use to fund managers – actually netting individual bonds is extremely difficult, particularly in the short time frame required by funds offering daily liquidity to end investors. This is where portfolio products come in. Investors can use portfolio products to fund outflows/invest inflows immediately and execute the necessary single-name bond trades over time as liquidity in the underlying bond market allows (Figure 2). In this scenario, funds with inflows and outflows simply exchange portfolio products, sidestepping the immediate need to trade single-name corporate bonds.
* * * Ok great, so ETFs provide a kind of "phantom" liquidity if you will. There are two problems with this:
Here's how we put it last month in "How Fund Managers Use ETF Phantom Liquidity To Avert A Meltdown"
So what is a fund manager to do?
In closing, it's important to note that no fund manager in the world will be able to line up enough emergency liquidity protection to avoid tapping the corporate credit market in the event of panic selling in the increasingly crowded market for bond funds. In other words, when the exodus comes, the illiquidity that's been chasing markets for the better part of seven years will finally catch up, and at that point, all bets are officially off. * * * At the end of the day, one is reminded of what Howard Marks' recently said about ETFs:
We are about to get the real-life answer to Howard Marks' more critical question: "What happens when ETF Holders all sell at once?" |
|||
| CRACKUP BOOM - ASSET BUBBLE | THEME | ||
| SHADOW BANKING - LIQUIDITY / CREDIT ENGINE | M | THEME | |
| GENERAL INTEREST |
|
||
| STRATEGIC INVESTMENT INSIGHTS - Weekend Coverage | |||
|
SII | ||
|
SII | ||
|
SII | ||
|
SII | ||
| TO TOP | |||
Read More - OUR RESEARCH - Articles Below

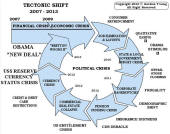
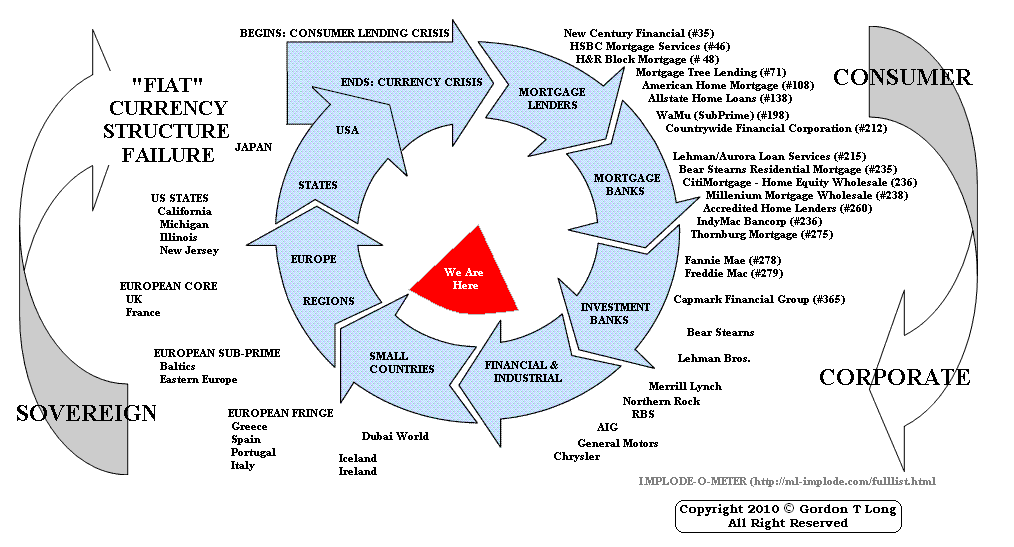
Tipping Points Life Cycle - Explained
Click on image to enlarge
TO TOP
 |
YOUR SOURCE FOR THE LATEST THINKING & RESEARCH
|
�
TO TOP