|
JOHN RUBINO'SLATEST BOOK |
||||||||||||||||||||||||||||||||||||||||||||||||||||||||||||||||||||||||||||||||||||||||||||||||||||||||||||||||||||||||||||||||||||||||||||||||||||||||||||||||||||||||||||||||||||||||||||||||||||||||||||||||||||||||||||||||||||||||||||||||||||||||||||||||||||||||||||||||||||||||||||||||||||||||||||||||||||||||||||||||||||||||||||||||||||||
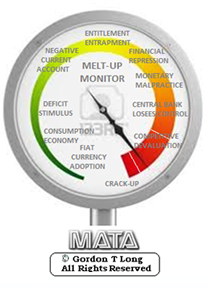
"MELT-UP MONITOR "
Meltup Monitor: FLOWS - The Currency Cartel Carry Cycle - 09 Dec 2013 Meltup Monitor: FLOWS - Liquidity, Credit & Debt - 04 Dec 2013 Meltup Monitor: Euro Pressure Going Critical - 28- Nov 2013 Meltup Monitor: A Regression-to-the-Exponential Mean Required - 25 Nov 2013
|

![]()
"DOW 20,000 "
Lance Roberts Charles Hugh Smith John Rubino Bert Dohman & Ty Andros
|

HELD OVER
Currency Wars
Euro Experiment
Sultans of Swap
Extend & Pretend
Preserve & Protect
Innovation
Showings Below
"Currency Wars "
|


"SULTANS OF SWAP" archives open ACT II ACT III
ALSO Sultans of Swap: Fearing the Gearing! Sultans of Swap: BP Potentially More Devistating than Lehman! |

"EURO EXPERIMENT"
archives open EURO EXPERIMENT : ECB's LTRO Won't Stop Collateral Contagion!
EURO EXPERIMENT: |

![]()
"INNOVATION"
archives open |

"PRESERVE & PROTE CT"
archives open |

Weekend Jan. 30th, 2016
Follow Our Updates
on TWITTER
https://twitter.com/GordonTLong
AND FOR EVEN MORE TWITTER COVERAGE
![]()
| JANUARY | ||||||
| S | M | T | W | T | F | S |
| 1 | 2 | |||||
| 3 | 4 | 5 | 6 | 7 | 8 | 9 |
| 10 | 11 | 12 | 13 | 14 | 15 | 16 |
| 17 | 18 | 19 | 20 | 21 | 22 | 23 |
| 24 | 25 | 26 | 27 | 28 | 29 | 30 |
| 31 | ||||||
KEY TO TIPPING POINTS |
| 1- Bond Bubble |
| 2 - Risk Reversal |
| 3 - Geo-Political Event |
| 4 - China Hard Landing |
| 5 - Japan Debt Deflation Spiral |
| 6- EU Banking Crisis |
| 7- Sovereign Debt Crisis |
| 8 - Shrinking Revenue Growth Rate |
| 9 - Chronic Unemployment |
| 10 - US Stock Market Valuations |
| 11 - Global Governance Failure |
| 12 - Chronic Global Fiscal ImBalances |
| 13 - Growing Social Unrest |
| 14 - Residential Real Estate - Phase II |
| 15 - Commercial Real Estate |
| 16 - Credit Contraction II |
| 17- State & Local Government |
| 18 - Slowing Retail & Consumer Sales |
| 19 - US Reserve Currency |
| 20 - US Dollar |
| 21 - Financial Crisis Programs Expiration |
| 22 - US Banking Crisis II |
| 23 - China - Japan Regional Conflict |
| 24 - Corruption |
| 25 - Public Sentiment & Confidence |
| 26 - Food Price Pressures |
| 27 - Global Output Gap |
| 28 - Pension - Entitlement Crisis |
| 29 - Central & Eastern Europe |
| 30 - Terrorist Event |
| 31 - Pandemic / Epidemic |
| 32 - Rising Inflation Pressures & Interest Pressures |
| 33 - Resource Shortage |
| 34 - Cyber Attack or Complexity Failure |
| 35 - Corporate Bankruptcies |
| 36 - Iran Nuclear Threat |
| 37- Finance & Insurance Balance Sheet Write-Offs |
| 38- Government Backstop Insurance |
| 39 - Oil Price Pressures |
| 40 - Natural Physical Disaster |
Reading the right books?
No Time?

We have analyzed & included
these in our latest research papers Macro videos!
![]()
OUR MACRO ANALYTIC
CO-HOSTS
John Rubino's Just Released Book
![]()
Charles Hugh Smith's Latest Books
![]()
![]()
Our Macro Watch Partner
Richard Duncan Latest Books

MACRO ANALYTIC
GUESTS
F William Engdahl

![]()
![]()

![]()

![]()

![]()
OTHERS OF NOTE
![]()
![]()

![]()


![]()
Book Review- Five Thumbs Up
for Steve Greenhut's
Plunder!

![]()
|
Have your own site? Offer free content to your visitors with TRIGGER$ Public Edition!
Sell TRIGGER$ from your site and grow a monthly recurring income!
Contact [email protected] for more information - (free ad space for participating affiliates).
HOTTEST TIPPING POINTS |
Theme Groupings |
||
We post throughout the day as we do our Investment Research for: LONGWave - UnderTheLens - Macro
|
|||
|
MOST CRITICAL TIPPING POINT ARTICLES TODAY
|
|
||
 |
|||
|
01-30-16 | SII | |
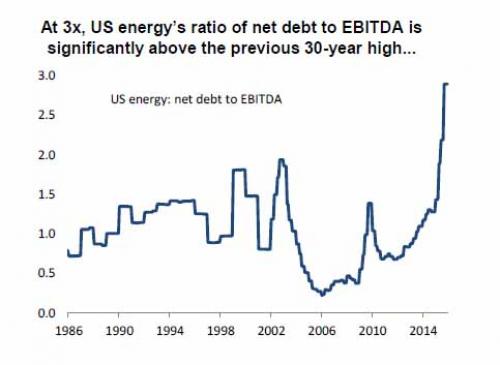
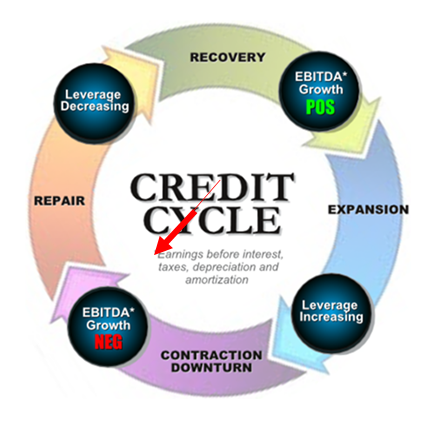
The Four Scariest ChartsFor Energy InvestorsMuch has been said, and many charts shown demonstrating how collapsing oil prices equate with a recessionary (and, according to at least one Dallas Fed respondent, "depressionary") hit for the US energy space and manufacturing sector first, and subsequently, contagion for US banks various other investors in the US shale space, and ultimately the broader economy. Perhaps too much. So in an attempt to simply some of the confusion, here are just four charts which, in our opinion, are among the scariest for energy investors. First, plunging oil prices mean sliding revenues, resulting in collapsing cash flows and soaring leverage ratios...
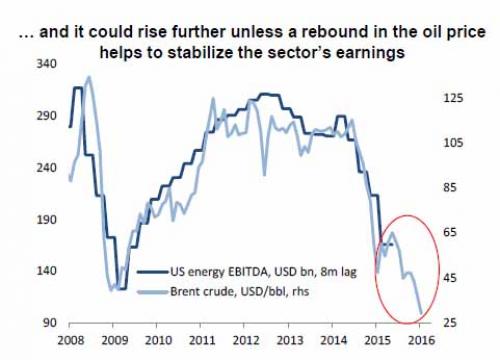
... Ratios which will likely deteriorate substantially if one takes the price of oil as a leading indicator where EBITDA will be 8 months from now:
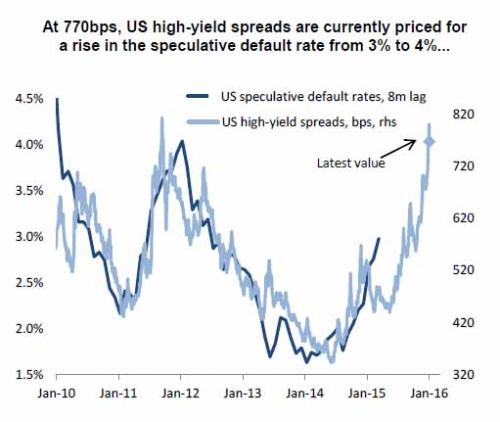
Should the deterioration continue it will suggest even further widening of junk spreads, which will mean a spike in default ratios, which will result in substantial impairment charges for underreserved banks and a hit to both profitability and capital ratios.
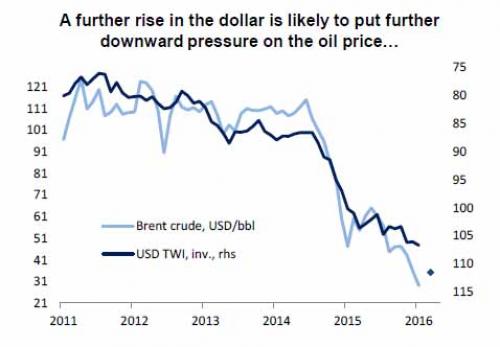
This feedback loop can be short-circuited: all that would take is for the soaring trade weighted dollar - the key driver of plunging oil prices - to tumble. However, for that to happen, Yellen will have to not only relent, but admit full blown defeat and undo the past year and half of preparation for rate hikes because the "global economy is ready", which we now know it isn't and virtually everyone has admitted the Fed made a mistake.
Summarizing all of the above: the vicious spiral of low oil prices, collapsing profits, impairment provisions, and economic contraction will continue until the Fed finds a way to weaken the Dollar... something it is now unable to do without losing all credibility. In short, the Fed remains trapped and with every passing day it does not "fix" its policy error, these charts will only get scarier. |
|||
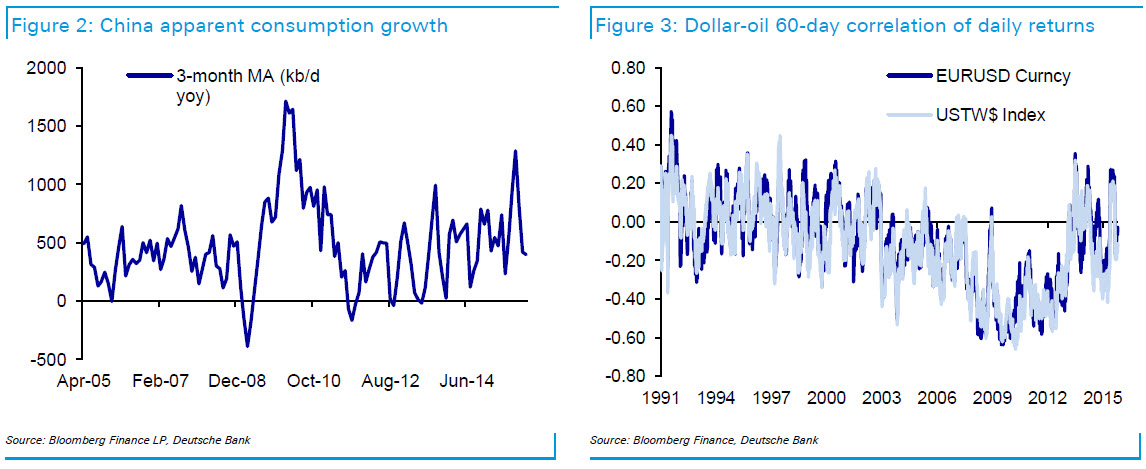
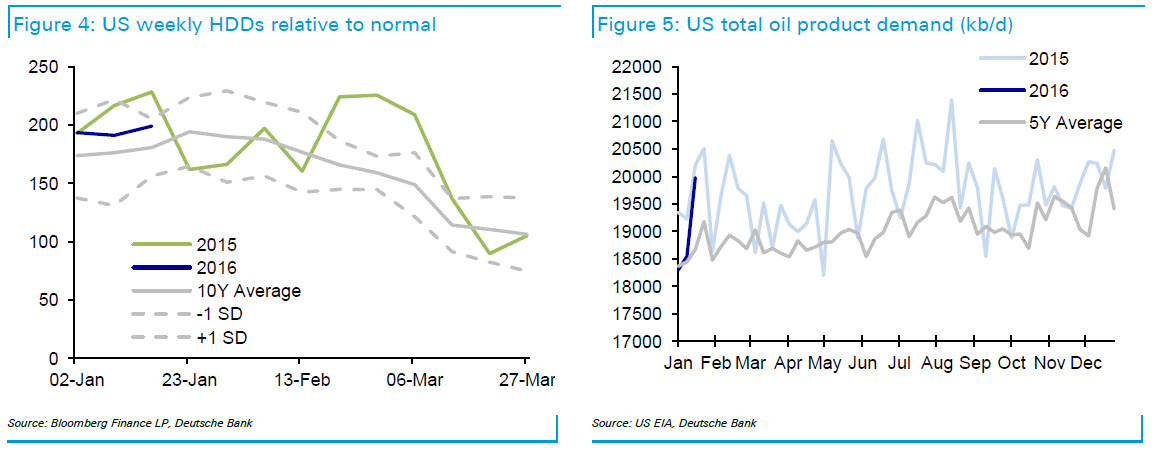
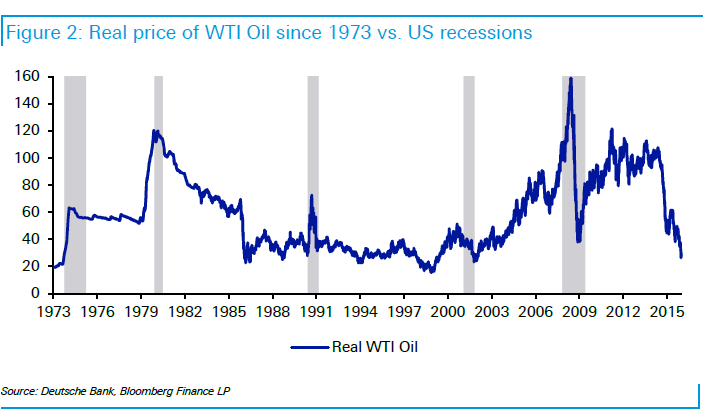
$7 Crude?Deutsche Bank Downgrades Oil 'Lower.... For A Lot Longer'Oil prices around USD 30/bbl mean that an increasingly significant volume of future oil projects no longer make sense. Although Deutsche Bank does not expect US crude inventories to reach capacity, rising US inventories and high US crude imports may heighten downside pressures to push prices closer to marginal cash costs of USD 7-17/bbl for US tight oil. With few plausible scenarios for a strong price recovery in the short term, Deutsche lowers their Q1-2016 price forecasts to USD 33/bbl for WTI and Brent. We see downside risks stemming from a lower demand growth outlook this year in the event that US product demand remains extremely weak, and from the possibility that equity market declines feed through into lower consumer confidence and spending. Upside risks may arise from either a weak or unsustained rise in Iranian exports, which may then lead to OPEC production in 2017 below our assumption of 32.4 mmb/d (excluding Indonesia). One might be tempted to claim that prices have detached from fundamentals given the rapidity of the decline since December. Although we could choose to attribute some part of price movement to outside factors such as market psychology, an undeniable rise in risk aversion since the start of the year, and associated equity market weakness, this would do little to advance the state of knowledge regarding oil fundamentals. Therefore we prefer to (i) identify a possible fundamental basis for the further decline in oil prices, which could sustain prices at a low level, and (ii) assess the likely impact of prices remaining around USD 30/bbl on the forward balance.
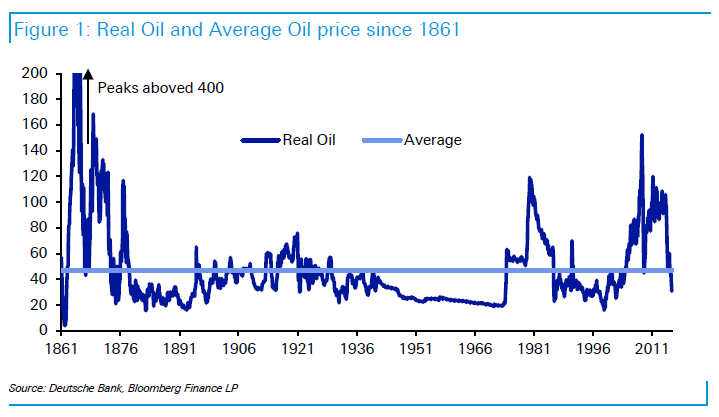
Finally Deustche Bank shows two long-term charts that hopefully make for interesting reading when considering just how "lower" for "longer" oil could be...
As we say on a regular basis we are firmly in the secular stagnation camp but have some sympathy that the consumer is getting a big benefit at the moment from the sharp fall in Oil. If only there wasn’t huge amount of leverage in the financial system exposed to commodities that could potentially be systemic. |
|||
TIPPING POINTS, STUDIES, THESIS, THEMES & SII COVERAGE THIS WEEK PREVIOUSLY POSTED - (BELOW)
|
|||
| MOST CRITICAL TIPPING POINT ARTICLES THIS WEEK - Jan 24th, 2016 - Jan 30th, 2016 | |||
| TIPPING POINTS - This Week - Normally a Tuesday Focus | |||
| BOND BUBBLE | 1 | ||
| RISK REVERSAL - WOULD BE MARKED BY: Slowing Momentum, Weakening Earnings, Falling Estimates | 2 | ||
| GEO-POLITICAL EVENT | 3 | ||
| CHINA BUBBLE | 4 | ||
| CHINA BUBBLE | 02-26-16 | 4 | |
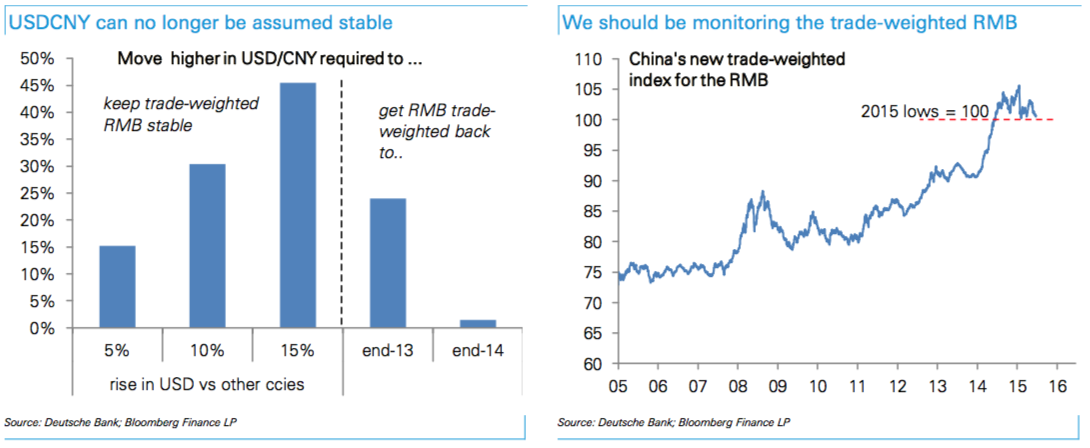
Chinese Rush To Buy Foreign Assets As Mammoth $1 Trillion In Capital Flees Country“The immediate trigger for a pickup in capital outflows toward the end of the year was the People’s Bank of China’s poor communication over its shift in currency policy,” Mark Williams, chief Asia economist for Capital Economics told Bloomberg on Sunday, describing the panicked reaction to Beijing’s adoption of a trade-weighted currency index. Over $1 trillion in capital flowed out of China in 2015 as the PBoC’s bungled move to devalue the yuan caused investors to question whether a much larger depreciation is in the cards. According to Bloomberg’s estimates, $158.7 billion left the country last month, the second highest monthly total of 2015 after September’s $194.3 billion hemorrhage. Things had calmed down going into December and probably would have stayed calm at least in the interim had the PBoC not introduced a new trade-weighted index for the yuan which pretty clearly indicated that China still thinks its currency is overvalued. Indeed, assuming the dollar continues to appreciate versus global currencies, the yuan will need to fall significantly in order to keep the trade-weighted RMB stable.
In short, China is no longer willing to take it on the chin in the global currency wars. The days of Beijing sitting idly by and watching as the dollar peg kills the country’s export competitiveness are over. As 2015 turned to 2016 we got still more volatility and indeed, fresh devaluation fears contributed mightily to the market turmoil we witnessed in January. “China’s yuan policy has a communication issue” the IMF’s Christine Lagarde said last week. Indeed, but one thing that has been clearly communicated to Chinese citizens is that they need to get their money out of China - and fast. Technically, Chinese are limited to $50,000 in terms of how much they can move out of the country in a given year, but as we’ve documented extensively, there are any number of ways to skirt the restrictions. “Thanks to incremental reforms to China's capital account enacted while the yuan was still strong, it is easier than ever for Chinese companies and individuals to get money out legally,” Reuters writes, adding that Chinese “can buy property, or invest in offshore stocks, bonds or managed hedge funds; they can purchase offshore life insurance that can be used as collateral for further loans, or even buy a foreign company outright.” And those are just the legal outlets. Chinese can also use the UnionPay end-around (although Xi has cracked down on that) or simply visit “Mr. Chen” at his “tea” kiosks. Here’s more from Reuters on Beijing’s “more holes than fingers” problem:
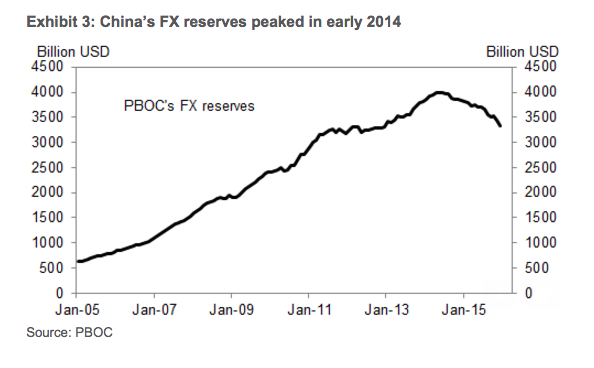
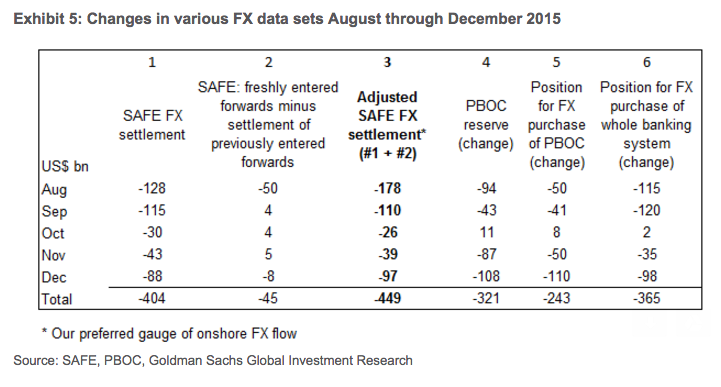
Estimating capital flight out of China isn't an exact science and different analysts look at different proxies to determine just how leaky the ship is, so to speak. "In the wake of the small devaluation of the renminbi in August 2015, and more recently the weaker fixes in the first week of the new year, we have received a large volume of questions about capital outflows from China – how big they are, what the main sources of outflows, and how long they can continue," Goldman says, in a note out Monday. In an effort to shed some light on where to look for accurate data on capital flight, Goldman breaks down the relevant data points on the way to determining that from August to December, $449 billion in capital left the country. * * * From Goldman Each month, official sources publish three different data sets that are relevant to the FX flow situation. These are not comprehensive either individually or collectively, but together shed a fair amount of light on the likely degree of FX outflow. PBOC FX reserves (Exhibit 3). This dataset captures the FX assets held by the PBOC. It is reported based on market prices and therefore subject to valuation effects (both with respect to exchange rate and asset price movements). It does not include forwards but captures PBOC’s FX-RMB (cash) settlements with other parties; these settlements may include drawdown/repayment of PBOC’s FX entrusted loans to other entities (e.g., policy banks). It is released the earliest of the three indicators, usually on the 7th of the month.
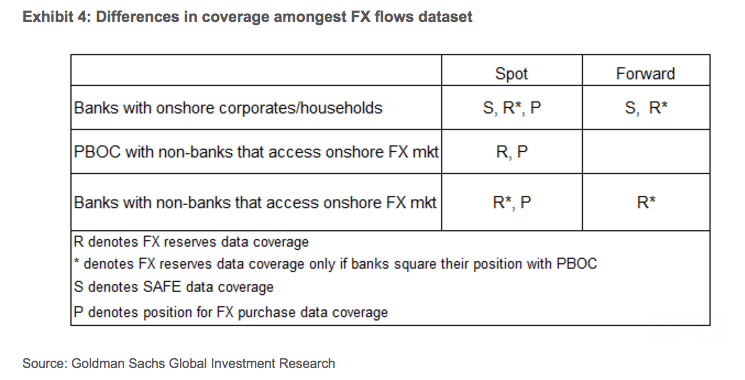
Position for FX purchase of the whole banking system (PBOC plus banks). This dataset captures the amount of RMB supplied for FX purchase by the entire banking system (i.e., both the central bank and commercial banks), free of valuation effects. It is based on cash settlements and therefore does not include any changes in forwards. Transactions between the onshore banking system (PBOC plus onshore banks) and other parties with access to the onshore FX market would be covered in this dataset. This data is usually out around the middle of the month, after FX reserves data. Note that given possible PBOC balance sheet management (e.g., short-term transactions and agreements with banks, e.g., forward transactions), neither PBOC’s reserve data nor its position for FX purchase necessarily forms a complete picture of the FX situation. SAFE data on banks’ FX settlement . This dataset captures banks’ FX transactions with onshore non-banks, both in the spot market and via forwards. It is transaction-based and therefore free of valuation effects. While the headline series is cash-based, which includes outright spot transactions in the reporting period and settlement of previously entered forwards, we can adjust the forward component by subtracting the settlement of forwards and adding back freshly entered forwards. After this adjustment, the SAFE data capture the underlying currency demand both in spot and forward by corporates and households—it is therefore our preferred gauge of onshore FX flows. The SAFE data is usually released in the third week of the month, after FX reserves and FX purchase data. Based on the different characteristics of the various data sets as summarized in Exhibit 4, we can roughly deduce the underlying FX flow situation as follows.
Our preferred gauge of onshore FX flow—again, based on SAFE data but adjusted for settled/freshly-entered forward contracts--suggests a net flow of about -$449bn during August-December (and -$620bn for the full year). Note that this gauge refers only to onshore FX flow, not including any FX intervention in the offshore CNH market—hence it is likely an underestimate of the overall (onshore and offshore) outflow situation. From an accounting perspective, though, it would be the unadjusted SAFE settlement data (including settlement of previously entered forwards between banks and non-banks, but excluding freshly- entered ones) that are more comparable with other related FX data sets (which are also cash-based). Exhibit 5 shows the changes in the various FX data sets from August through December 2015.
A main difference between SAFE settlement and banks’ position for FX purchase is that the latter captures onshore banks’ FX transactions with other institutions that also have access to onshore interbank FX market (e.g., offshore banks, some other non-bank financial institutions). Data from these two data sets were fairly close in August-December, except for October, where the SAFE FX settlement suggested continued FX outflow while the position for FX purchases pointed to FX inflow. The discrepancy, along with the meaningful increase in non-bank financial institutions’ RMB deposits during the month, suggests the possibility that some non-bank financial institutions sold a significant amount of FX for RMB in the interbank market in October. One area where none of the official data can give much guidance on is the possible scale of CNH intervention through forwards Judging from observed market behavior, there has likely been significant volume of CNH forward intervention. To the extent this has been the case, the outstanding amount of the forward positions would be additive to the amount of outflows we calculated above and could be an additional drag on PBOC reserves going forward. * * * In other words, when you see the spread between the onshore and offshore spot suddenly compress after blowing out dramatically, China has just spent more money to combat capital flight and as regular readers might have noticed, CNH interevention isn't exactly uncommon. And so, as money flees the country for the "safety" of Spanish real estate and African mines, watch the FX reserve headline figure and recall what Bank of Singapore chief economist Richard Jerram said earlier this month: "The burn rate has been worrying. It’s not about how long it gets to zero, its about how long it gets to about 2, which is what they need." |
|||
| JAPAN - DEBT DEFLATION | 5 | ||
EU BANKING CRISIS |
6 |
||
| TO TOP | |||
| MACRO News Items of Importance - This Week | |||
GLOBAL MACRO REPORTS & ANALYSIS |
|||
US ECONOMIC REPORTS & ANALYSIS |
|||
| CENTRAL BANKING MONETARY POLICIES, ACTIONS & ACTIVITIES | |||
| Market - WEDNESDAY STUDIES | |||
| STUDIES - MACRO pdf | |||
TECHNICALS & MARKET |
|
||
| Market - WEDNESDAY STUDIES | |||
| STUDIES - MACRO pdf | 02-27-16 | ||
TECHNICALS & MARKET |
|
||
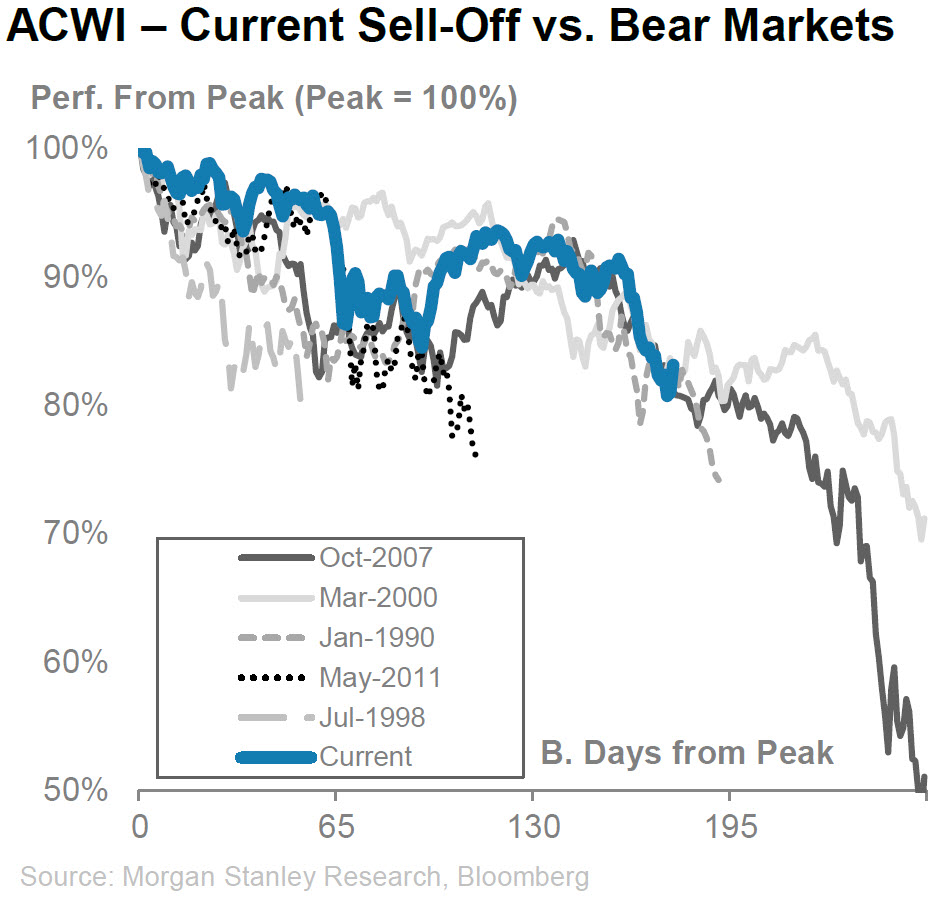
How The Current Sell-Off Stacks Up To All Previous Bear MarketsBased on 43 large sell-offs in the world's major equity markets, Morgan Stanley gauges how the current market slide compares to bear markets and bull corrections through history. While they have tended to last about 190 business days, with drawdowns around 30%, the current environment is considerably weaker than the typical bear market beginning... The Bear Necessities – What’s the ‘Typical’ Sell-Off Environment? Valuations tended to be cheaper than those seen at current sell-off’s peak, while macro (GDP, inflation) tended to be stronger at the start of bear markets.
If ACWI followed the script precisely, it would imply ~10% downside from current levels over the course of four weeks. Equity markets started the current sell-off from a more expensive point on most valuation metrics and remain more expensive vs. previous troughs. The weaker macro vs. previous market sell-offs argues for being defensive and avoid stretching for beta. Overall, we prefer credit over equities, as it is almost priced for a recession. Full Bear Market Almanac below: |
|||
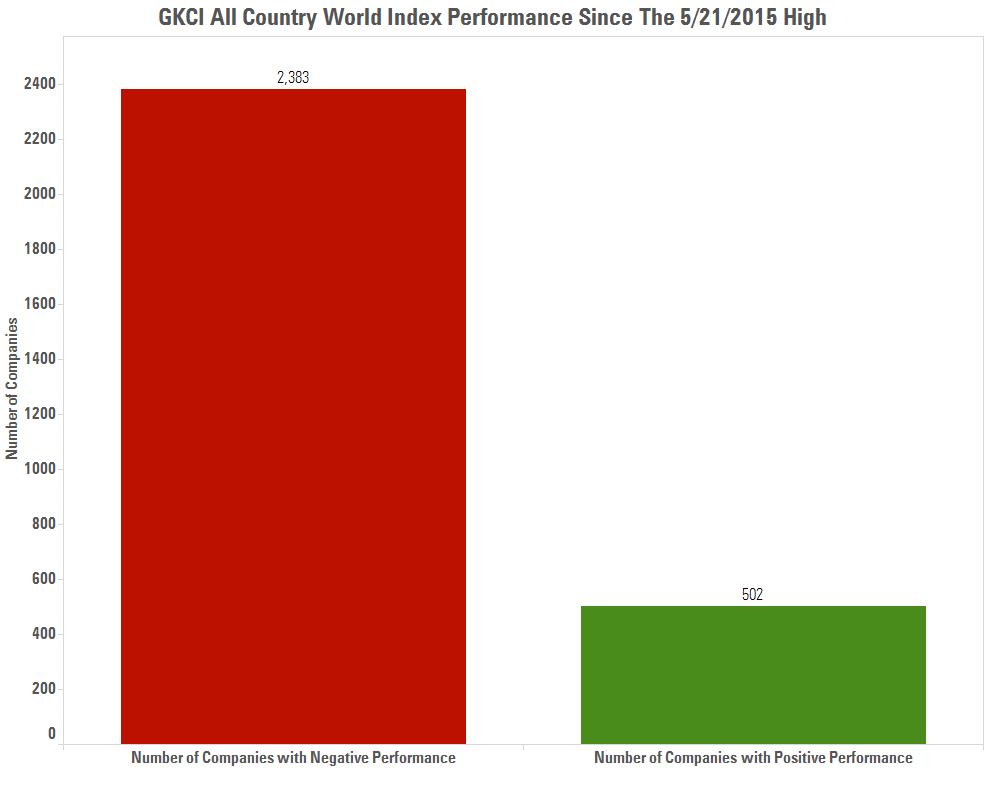
There Are Landmines EverywhereJust How Narrow Is This Market?Posted: Tue, 26 Jan 2016Submitted by Bryce Coward via Gavekal Capital blog, Most stocks are down since the global equity markets peaked on 5/21/2015 (this goes without saying) and most stocks are down a lot. This puts a premium on solid active management and stock picking. But the sheer numbers are striking. Of the 2885 companies in our GKCI All Country World Index, fully 2383 (or 83%) of them are down since the 5/21/2015 high, leaving only 502 (or 17%) of stocks up since that date. A stock-pickers market if we ever saw one! The first chart below illustrates this blunt point.
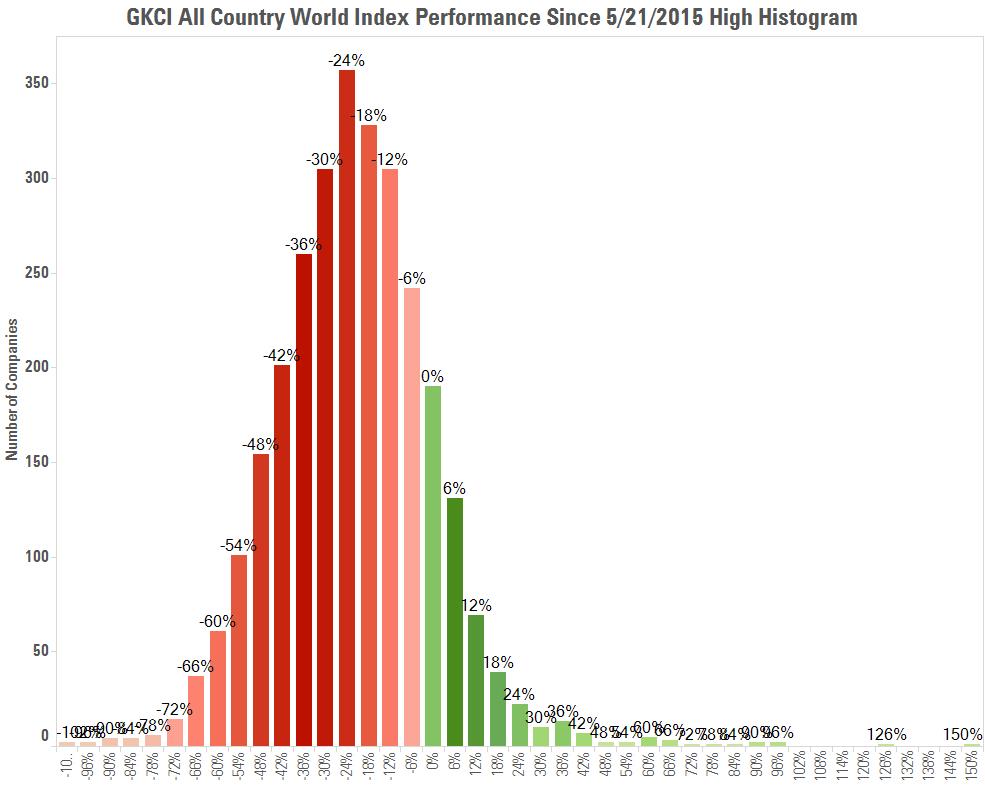
As we dig into the details, however, we see just how hard it’s been to stay above water since the May 21, 2015 peak in the global equity markets. Below we show a histogram of the distribution of stock returns since the 5/21 high. Mostly what you see is red (negative returns) and within that group you see an incredible amount of dark red between the bars that read -18% through -54%.
That is to say, most stocks that are down are down between 18-54%! In other words, there are landmines everywhere, and index tracking active mutual funds and ETFs have hit them all. |
|||
"The Risk Of An Earnings Recession"And Six Other Reasons WhyJPM Just Cut Its S&P Target To 2000Posted:Tue, 26 Jan 2016 16:33:01 GMTThe onslaught from JPMorgan continues, which in the aftermath of first Marko Kolanovic's periodic threatsabout sudden market crashes, and Mislav Matejka's recurring warnings that BTFD is dead and "not to overstay your welcome in the bounce", earlier today JPM's chief equity strategist Dubravko Lakos-Bujas has officially cut his 2016 year-end S&P500 earnings forecast to $120 from $123 "on stronger US Dollar and lower economic growth forecast" as well as trimming his year end S&500 target from 2,200 to 2,000. Here are the seven reasons why JPM continues to push the bear case:
As Dubravko summarizes, "this all makes for an unattractive equity backdrop." Furthermore, just like his peers, the third croat notes that there may be a short-term rebound, it is one that should be sold:
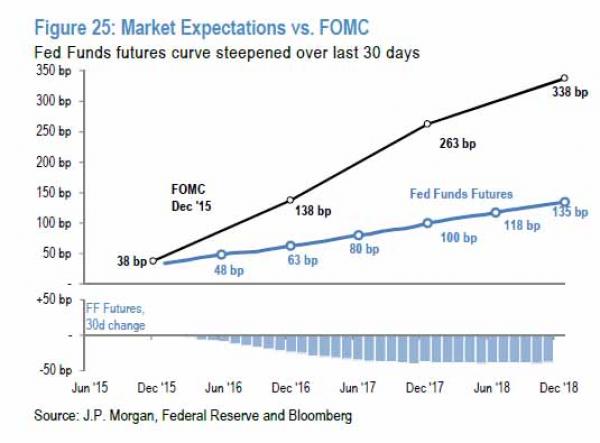
All of this puts the Fed's credibility in the crosshairs: the market is already expecting just one rate hike in 2016 vs the Fed's "dot plot" forecast of 4. Just how will Yellen converge the two outlooks without leading to even more volatility?
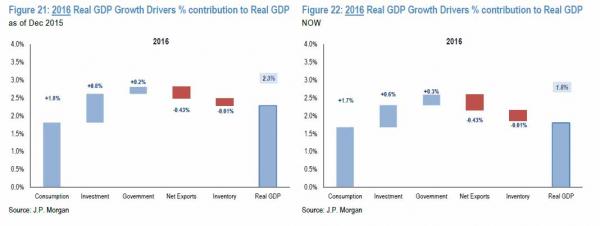
And then there is the economy: "US economic growth estimate for 2016 GDP has been revised down to 1.8% compared to 2.3% in December, which is a step down from 2.4-2.5% seen over the last two years:"
Which brings us to the conclusion:
Of course, using a well-known Keynesian strategy, if one only excludes all the negatives, only the great news is left, which may explain what the algos are doing today the stock market today. As for tomorrow, we hope Gartman decides to chase the rebound so the shorting can again resume.
|
|||
| COMMODITY CORNER - AGRI-COMPLEX | |||
| THESIS - Mondays Posts on Financial Repression & Posts on Thursday as Key Updates Occur | |||
|
2016 | THESIS 2016 |  |
| 2015 - FIDUCIARY FAILURE | 2015 | THESIS 2015 |  |
| 2014 - GLOBALIZATION TRAP | 2014 |  |
|
 |
|||
|
2013 2014 |
 |
||
|
2013 2014 |
|
||
YRA HARRIS: “There is No Wizard Behind the Curtain!”FRA Co-Founder Gordon T. Long discusses with Global Macro CME Floor Trader Yra Harris, the difficulties of investing in the currently suppressed global market. Yra has been a member of the CME since 1977 and is a well-known global macro trader. Yra currently works with Vine Street trading. YIELD CURVE Yra distinguishes the 5/30 UST as much more of speculators curve, and the 2/10 UST, an investors curve, meaning people with a longer term horizon. Regarding the flattening of the yield curve line: Yra references Paul Samuelson saying the stock marketing having predicted the past 9 of the 5 recessions, however the same cannot be said for the yield curve.
Yra believes that central banks eventually error one way or another, and ultimately cause the curve to flatten. 2016 PREDICTIONS The market anticipates slowing growth, if not negative growth resulting in recession. The last time this was seen was 2006-2007. When the Fed was raising rates, driving the rate to 5.5% on the federal fund rate, the yield curve was flattening, and within 6-9 months later, the curve had inverted. Yra combats the notion that the yield curve is a bad indicator by saying, “It is only a bad indicator because I cannot time for you, what the market’s reaction to it will be” Yra mentions Stanley fisher saying that going to negative yields in the United states would be very difficult because of their money market funds.
Yra brings up Stanley Fisher saying the four rate increases are a probability.
Yra believes that central banks are not concerned about inflation, because banks have learned they can slay inflation, by raising rates high enough to stop it, which will and has caused the yield curve to invert in the past. Systems built on borrowing, such as China, would rather endure periods of inflation than deflation, deflation is 30% unemployment, everything stops. “run inflation hotter, because that’s the greatest thing to remove the overhang of debt”
GEO POLITICAL TENSION — OIL & CHINESE MARKETS Demand is contracting because the world economies are slowing down. The Saudis have built their structure based on that they felt comfortable that the United States and the six fleet would always be there to support them.
There is word that they’re short of capital, however it’s cheaper to raise capital in an equity capital than a bond market. Saudi reserves are not the collateral for those bonds. This is all tied into the price of crude oil.
Yra’s tongue and cheek example is Google not being allowed to be used freely, restricting the free flow of information.
One thing that has always scared the Chinese authorities is losing control of the employment situation. Michael Pettis has talked about how the Chinese leadership has financially repressed the middle class, because they’ve kept the Yuan too cheap in order to build a vast pool of reserves. When a country wants to buy imports, they have to pay a greater price but the goal was to drive the export engine. When trying to make the shift from export oriented to a more domestic oriented economy, then a stronger Yuan is more desirable, which would make for cheaper imports. Yra states, “If you’re really trying to empower your citizenry, let the currency go higher.” “China is still a totalitarian government, and they can inspire fear, which is what a totalitarian regime operates on” THE FOCUS FOR INVESTORS “We don’t have the play out of fundamentals that we used to. They will eventually play out because fundamentals will ultimately drive the market, they have to.” Yra says that the equity markets are so linked and tell a global story, but believes that linkage is a false correlation. “Monetary policy and financial acumen is still not rocket science” – It brings with it much uncertainty.
|
|||
2011 2012 2013 2014 |
 |
||
| THEMES - Normally a Thursday "Themes" Post & a Friday "Flows" Post | |||
I - POLITICAL |
|||
CENTRAL PLANNING - SHIFTING ECONOMIC POWER - STATISM
MACRO MAP - EVOLVING ERA OF CENTRAL PLANNING
|
G | THEME | |
| - - CRISIS OF TRUST - Era of Uncertainty | G | THEME | |
CORRUPTION & MALFEASANCE - MORAL DECAY - DESPERATION - RESENTMENT. |
US | THEME PAGE |  |
| - - SECURITY-SURVEILLANCE COMPLEX - STATISM | G | THEME | |
| - - CATALYSTS - FEAR (POLITICALLY) & GREED (FINANCIALLY) | G | THEME | |
II-ECONOMIC |
|||
| GLOBAL RISK | |||
| - GLOBAL FINANCIAL IMBALANCE - FRAGILITY, COMPLEXITY & INSTABILITY | G | THEME | |
| - - SOCIAL UNREST - INEQUALITY & A BROKEN SOCIAL CONTRACT | US | THEME | |
| - - ECHO BOOM - PERIPHERAL PROBLEM | M | THEME | |
| - -GLOBAL GROWTH & JOBS CRISIS | |||
| - - - PRODUCTIVITY PARADOX - NATURE OF WORK | THEME | MA w/ CHS |
|
| 01-08-16 | THEME | MA w/ CHS |
|
| - - - STANDARD OF LIVING - EMPLOYMENT CRISIS, SUB-PRIME ECONOMY | US | THEME | MA w/ CHS |
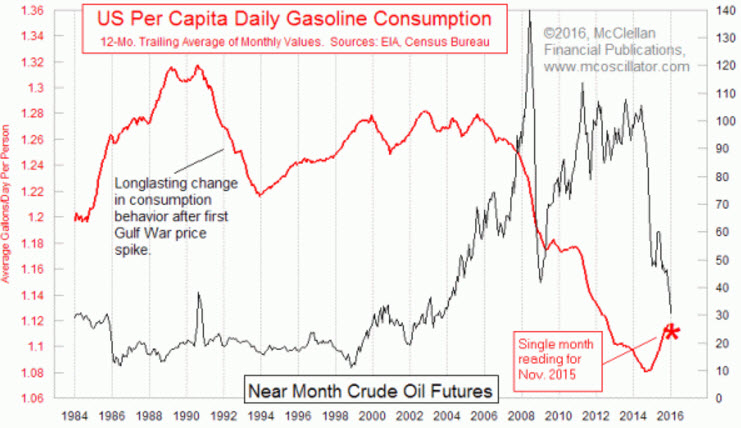
Submitted by Tyler Durden on 01/27/2016 Why Lower Gasoline Prices Are Not Stimulating The EconomySubmitted by Tom McClellan via MCOscillator.com, Fed officials and financial news reporters are collectively wondering why the economy seems to be slowing down, even though lower oil and gasoline prices ought to be a stimulative factor. If consumers are spending less of their money on gasoline, then they ought to have more to spend on other stuff, or so goes the reasoning. So why is it not working? The problem is one of magnitude, and most analysts fail to take the time to do the math. So at the risk of boring you with arithmetic, let’s look at some important numbers, with a bit of back-of-the-envelope math. The EIA publishes data on consumption for a variety of energy products, including gasoline. In November 2015 for example (the most recent month for which there are data), Americans consumed gasoline at a rate of 358 million gallons per day. The 12-month average is 360 million gallons. That sounds like a really large number, but when you realize that there are roughly 322 million resident Americans, that works out to 1.11 gallons per day for every American.
The chart above shows the trend for that data. The high prices of just a couple of years ago sent people into dealerships to buy Priuses, Volts, Teslas, and other electrified cars to avoid paying high gasoline prices. But the falling prices for automobile fuel are making consumers eschew those more efficient choices, and consume more gasoline. They are also consuming more diesel, which is not part of these computations, but it is nevertheless a real factor. Looking at the math, if the price of gasoline drops from $3.00 to $2.00 (round numbers to make the math easier), that means an extra $1.11 in your pocket every day, assuming you are the average man, woman, and child in America. If you find a dollar on the sidewalk, pick it up and put it in your pocket, are you going to go out and adjust your spending patterns? Probably not. But if you found a dollar on the sidewalk every day for a month, or for several months, maybe you will start supersizing your Happy Meal, buying more Pokemon cards, or making other adjustments to your consumption. This is the point that former Fed Chairman Ben Bernanke made in his famous speech about dropping money from helicopters, a point he borrowed from Milton Friedman. Aggregating all of those savings, a $1 drop in gasoline prices amounts to around $10.8 billion of supposed stimulus in the form of consumers keeping more of their own money. That’s $1 multiplied by an average of 360 million gallons per day, times 30 days in an average month. Now, $10.8 billion per month is a pretty big number, but it is nowhere near the $85 billion per month that the Fed was pumping into the banking system during QE3, for example. Still, $10.8 billion per month ought to do something for stimulus, right? Yes, of course, but that is unless it gets eaten by monsters. Mwahh, hah hah!! The Robert Wood Johnson Foundation (RWJF) estimates that the average price of healthcare premia will rise by 12.56% in 2016, a figure way above the estimate of 5.8%per year as modeled by the Centers for Medicare and Medicaid Services for the 2014 to 2024 period. The National Conference of State Legislatures estimates a US-wide cost for a “Silver” plan medical insurance for a 40-year-old non-smoker at $314 for 2015. So if we apply a 12.56% growth rate from RWJF, that amounts to a jump to $353, or $39/month. That pretty well eats up the $1.11 per day savings on gasoline. Ergo, the stimulus of lower gasoline prices has been eaten by monsters. One other monster eating the gasoline stimulus is that the federal government is now soaking up 18.1% of GDP in the form of federal taxes. Going above 18% has a proven track record of pushing the U.S. into a recession. So the bottom line is that whatever stimuli the lower prices of gasoline are giving us are getting swallowed by darker forces. And the magnitude of the savings is just not enough to outweigh those stronger forces. It would not even be enough if gasoline was free. And that’s the big takeaway message. GORDON T LONG.COM: DARKER FORCES
|
|||
III-FINANCIAL |
|||
|
FLOWS - Liqudity, Credit & Debt
|
MATA RISK ON-OFF |
THEME |
w/ R Duncan |
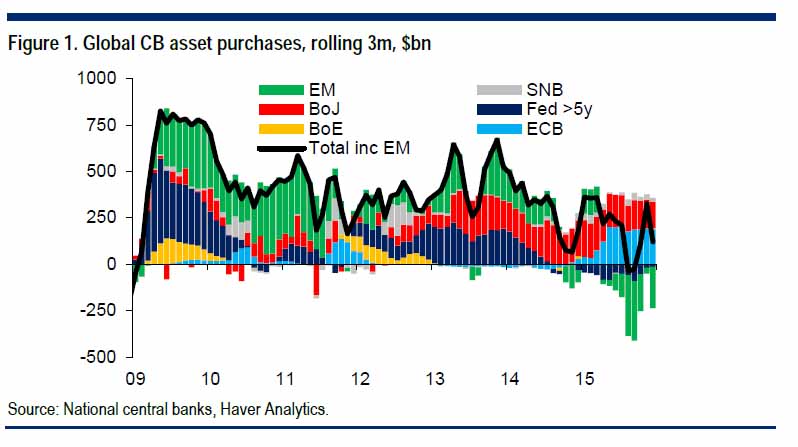
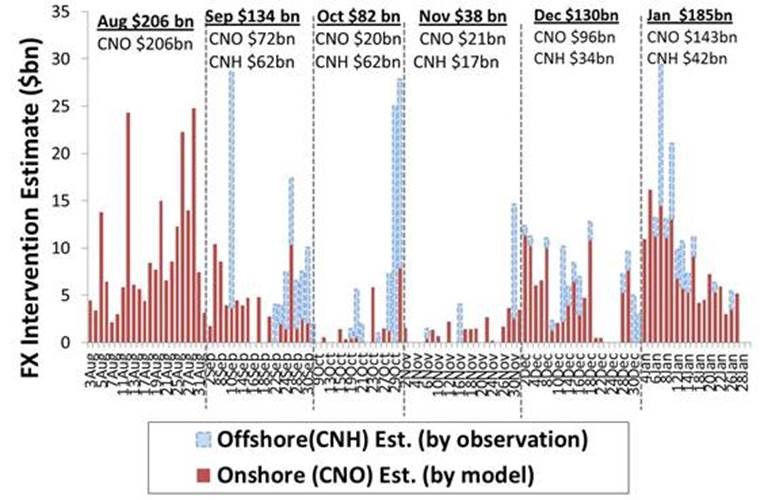
Here Is The Reason For January's Selloff:China's January Outflows Soar To Second Highest EverPosted:Fri, 29 Jan 2016 00:42:12 GMTWhile China's currency devaluation has, alongside the price of commodities, become one of the two key drivers of market volatility and tubulence around the globe, when it comes to risk, one far more important Chinese metric is the actual amount of capital that leaves the nation. The reason for this is that as explained over the weekend, in a world where Quantitative Tightening by EMs and SWFs has emerged as a powerful counterforce to Quantitative Easing - or liquidity injections - by developed central banks, what matters for global risk levels is the net effect of these two opposing money flows.
Of all the global "quantitative tighteners", the biggest culprit is China, which has seen over $1 trillion in reserve selling since the summer of 2014, the direct result of a virtually identical amount in capital outflows. Furthermore in for a "closed' Capital Account system like is China, the selling of FX reserves is a direct function of capital outflows, so the only real data needed to extrapolate not only the matched reserve selling and thus Quantitative Tightening, but also the direct impact onglobal risk assets, is how much capital outflow has taken place. This takes place in one of two ways: by relying on official Chinese historical data, or by estimating how much outflows take place on a concurrent basis, thus allowing one to estimate how much capital is flowing out in real time. Indicatively, China's SAFE released onshore FX settlement data for the whole banking system (PBoC+banks), suggesting some $97bn of FX outflows in Dec, which is broadly in line with the fall in official reserves. But much more important is the question what is taking place right now, the answer to which can either wait until SAFE releases January data in several weeks... or rely on day to day estimates of outflows in the form of central bank FX intervention. Luckily, we have just that. According to a Goldman report, so far in January "there has been around $USD 185bn of intervention (with the recent intervention predominantly taking place in the onshore market)" split roughly $143 billion on the domestic side and $42 billion on the offshore Yuan side.
This would make January the month with the second largest amount of intervention since August 2015, and thus the second highest month of capital outflows, and would explain the ongoing deterioration across global asset classes as China's various FX reserve managers have been forced to sell not just government bonds but equities as well. Goldman also calculates that "total intervention over the last 6 months, using our estimates, sums to USD 775bn." Run-rating this amount would suggest that nearly $1.6 trillion in Quantiative Tightening is taking place just due to China's attempts to stem capital flight. This number excludes the hundreds of billions in reserves that all other petrodollar and EM nations have to liquidate as well to prevent the rapid devaluation of their own currencies as the world remains caught in the global dollar margin call we first explained in early 2015. The implications from this are two-fold:
Of course, China's rabid defense of further capital outflows means that its original intent, to devalue the Yuan to a degree that boosts its economy via exports, has been put on hiatus, or in other words China is trapped, and instead of an external rebalancing it is forced to boost its economy in the one way it knows best: by issuing ever more debt. However, with China's total debt now estimated at 350% of GDP, it only has a finite amount of time before the debt bubble finally pops as well. In other words, for China there is, as of this moment, quite literally no way out, and what's worse the longer it delay the decision of how it will reset its economy, the worse it will be for global risk markets. |
|||
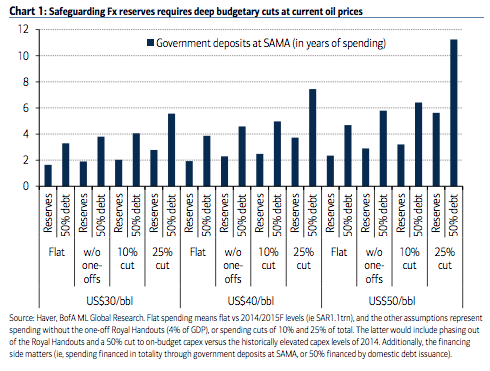
Saudi Arabia Hemorrhages $19.4 Billion In Reserves During DecemberPosted:Thu, 28 Jan 2016 22:40:21 GMTSaudi Arabia - which was busy playing headline hockey with Russia this morning over a rumored 5% production cut proposal - is running out of money. Yes, we know, that sounds absurd. But believe it or not, the country whose monarch recently rented the entire Four Seasons hotel for a 48 hour stay in Washington DC, is in fact going broke. And at a fairly rapid clip. The problem: slumping crude. As we first discussed in November of 2014, Riyadh’s move to kill the fabled petrodollar in an effort to bankrupt the US shale complex was a risky proposition. If ZIRP kept US producers in the game longer than the Saudis anticipated, crashing crude could end up blowing a hole in the kingdom’s budget - especially if Iranian supply came back on line and added to the supply glut. Fast forward a 14 months and that’s exactly what’s happened. US production is down but not wholly out (yet) and the Iranians are adding 500,000 barrels per day in output in Q1 and 100,000,000 per day by the end of the year. Compounding the problem is the war in Yemen (which will enter its second year this March) and the cost of providing subsidies for everyday Saudis. All of this has conspired to leave Riyadh with a budget deficit of 16%. That’s expected to narrow in 2016 but at 13%, will still be quite large. Make no mistake, if crude continues to sell for between $30 and $35 per barrel, 13% will probably prove to be a rather conservative estimate. "This is a quantum leap in all aspects," Abdullatif al-Othman, governor of the Saudi Arabian General Investment Authority, told a conference convened this week to study ways for the kingdom to cut spending and shore up the budget. Here's Reuters:
Meanwhile, the market is betting that the pressure will ultimately force the Saudis to abandon the riyal peg. Keeping the currency tethered to the dollar is yet another drag on the country’s finances and all in all, the kingdom saw its FX reserve war chest dwindle by more than $100 billion through November. That’s what we mean when we say the monarchy is going broke. In December, the bleeding continued unabated. Data out today from SAMA shows the Saudis blew through some $19.4 billion last month, as the war chest shrank to $608 billion.
Thanks to the fact that the composition of the SAMA piggybank is a state secret, we don't know how much of the drawdown was USTs, but it's safe to say some US paper was sold. As a reminder, the IMF estimates that if current market conditions persist, the kingdom will have burned through the entirety of their rainy day fund within just five years. Here's BofAML's analysis of the SAMA stash and how long Riyadh can hold out under various assumptions for crude prices and borrowing.
So even as the Saudis swear the headlines surrounding a proposed 5% production cut are bogus and even if Riyadh managed to weather the storm slightly better in 2015 than some predicted, the kingdom effectively has two choices: 1) cut production, or 2) drop the riyal peg. Otherwise, King Salman won't be able to tap SAMA for the money he needs to rent Mercedes S600 fleets - and we can't have that...
|
|||
| CRACKUP BOOM - ASSET BUBBLE | 12-31-15 | THEME | |
| SHADOW BANKING - LIQUIDITY / CREDIT ENGINE | M | THEME | |
| GENERAL INTEREST |
|
||
| STRATEGIC INVESTMENT INSIGHTS - Weekend Coverage | |||
|
|||
|
SII | ||
|
SII | ||
|
SII | ||
|
SII | ||
| TO TOP | |||


Read More - OUR RESEARCH - Articles Below

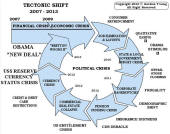
Tipping Points Life Cycle - Explained
Click on image to enlarge
TO TOP
 |
YOUR SOURCE FOR THE LATEST THINKING & RESEARCH
|
�
TO TOP