|
JOHN RUBINO'SLATEST BOOK |
||||||||||||||||||||||||||||||||||||||||||||||||||||||||||||||||||||||||||||||||||||||||||||||||||||||||||||||||||||||||||||||||||||||||||||||||||||||||||||||||||||||||||||||||||||||||||||||||||||||||||||||||||||||||||||||||||||||||||||||||||||||||||||||||||||||||||||||
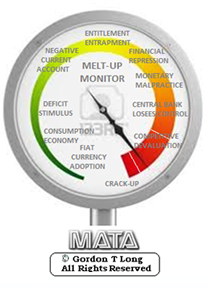
"MELT-UP MONITOR "
Meltup Monitor: FLOWS - The Currency Cartel Carry Cycle - 09 Dec 2013 Meltup Monitor: FLOWS - Liquidity, Credit & Debt - 04 Dec 2013 Meltup Monitor: Euro Pressure Going Critical - 28- Nov 2013 Meltup Monitor: A Regression-to-the-Exponential Mean Required - 25 Nov 2013
|

![]()
"DOW 20,000 "
Lance Roberts Charles Hugh Smith John Rubino Bert Dohman & Ty Andros
|
HELD OVER
Currency Wars
Euro Experiment
Sultans of Swap
Extend & Pretend
Preserve & Protect
Innovation
Showings Below
"Currency Wars "
|

"SULTANS OF SWAP" archives open ACT II ACT III
ALSO Sultans of Swap: Fearing the Gearing! Sultans of Swap: BP Potentially More Devistating than Lehman! |
"EURO EXPERIMENT"
archives open EURO EXPERIMENT : ECB's LTRO Won't Stop Collateral Contagion!
EURO EXPERIMENT: |
![]()
"INNOVATION"
archives open |

"PRESERVE & PROTE CT"
archives open |

Tue. Jan. 5th, 2016
Follow Our Updates
on TWITTER
https://twitter.com/GordonTLong
AND FOR EVEN MORE TWITTER COVERAGE
![]()
| JANUARY | ||||||
| S | M | T | W | T | F | S |
| 1 | 2 | |||||
| 3 | 4 | 5 | 6 | 7 | 8 | 9 |
| 10 | 11 | 12 | 13 | 14 | 15 | 16 |
| 17 | 18 | 19 | 20 | 21 | 22 | 23 |
| 24 | 25 | 26 | 27 | 28 | 29 | 30 |
| 31 | ||||||
KEY TO TIPPING POINTS |
| 1- Bond Bubble |
| 2 - Risk Reversal |
| 3 - Geo-Political Event |
| 4 - China Hard Landing |
| 5 - Japan Debt Deflation Spiral |
| 6- EU Banking Crisis |
| 7- Sovereign Debt Crisis |
| 8 - Shrinking Revenue Growth Rate |
| 9 - Chronic Unemployment |
| 10 - US Stock Market Valuations |
| 11 - Global Governance Failure |
| 12 - Chronic Global Fiscal ImBalances |
| 13 - Growing Social Unrest |
| 14 - Residential Real Estate - Phase II |
| 15 - Commercial Real Estate |
| 16 - Credit Contraction II |
| 17- State & Local Government |
| 18 - Slowing Retail & Consumer Sales |
| 19 - US Reserve Currency |
| 20 - US Dollar |
| 21 - Financial Crisis Programs Expiration |
| 22 - US Banking Crisis II |
| 23 - China - Japan Regional Conflict |
| 24 - Corruption |
| 25 - Public Sentiment & Confidence |
| 26 - Food Price Pressures |
| 27 - Global Output Gap |
| 28 - Pension - Entitlement Crisis |
| 29 - Central & Eastern Europe |
| 30 - Terrorist Event |
| 31 - Pandemic / Epidemic |
| 32 - Rising Inflation Pressures & Interest Pressures |
| 33 - Resource Shortage |
| 34 - Cyber Attack or Complexity Failure |
| 35 - Corporate Bankruptcies |
| 36 - Iran Nuclear Threat |
| 37- Finance & Insurance Balance Sheet Write-Offs |
| 38- Government Backstop Insurance |
| 39 - Oil Price Pressures |
| 40 - Natural Physical Disaster |
Reading the right books?
No Time?

We have analyzed & included
these in our latest research papers Macro videos!
![]()
OUR MACRO ANALYTIC
CO-HOSTS
John Rubino's Just Released Book
![]()
Charles Hugh Smith's Latest Books
![]()
![]()
Our Macro Watch Partner
Richard Duncan Latest Books
MACRO ANALYTIC
GUESTS
F William Engdahl
![]()
![]()
![]()
![]()
![]()
OTHERS OF NOTE
![]()
![]()
![]()
![]()
Book Review- Five Thumbs Up
for Steve Greenhut's
Plunder!
![]()
TODAY'S TIPPING POINTS
|
Have your own site? Offer free content to your visitors with TRIGGER$ Public Edition!
Sell TRIGGER$ from your site and grow a monthly recurring income!
Contact [email protected] for more information - (free ad space for participating affiliates).
HOTTEST TIPPING POINTS |
Theme Groupings |
||
We post throughout the day as we do our Investment Research for: LONGWave - UnderTheLens - Macro
|
|||
|
MOST CRITICAL TIPPING POINT ARTICLES TODAY
|
|
||
2- RISK REVERSAL HAPPY NEW YEARWhat a Start!
Submitted by Tyler Durden on 01/04/2016 - 12:53 |
01-15-16 | 2- Risk Reversal | |
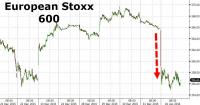
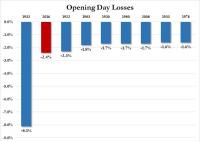
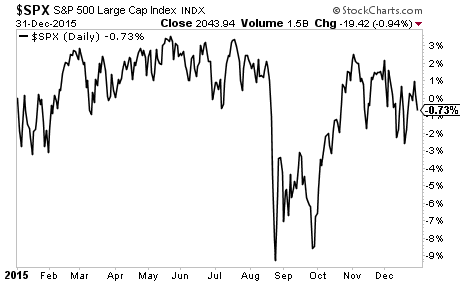
Three Reasons Stocks Will Crater in 2016Phoenix Capital Research on 01/04/2016 Last year (2015) likely will represent the top for the bull market that began in 2009. Stocks finished the year down, representing the first down year since the March 2009 bottom.
Many analysts will point to the August sell-off as the reason stocks performed so badly, however, looking at the chart, stocks struggled throughout the year, long before the August sell-off. Indeed, at best the S&P 500 was up 3% for the year! Things are only going to worsen from here. FIRST REASON - Fed Tightening
SECOND REASON - US Recession
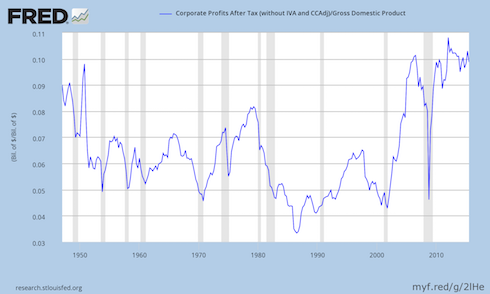
THIRD REASON - Profits Relative to GDP Rolling Over
With the US back in recession and the Fed tightening, both #s 1 and 2 are over. This leaves #3. And while productivity did increase marginally in first half of 2015, it’s now rolling over again towards 0%. In short, the sources of growth for US corporates have all dried up. Stocks have yet to adjust to this, but when they do it’s going to be an all out collapse. |
|||
TIPPING POINTS, STUDIES, THESIS, THEMES & SII COVERAGE THIS WEEK PREVIOUSLY POSTED - (BELOW)
|
|||
| MOST CRITICAL TIPPING POINT ARTICLES THIS WEEK - Jan 3rd, 2016 - Jan 9th, 2016 | |||
| TIPPING POINTS - This Week - Normally a Tuesday Focus | |||
| BOND BUBBLE | 1 | ||
| RISK REVERSAL - WOULD BE MARKED BY: Slowing Momentum, Weakening Earnings, Falling Estimates | 2 | ||
| GEO-POLITICAL EVENT | 3 | ||
| CHINA BUBBLE | 4 | ||
| JAPAN - DEBT DEFLATION | 5 | ||
EU BANKING CRISIS |
6 |
||
| TO TOP | |||
| MACRO News Items of Importance - This Week | |||
GLOBAL MACRO REPORTS & ANALYSIS |
|||
US ECONOMIC REPORTS & ANALYSIS |
|||
| CENTRAL BANKING MONETARY POLICIES, ACTIONS & ACTIVITIES | |||
| Market - WEDNESDAY STUDIES | |||
| STUDIES - MACRO pdf | |||
| TECHNICALS & MARKET | 12-30-15 |
STUDY | |
| COMMODITY CORNER - AGRI-COMPLEX | |||
| THESIS - Mondays Posts on Financial Repression & Posts on Thursday as Key Updates Occur | |||
| 2015 - FIDUCIARY FAILURE | 2015 | THESIS 2015 |  |
| 2014 - GLOBALIZATION TRAP | 2014 |  |
|
 |
|||
|
2013 2014 |
 |
||
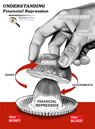
FINANCIAL REPRESSION |
01-04-16 | FINANCIAL REPRESSION |
|
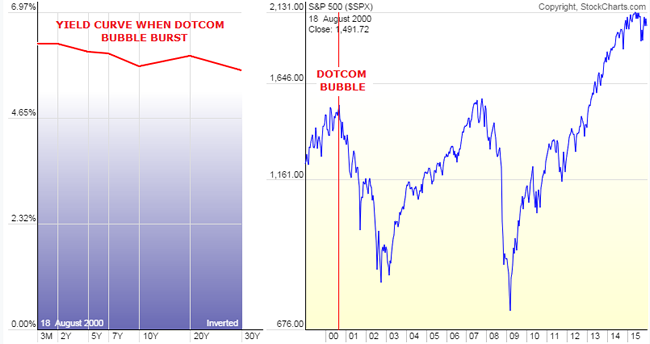
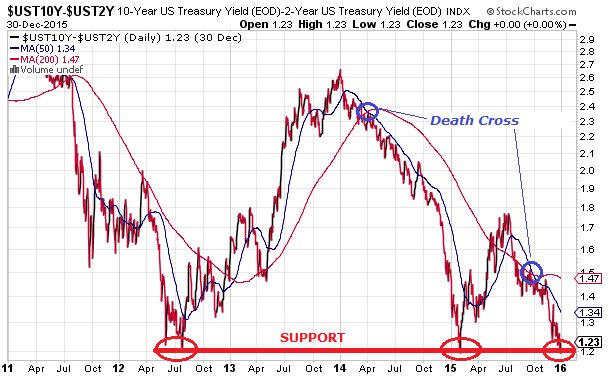
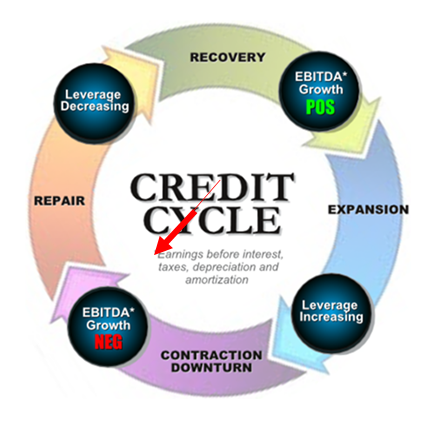
A “WITCH’S BREW” BUBBLING IN BOND ETFsWe believe the Credit Cycle has turned and with it will come some massive unexpected shocks. One of these will be the fall out in the Bond Market, centered around the dramatic growth explosion in Bond ETFs coupled with the post financial crisis regulatory changes that effectively removed banks from making markets in corporate bonds. It is a ‘Witch’s Brew’ with a flattening yield curve bringing it to a boil. 2000 – Flat to Inverted Yield Curve
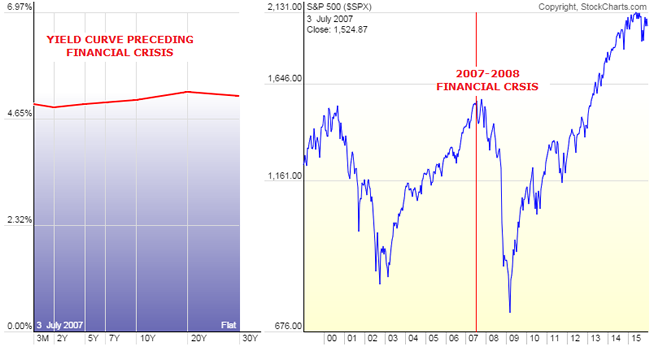
2007 – Flat Yield Curve
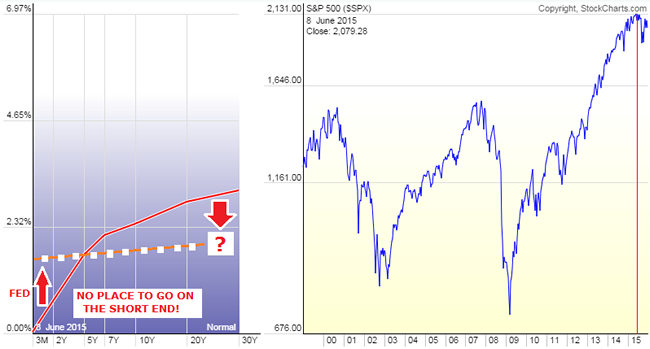
TODAY – Signalling a Flattening at Seriously Lower Bound!
PRESSURES FLATTENING THE YIELD CURVE
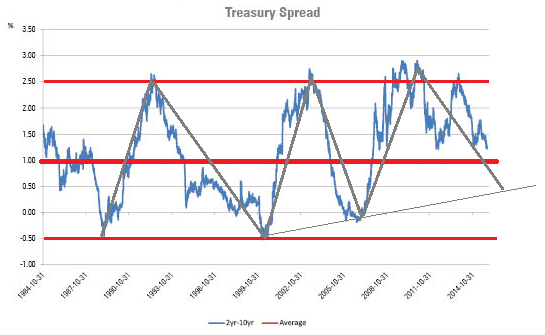
In the last six weeks, the spread between the Ten Year and the Two year treasuries has flattened exactly 25 basis points, which is EXACTLY the same amount that the Fed just moved the Fed Funds target rate this past Wednesday. With investors starved for yield many are being forced further out on the yield curve taking rates down further and pushing prices up. Dan Norcini at http://traderdan.com lays it out pretty clearly:
THE “WITCH’S BREW” Many Including Morningstar Have Hyped “The Great New Yield Opportunity”
What has been sold to many investors, speculators and even desperate Fund Managers is using Bond ETFs to play the old “Roll Down the Yield Curve” Strategy. Here is how it works in case you are not familiar with the strategy.
YRA HARRIS WARNS “ALL HELL MAY BREAK LOOSE!” Legendary trader Yra Harris who we recently interviewed at the Financial Repression Authority has been pounding the table for some time but just issued this warning:
CONCLUSION What Yra doesn’t say is we now have $2.2 Trillion of troubled High Yield bonds peddled to yield starved investors since the financial crisis, which matches 2/3’s of the $3.5 Trillion increase in the Federal Reserves balance sheet during the same period. Additionally, there are well north of $60 Trillion of Bond ETFs out there with anyone guess on how many fast money speculators are playing the “Rolling Down the Yield Curve” Strategy now up against the warning Morningstar so clearly disclaimed: “the roll down strategy will lose a lot of steam if the yield curve flattens more than expected.” With serious liquidity issues clearly evident it should be interesting as a potential positioning scramble ensues. It somewhat reminds me of someone potentially shouting “FIRE” in a theater, except this times the theater doors will be barred and the only way out will be to have someone outside take your seat inside! ETF holders may find it easier to sell that old bridge over the East River in Brooklyn than get their money out of their ETFs. Maybe what we will actually soon hear is someone shouting “CUSTODIAL RISK!”
|
|||
2011 2012 2013 2014 |
 |
||
| THEMES - Normally a Thursday "Themes" Post & a Friday "Flows" Post | |||
I - POLITICAL |
|||
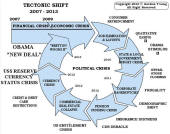
CENTRAL PLANNING - SHIFTING ECONOMIC POWER - STATISM
MACRO MAP - EVOLVING ERA OF CENTRAL PLANNING
|
G | THEME | |
| - - CRISIS OF TRUST - Era of Uncertainty | G | THEME | |
- - CORRUPTION & MALFEASANCE - MORAL DECAY - DESPERATION, SHORTAGES. |
US | THEME PAGE |  |
| - - SECURITY-SURVEILLANCE COMPLEX - STATISM | G | THEME | |
| - - CATALYSTS - FEAR (POLITICALLY) & GREED (FINANCIALLY) | G | THEME | |
II-ECONOMIC |
|||
| GLOBAL RISK | |||
| - GLOBAL FINANCIAL IMBALANCE - FRAGILITY, COMPLEXITY & INSTABILITY | G | THEME | |
| - - SOCIAL UNREST - INEQUALITY & A BROKEN SOCIAL CONTRACT | US | THEME | |
| - - ECHO BOOM - PERIPHERAL PROBLEM | M | THEME | |
| - -GLOBAL GROWTH & JOBS CRISIS | |||
| - - - PRODUCTIVITY PARADOX - NATURE OF WORK | THEME | MA w/ CHS |
|
| - - - STANDARD OF LIVING - EMPLOYMENT CRISIS, SUB-PRIME ECONOMY | US | THEME | MA w/ CHS |
III-FINANCIAL |
|||
|
FLOWS - Liqudity, Credit & Debt
|
MATA RISK ON-OFF |
THEME |
w/ R Duncan |
| CRACKUP BOOM - ASSET BUBBLE | 12-31-15 | THEME | |
| SHADOW BANKING - LIQUIDITY / CREDIT ENGINE | M | THEME | |
| GENERAL INTEREST |
|
||
| STRATEGIC INVESTMENT INSIGHTS - Weekend Coverage | |||
 |
|||
|
SII | ||
|
SII | ||
|
SII | ||
|
SII | ||
| TO TOP | |||


Read More - OUR RESEARCH - Articles Below

Tipping Points Life Cycle - Explained
Click on image to enlarge
TO TOP
 |
YOUR SOURCE FOR THE LATEST THINKING & RESEARCH
|
�
TO TOP