|
JOHN RUBINO'SLATEST BOOK |
|||||||||||||||||||||||||||||||||||||||||||||||||||||||||||||||||||||||||||||||||||||||||||||||||||||||||||||||||||||||||||||||||||||||||||||||||||||||||||||||||||||||||||||||||||||||||||||||||||||||||||||||||||||||||||||||||||||||||||||||||||||||||||||||||||||||||||||||||||||||||||||
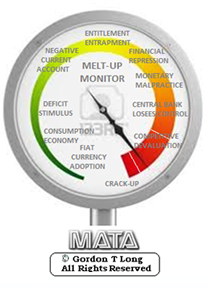
"MELT-UP MONITOR "
Meltup Monitor: FLOWS - The Currency Cartel Carry Cycle - 09 Dec 2013 Meltup Monitor: FLOWS - Liquidity, Credit & Debt - 04 Dec 2013 Meltup Monitor: Euro Pressure Going Critical - 28- Nov 2013 Meltup Monitor: A Regression-to-the-Exponential Mean Required - 25 Nov 2013
|

![]()
"DOW 20,000 "
Lance Roberts Charles Hugh Smith John Rubino Bert Dohman & Ty Andros
|

HELD OVER
Currency Wars
Euro Experiment
Sultans of Swap
Extend & Pretend
Preserve & Protect
Innovation
Showings Below
"Currency Wars "
|


"SULTANS OF SWAP" archives open ACT II ACT III
ALSO Sultans of Swap: Fearing the Gearing! Sultans of Swap: BP Potentially More Devistating than Lehman! |
"EURO EXPERIMENT"
archives open EURO EXPERIMENT : ECB's LTRO Won't Stop Collateral Contagion!
EURO EXPERIMENT: |
![]()
"INNOVATION"
archives open |

"PRESERVE & PROTE CT"
archives open |

Thurs. Apr. 23rd, 2015
Follow Our Updates
on TWITTER
https://twitter.com/GordonTLong
AND FOR EVEN MORE TWITTER COVERAGE
STRATEGIC INVESTMENT INSIGHTS
 2015 THESIS: FIDUCIARY FAILURE
NOW AVAILABLE FREE to Trial Subscribers
174 Pages
What Are Tipping Poinits?
Understanding Abstraction & Synthesis
Global-Macro in Images: Understanding the Conclusions
![]()
| APRIL | ||||||
| S | M | T | W | T | F | S |
| 1 | 2 | 3 | 4 | |||
| 5 | 6 | 7 | 8 | 9 | 10 | 11 |
| 12 | 13 | 14 | 15 | 16 | 17 | 18 |
| 19 | 20 | 21 | 22 | 23 | 24 | 25 |
| 26 | 27 | 28 | 29 | 30 | ||
KEY TO TIPPING POINTS |
| 1- Bond Bubble |
| 2 - Risk Reversal |
| 3 - Geo-Political Event |
| 4 - China Hard Landing |
| 5 - Japan Debt Deflation Spiral |
| 6- EU Banking Crisis |
| 7- Sovereign Debt Crisis |
| 8 - Shrinking Revenue Growth Rate |
| 9 - Chronic Unemployment |
| 10 - US Stock Market Valuations |
| 11 - Global Governance Failure |
| 12 - Chronic Global Fiscal ImBalances |
| 13 - Growing Social Unrest |
| 14 - Residential Real Estate - Phase II |
| 15 - Commercial Real Estate |
| 16 - Credit Contraction II |
| 17- State & Local Government |
| 18 - Slowing Retail & Consumer Sales |
| 19 - US Reserve Currency |
| 20 - US Dollar Weakness |
| 21 - Financial Crisis Programs Expiration |
| 22 - US Banking Crisis II |
| 23 - China - Japan Regional Conflict |
| 24 - Corruption |
| 25 - Public Sentiment & Confidence |
| 26 - Food Price Pressures |
| 27 - Global Output Gap |
| 28 - Pension - Entitlement Crisis |
| 29 - Central & Eastern Europe |
| 30 - Terrorist Event |
| 31 - Pandemic / Epidemic |
| 32 - Rising Inflation Pressures & Interest Pressures |
| 33 - Resource Shortage |
| 34 - Cyber Attack or Complexity Failure |
| 35 - Corporate Bankruptcies |
| 36 - Iran Nuclear Threat |
| 37- Finance & Insurance Balance Sheet Write-Offs |
| 38- Government Backstop Insurance |
| 39 - Oil Price Pressures |
| 40 - Natural Physical Disaster |
Reading the right books?
No Time?

We have analyzed & included
these in our latest research papers Macro videos!
![]()
OUR MACRO ANALYTIC
CO-HOSTS
John Rubino's Just Released Book
![]()
Charles Hugh Smith's Latest Books
![]()
![]()
Our Macro Watch Partner
Richard Duncan Latest Books
MACRO ANALYTIC
GUESTS
F William Engdahl

![]()
![]()

![]()
![]()

![]()
OTHERS OF NOTE
![]()
![]()
![]()


![]()
Book Review- Five Thumbs Up
for Steve Greenhut's
Plunder!
![]()
![]()
TODAY'S TIPPING POINTS
|
![]() Scroll TWEETS for LATEST Analysis
Scroll TWEETS for LATEST Analysis ![]()
HOTTEST TIPPING POINTS |
Theme Groupings |
||||||||||
We post throughout the day as we do our Investment Research for: LONGWave - UnderTheLens - Macro |
|||||||||||
"BEST OF THE WEEK "
|
Posting Date |
Labels & Tags | TIPPING POINT or THEME / THESIS or INVESTMENT INSIGHT |
||||||||
|
MOST CRITICAL TIPPING POINT ARTICLES TODAY
|
|
||||||||||
|
|||||||||||
|
Exploding Public Pension Costs Hit Public Employee Wages 04-21-15 In the past, the Manhattan Institute has effectively highlighted how rising California public pension costs are cutting into “basic infrastructure maintenance, public safety, education, and quality-of-life services such as parks and libraries.” But in the newest report, “Pension Costs are Crowding Out Salaries,” by Senior Fellow Stephen D. Eide, the Manhattan Institute reveals how California public employees themselves are suffering. In a decade where pension costs rose by 135 percent and healthcare premiums by 85 percent, public sector wages grew 4.6 percent slower than private sector workers’ salaries.Public pensions in California are among the richest in the nation, and union resistance to shifting more costs to deductibles and co-pays has caused government employers’ insurance premium expenses to climb faster than in the private sector. Local government staffing levels in California also “remained eight percent below where they were in December 2007,” according to the report, while “private-sector job levels…were 2.4 percent higher.” But current employee salaries are being trimmed and their benefits have been lowered to subsidize the cost of retirees and older public workers’ benefits. Thanks to California’s Public Employees’ Pension Reform Act of 2013, state, county and municipal government entities have found themselves forced to divert revenues to backfill pension promises made to prior generations of employees. Pension reformers’ claims that they are not anti-worker are starting to resonate with younger public employees. The Manhattan Institute suggests a reformed pension system should be one better-positioned to make good on its promises. They point out that legal guarantees have amounted to little when there was no money left in bankrupt Rhode Island, Central Falls, Pritchard, Alabama and Detroit. California public employees claim they have some of the “strongest legal prohibitions against pension changes in the nation.” But when governments can’t touch pensions, they have been hitting younger workers with furloughs, lay-offs and reduced pay grades. The Manhattan Institute concludes that “guaranteed “retirement security” for some is only possible at a cost of job and wage insecurity for others. Public employees have already lost the “the public’s hearts and minds.” The most recent Reason-Rupe Public Opinion Poll found that “private sector workers—who largely fund government workers’ defined benefit pensions—strongly favor shifting current employees to 401k style accounts by a margin of 65 to 31 percent.” Interestingly, a slimmer majority of government workers “would also favor such a reform if it only applied to future government workers, and not themselves” by 54 percent in favor to 43 percent opposed. Younger government workers are painfully aware that they are paying a steep price to subsidize retirees and older workers who have substantially better benefits than they will ever achieve. When the Reason-Rupe survey asked respondents if they would favor 401k-style accounts for government workers if it meant “benefits were not guaranteed and would depend on how well the employees and government save and invest,” 57 percent of private sector workers continue to favor such a transition. But 61 percent of public employees would oppose this move. The Manhattan Institute adds: “The most persuasive case for pension reform remains the effect on services and government budgets more generally. Perhaps union leadership and members will never come around, but the facts remain. Unchecked growth in pension costs means lower wages for government employees.”
|
2015 | THESIS 2015 |  |
||||||||
|
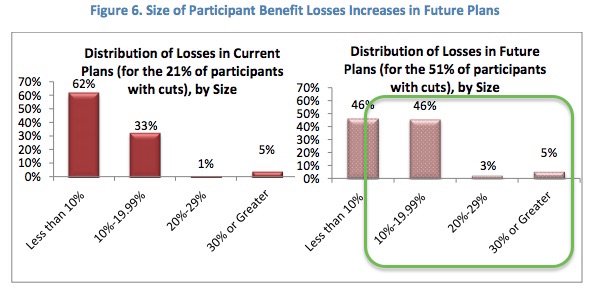
Government Admits It Can't Fully Guarantee 51% Of Insolvent Pension Plans Earlier this month we outlined why it is a bad time to be a pensioner. Among the issues we identified were the 18% increase in EU corporate pension deficits occasioned by the use of a lower discount rate in the calculation of the present value of liabilities (thank you Mario Draghi), US public sector pension plans’ shift away from fixed income and towards more risky investments due to an express unwillingness to adopt more realistic investment rate assumptions (because that would mean lowering the liability discount rate), and a rumor (which just today was confirmed as fact) that Greece will indeed look to plunder pensions in order to stay afloat. In the most recent example of why pensioners in the US should perhaps be a bit concerned about the security of their benefits, a new report suggests that the government agency in charge of backstopping private-sector pension plans (the Pension Benefit Guaranty Corporation) isn’t entirely optimistic about its own ability to provide an effective safety net for multiemployer plans.
As the following chart shows, the agency is doing a fairly decent job when it comes to participants in plans that are currently insolvent and receiving assistance, but when it comes to backing up plans that are “likely to need assistance in the future,” the outlook is not good, with more than half of participants suffering a reduction in benefits...
Worse still, of the 51% who will have their benefits cut, 54% will see cuts of 10% or more…
Importantly, the PBGC only looked at currently insolvent plans or terminated plans. It did not take into account plans which it believes will be insolvent sometime within the next decade. Were those numbers included, the agency says that “the risk and magnitude of benefit loss increases dramatically [and] the gap between promised benefits and guarantees widens further.” Here’s why (via Pension Investments again):
* * * We’ll leave you with the following from the PBGC’s 2014 annual report:
|
2015 | THESIS 2015 | |
||||||||
| MOST CRITICAL TIPPING POINT ARTICLES THIS WEEK - April 19th, 2015 - Apr. 25th, 2015 | |||||||||||
| BOND BUBBLE | 1 | ||||||||||
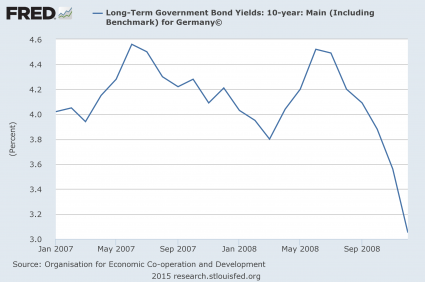
BOND BUBBLE - The Last Time Bond Yields Crashed Like This Guess What Happened The Last Time Bond Yields Crashed Like This...04-21-05 Michael Snyder via The Economic Collapse blog If a major financial crisis was approaching, we would expect to see the “smart money” getting out of stocks and pouring into government bonds that are traditionally considered to be “safe” during a crisis. This is called a “flight to safety” or a “flight to quality“. In the past, when there has been a “flight to quality” we have seen yields for German government bonds and U.S. government bonds go way down. As you will see below, this is exactly what we witnessed during the financial crisis of 2008. U.S. and German bond yields plummeted as money from the stock market was dumped into bonds at a staggering pace. Well, it is starting to happen again. In recent months we have seen U.S. and German bond yields begin to plummet as the “smart money” moves out of the stock market. So is this another sign that we are on the precipice of a significant financial panic? Back in 2008, German bonds actually began to plunge well before U.S. bonds did. Does that mean that European money is “smarter” than U.S. money? That would certainly be a very interesting theory to explore. As you can see from the chart below, the yield on 10 year German bonds started to fall significantly during the summer of 2008 – several months before the stock market crash in the fall…
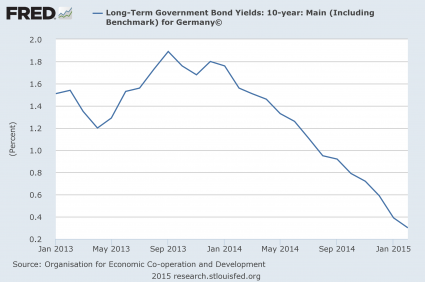
So what are German bonds doing today? As you can see from this next chart, the yield on 10 year German bonds has been steadily falling since the beginning of last year. At this point, the yield on 10 year German bonds is just barely above zero…
And amazingly, most German bonds that have a maturity of less than 10 years actually have a negative yield right now. That means that investors are going to get back less money than they invest. This is how bizarre the financial markets have become. The “smart money” is so concerned about the “safety” of their investments that they are actually willing to accept negative yields. I don’t know why anyone would ever put their money into investments that have a negative yield, but it is actually happening. The following comes from Yahoo…
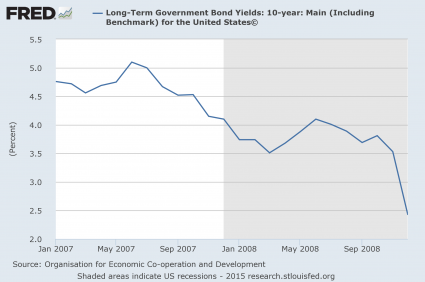
Yes, the ECB is driving a lot of this, but it is still truly bizarre. So what about the United States? Well, first let’s take a look at what happened back in 2008. In the chart below, you can see the “flight to safety” that took place in late 2008 as investors started to panic…
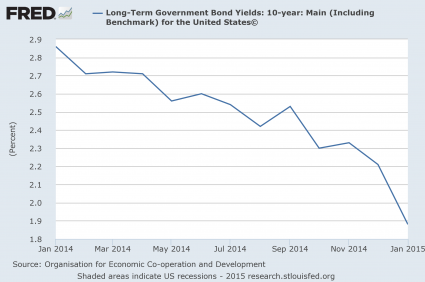
And we have started to witness a similar thing happen in recent months. The yield on 10 year U.S. Treasuries has plummeted as investors have looked for safety. This is exactly the kind of chart that we would expect to see if a financial crisis was brewing…
What makes all of this far more compelling is the fact that so many other patterns that we have witnessed just prior to past financial crashes are happening once again. Yes, there are other potential explanations for why bond yields have been going down. But when you add this to all of the other pieces of evidence that a new financial crisis is rapidly approaching, quite a compelling case emerges. For those that do not follow my website regularly, I encourage you to check out the following articles to get an idea of what I am talking about… -“Guess What Happened The Last Time The Price Of Oil Crashed Like This?…” -“Not Just Oil: Guess What Happened The Last Time Commodity Prices Crashed Like This?…” -“10 Key Events That Preceded The Last Financial Crisis That Are Happening Again RIGHT NOW” -“Guess What Happened The Last Time The U.S. Dollar Skyrocketed In Value Like This?…” -“7 Signs That A Stock Market Peak Is Happening Right Now” -“Guess What Happened The Last Two Times The S&P 500 Was Up More Than 200% In Six Years?” Of course no two financial crashes ever look exactly the same. The crisis that we are moving toward is not going to be precisely like the crisis of 2008. But there are similarities and patterns that we can look for. When things start to get bad, investors act in predictable ways. And so many of the things that we are watching right now are just what we would expect to see in the lead up to a major financial crisis. Sadly, most people are not willing to learn from history. Even though it is glaringly apparent that we are in a historic financial bubble, most investors on Wall Street cannot see it because they do not want to see it. They want to believe that somehow “things are different this time” and that stocks will just continue to go up indefinitely so that they can keep making lots and lots of money. And despite what you may think, I actually want this bubble to continue for as long as possible. Despite all of our problems, life is still relatively good in America today – at least compared to what is coming. I like to refer to this next crisis as our “third strike”. Back in 2000 and 2001, the dotcom bubble burst and we experienced a painful recession, but we didn’t learn any lessons. That was strike number one. Then came the financial crash of 2008 and the worst economic downturn since the Great Depression. But we didn’t learn any lessons from that either. Instead, we just reinflated the same old financial bubbles and kept on making the exact same mistakes as before. That was strike number two. This next financial crisis will be strike number three. After this next crisis, I don’t believe that there will ever be a return to “normal” for the United States. I believe that this is going to be the crisis that unleashes hell in our nation. So no, I am not eager for that to come. Even though there is no way that this bubble of debt-fueled false prosperity can last indefinitely, I would like for it to last at least a little while longer. Because what comes after it is going to be truly terrible.
|
04-22-15 | STUDY | 1- Bond Bubble | ||||||||
| RISK REVERSAL - WOULD BE MARKED BY: Slowing Momentum, Weakening Earnings, Falling Estimates | 2 | ||||||||||
| CHINA BUBBLE | 4 | ||||||||||
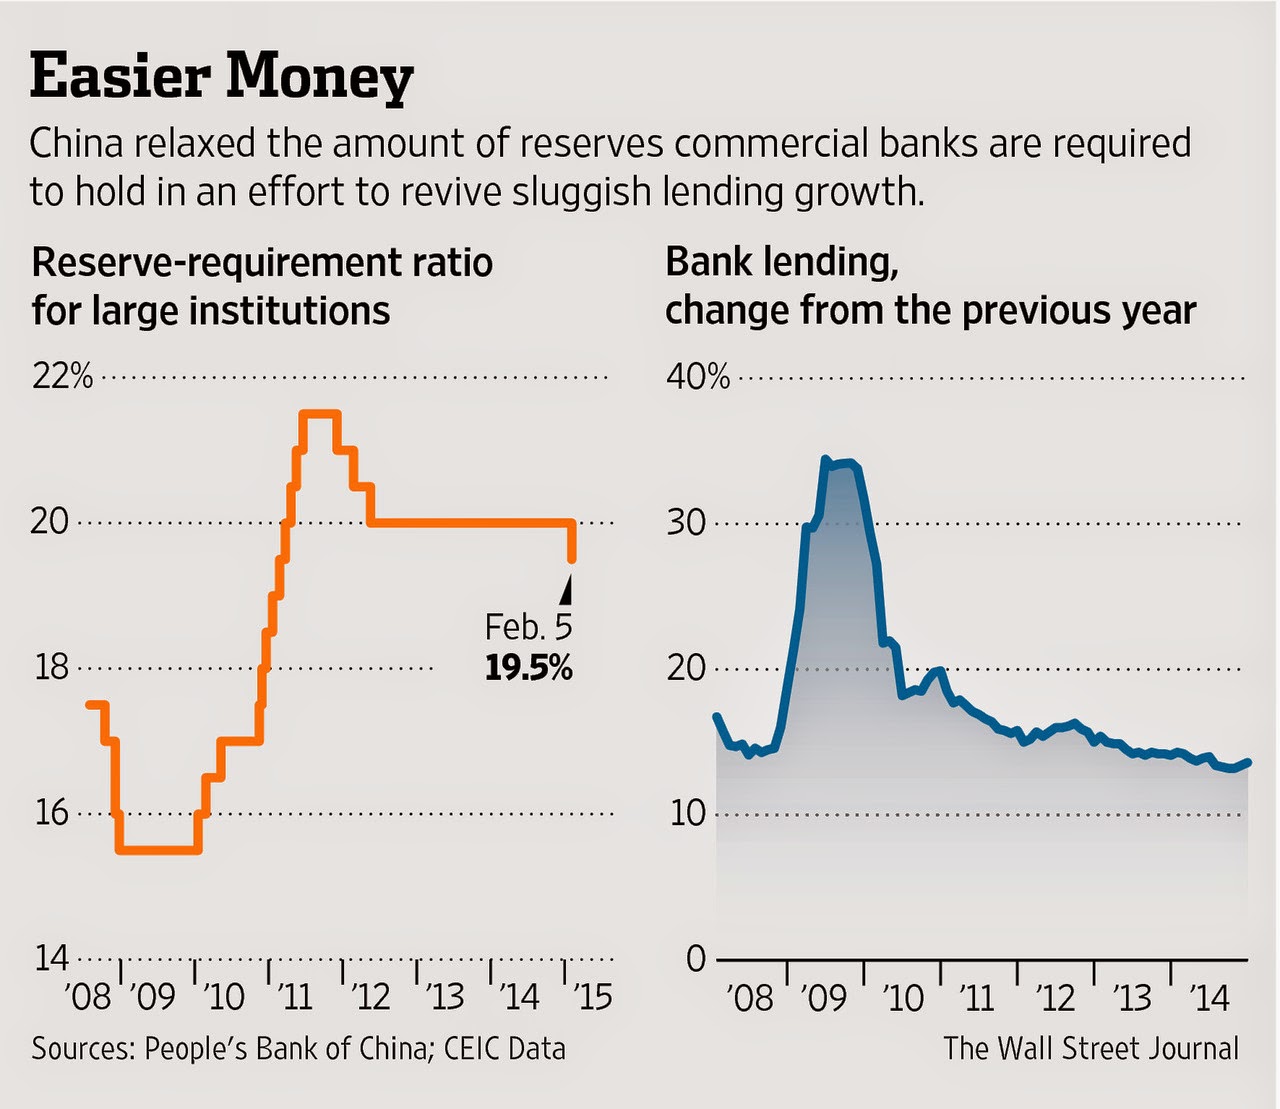
CHINA - Beginning to Panic! China Easing to Combat The 'Darkest Period' of 2015 04-20-15 By EconMatters PBOC Easing China is now firmly in stimulus mode when PBOC announced on Sunday to cut the reserve-requirement ratio by 1% to 18.5% effective April 20. This is the second reduction this year and the largest since November 2008 during the global financial crisis. The reserve-requirement ratio represents the minimum fraction of customer deposits and notes that each commercial bank must hold as reserves in cash. The new 18.5% ratio required by China is still higher than the typical global standard and than the current 10% cap by the U.S. Federal Reserve. The PBOC also announced an additional 100 bps cut for rural credit cooperatives and village banks, as well as a 200 basis point cut for the China Agricultural Development Bank.
1Q15 The 'Darkest Period' Bloomberg quoted Larry Hu, head of China economics at Macquarie in Hong Kong call 1Q15 the “darkest period” this year for China's economy. GDP was 7% in Q1, the slowest since 2009, while industrial production in March rose at the slowest rate since November 2008, and inflation turned negative for the first time since 2009. (Read: Bloomberg Analyst Returned From China 'Terrified for the Economy') Hu now expects further easing with an interest-rate cut within a month (PBOC has already cut interest rates twice since November), increasing infrastructure spending and a relaxation of home-purchasing rules. My contacts in China and Hong Kong indicated that the new crackdown by Xi on corruption and state largess has put a fairly large portion of the nation's businesses (in mainland and Hong Kong) once catering to the 'elite' rich class in China out of commission. This is one of the major contributing factors to the nation's slowing growth. $100 Billion Liqudity Shanghai Composite Index
A Desperate Move Economists think this decision could be a prelude to more easing measures to counter further slowdown in growth this year, which could only lead to a bigger bubble, and a more disastrous crash somewhere down the road. |
04-21-15 | MACRO MONETARY PBOC |
4 - China Hard Landing | ||||||||
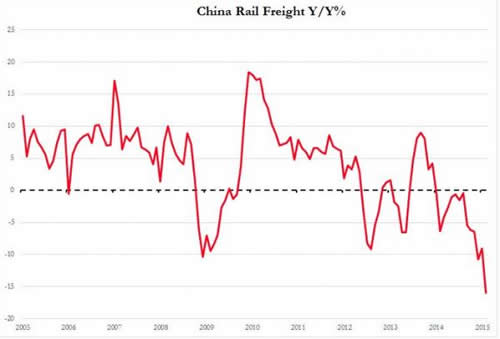
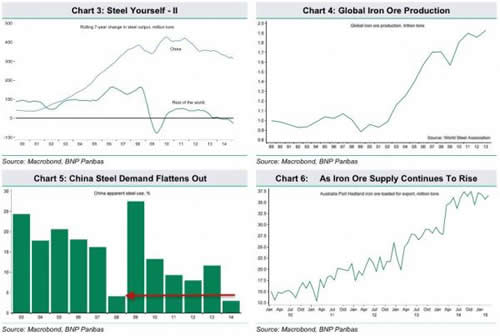
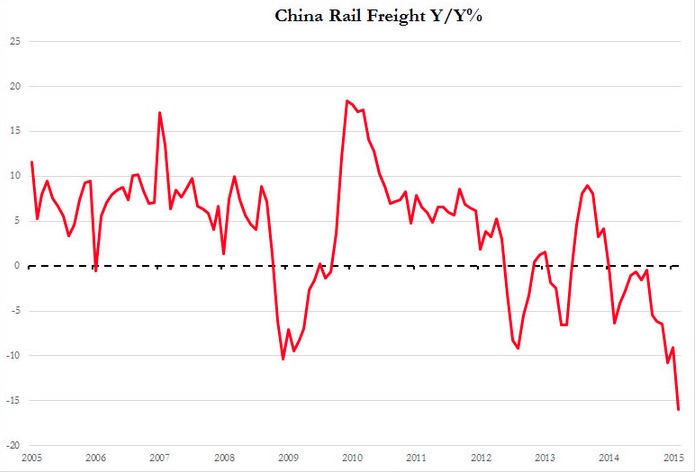
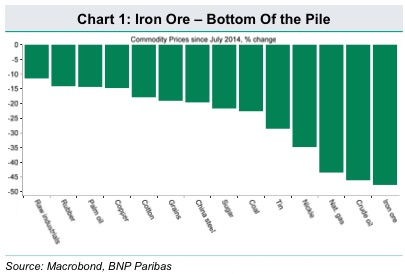
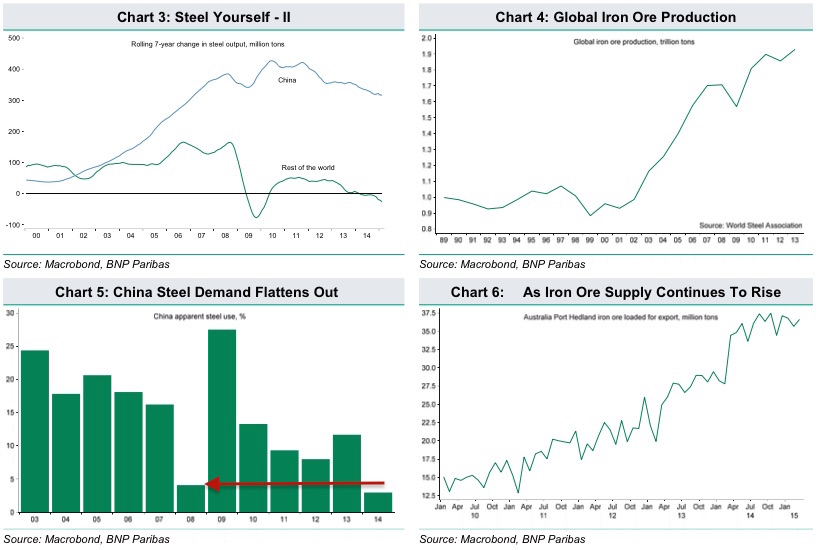
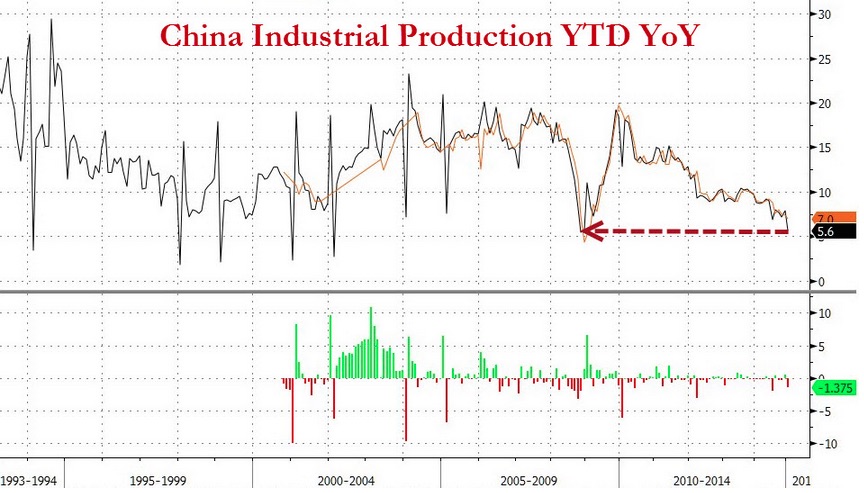
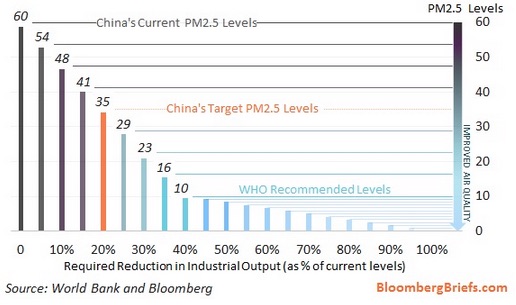
CHINA - Skewed Heavily To The Downside," BNP Says Chinese Economic Outlook "Skewed Heavily To The Downside," BNP Says 04-20-15 BNP via ZH Over the past several months we’ve built on several narratives out of China certainly not the least of which is the idea that economic growth in the country is decelerating quickly at a time when accelerating capital outflows make devaluation an unpalatable (if inevitable) proposition. Signs of a dramatic slowdown were on full display earlier this month when GDP growth slipped to 7%, the slowest pace in six years, while key indicators such as rail freight volume have fallen completely off a cliff: With the country’s tough transition to a service-based economy being made all the more difficult by the hit industrial production will likely take as Beijing ramps up efforts to fight a pollution problem that was thrust back into the spotlight early last month thanks to a viral documentary, it’s reasonable to suspect we’ll be seeing a lot more of the idle cranes, empty construction sites, and half-finished abandoned buildings that greeted Bloomberg metals analyst Kenneth Hoffman who returned from a tour of the country earlier this month. Ultimately, Hoffman’s assessment was that metals demand in China is collapsing and isn’t likely to pick back up for the foreseeable future. This is bad news for the Chinese economic machine and it’s also bad news for any iron ore miner out there whose marginal costs aren’t low enough to stay profitable in the face of a protracted downturn in prices because if you can’t convince the big guys that your price collusion idea will pass regulatory muster, well, they’ll likely take the opportunity to keep right on producing despite the slump and run you out of business. With the stage thus set, we bring you the following from BNP who explains why iron ore prices aren’t likely to rebound any time soon, and why the economic outlook for China is indeed “as bad as the data looks, if not worse” (to quote Mr. Hoffman). Via BNP:
As a reminder, here’s the graphic on the relationship between industrial production and efforts to remedy the country’s pollution problem:
And that, ladies and gentlemen, is the decisively precarious situation that Beijing finds itself in as China attempts to project its economic and military prowess to the rest of the world. Call it the growing pains of a rising superpower, but don't call it an enviable position and don't be surprised to discover that contrary to what the Ministry of Finance steadfastly proclaims, there may indeed be such a thing as Chinese QE.
|
04-21-15 | CHINA | 4 - China Hard Landing | ||||||||
| JAPAN - DEBT DEFLATION | 5 | ||||||||||
EU BANKING CRISIS |
6 |
||||||||||
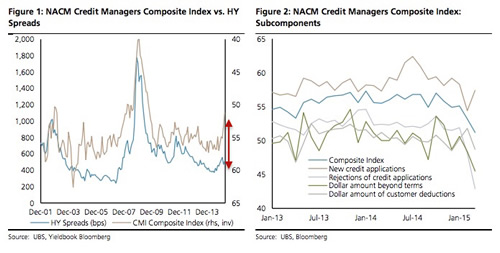
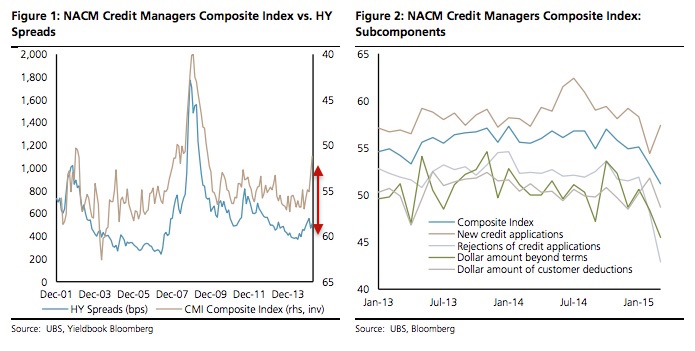
BOND BUBBLE - Credit Measures At Worst Levels Since The Crisis Warning: This Measure Of Credit Is At Its Worst Level Since The Crisis 04-21-15 Zero Hedge As we’ve pointed out on a number of occasions, there’s been no shortage of corporate debt issuance this year as high grade supply in the US hit a record $348 billion in Q1 helped by a blockbuster month in March which saw $143 billion in deals price. Meanwhile, high yield issuance came in at more than $90 billion for the period. Despite goldilocks (to use a financial market cliche) conditions characterized by the interplay between yield-starved investors, rock-bottom borrowing costs, and companies’ propensity to leverage their balance sheet in order to inflate earnings and underwrite their stock price, at least one leading indicator is flashing red. As UBS notes, trade credit indicators are now at their worst levels since the crisis and unfortunately for anyone piling money into junk bonds, tightening conditions in the financing of receivables and inventories turns out to be a very good predictor of where HY spreads are headed. Here’s more:
|
04-22-15 | STUDY | 16 - Credit Contraction II | ||||||||
| TO TOP | |||||||||||
| MACRO News Items of Importance - This Week | |||||||||||
GLOBAL MACRO REPORTS & ANALYSIS |
|||||||||||
US ECONOMIC REPORTS & ANALYSIS |
|||||||||||
| CENTRAL BANKING MONETARY POLICIES, ACTIONS & ACTIVITIES | |||||||||||
| Market | |||||||||||
| TECHNICALS & MARKET |
|
||||||||||
| STUDIES - MACRO pdf | |||||||||||
BOND BUBBLE - The Last Time Bond Yields Crashed Like This Guess What Happened The Last Time Bond Yields Crashed Like This...04-21-05 Michael Snyder via The Economic Collapse blog If a major financial crisis was approaching, we would expect to see the “smart money” getting out of stocks and pouring into government bonds that are traditionally considered to be “safe” during a crisis. This is called a “flight to safety” or a “flight to quality“. In the past, when there has been a “flight to quality” we have seen yields for German government bonds and U.S. government bonds go way down. As you will see below, this is exactly what we witnessed during the financial crisis of 2008. U.S. and German bond yields plummeted as money from the stock market was dumped into bonds at a staggering pace. Well, it is starting to happen again. In recent months we have seen U.S. and German bond yields begin to plummet as the “smart money” moves out of the stock market. So is this another sign that we are on the precipice of a significant financial panic? Back in 2008, German bonds actually began to plunge well before U.S. bonds did. Does that mean that European money is “smarter” than U.S. money? That would certainly be a very interesting theory to explore. As you can see from the chart below, the yield on 10 year German bonds started to fall significantly during the summer of 2008 – several months before the stock market crash in the fall…
So what are German bonds doing today? As you can see from this next chart, the yield on 10 year German bonds has been steadily falling since the beginning of last year. At this point, the yield on 10 year German bonds is just barely above zero…
And amazingly, most German bonds that have a maturity of less than 10 years actually have a negative yield right now. That means that investors are going to get back less money than they invest. This is how bizarre the financial markets have become. The “smart money” is so concerned about the “safety” of their investments that they are actually willing to accept negative yields. I don’t know why anyone would ever put their money into investments that have a negative yield, but it is actually happening. The following comes from Yahoo…
Yes, the ECB is driving a lot of this, but it is still truly bizarre. So what about the United States? Well, first let’s take a look at what happened back in 2008. In the chart below, you can see the “flight to safety” that took place in late 2008 as investors started to panic…
And we have started to witness a similar thing happen in recent months. The yield on 10 year U.S. Treasuries has plummeted as investors have looked for safety. This is exactly the kind of chart that we would expect to see if a financial crisis was brewing…
What makes all of this far more compelling is the fact that so many other patterns that we have witnessed just prior to past financial crashes are happening once again. Yes, there are other potential explanations for why bond yields have been going down. But when you add this to all of the other pieces of evidence that a new financial crisis is rapidly approaching, quite a compelling case emerges. For those that do not follow my website regularly, I encourage you to check out the following articles to get an idea of what I am talking about… -“Guess What Happened The Last Time The Price Of Oil Crashed Like This?…” -“Not Just Oil: Guess What Happened The Last Time Commodity Prices Crashed Like This?…” -“10 Key Events That Preceded The Last Financial Crisis That Are Happening Again RIGHT NOW” -“Guess What Happened The Last Time The U.S. Dollar Skyrocketed In Value Like This?…” -“7 Signs That A Stock Market Peak Is Happening Right Now” -“Guess What Happened The Last Two Times The S&P 500 Was Up More Than 200% In Six Years?” Of course no two financial crashes ever look exactly the same. The crisis that we are moving toward is not going to be precisely like the crisis of 2008. But there are similarities and patterns that we can look for. When things start to get bad, investors act in predictable ways. And so many of the things that we are watching right now are just what we would expect to see in the lead up to a major financial crisis. Sadly, most people are not willing to learn from history. Even though it is glaringly apparent that we are in a historic financial bubble, most investors on Wall Street cannot see it because they do not want to see it. They want to believe that somehow “things are different this time” and that stocks will just continue to go up indefinitely so that they can keep making lots and lots of money. And despite what you may think, I actually want this bubble to continue for as long as possible. Despite all of our problems, life is still relatively good in America today – at least compared to what is coming. I like to refer to this next crisis as our “third strike”. Back in 2000 and 2001, the dotcom bubble burst and we experienced a painful recession, but we didn’t learn any lessons. That was strike number one. Then came the financial crash of 2008 and the worst economic downturn since the Great Depression. But we didn’t learn any lessons from that either. Instead, we just reinflated the same old financial bubbles and kept on making the exact same mistakes as before. That was strike number two. This next financial crisis will be strike number three. After this next crisis, I don’t believe that there will ever be a return to “normal” for the United States. I believe that this is going to be the crisis that unleashes hell in our nation. So no, I am not eager for that to come. Even though there is no way that this bubble of debt-fueled false prosperity can last indefinitely, I would like for it to last at least a little while longer. Because what comes after it is going to be truly terrible.
|
04-22-15 | STUDY | 1- Bond Bubble | ||||||||
BOND BUBBLE - Credit Measures At Worst Levels Since The Crisis Warning: This Measure Of Credit Is At Its Worst Level Since The Crisis 04-21-15 Zero Hedge As we’ve pointed out on a number of occasions, there’s been no shortage of corporate debt issuance this year as high grade supply in the US hit a record $348 billion in Q1 helped by a blockbuster month in March which saw $143 billion in deals price. Meanwhile, high yield issuance came in at more than $90 billion for the period. Despite goldilocks (to use a financial market cliche) conditions characterized by the interplay between yield-starved investors, rock-bottom borrowing costs, and companies’ propensity to leverage their balance sheet in order to inflate earnings and underwrite their stock price, at least one leading indicator is flashing red. As UBS notes, trade credit indicators are now at their worst levels since the crisis and unfortunately for anyone piling money into junk bonds, tightening conditions in the financing of receivables and inventories turns out to be a very good predictor of where HY spreads are headed. Here’s more:
|
04-22-15 | STUDY | 16 - Credit Contraction II | ||||||||
| COMMODITY CORNER - AGRI-COMPLEX | PORTFOLIO | ||||||||||
| SECURITY-SURVEILANCE COMPLEX | PORTFOLIO | ||||||||||
| THESIS - Mondays Posts on Financial Repression & Posts on Thursday as Key Updates Occur | |||||||||||
| 2015 - FIDUCIARY FAILURE | 2015 | THESIS 2015 | |
||||||||
| 2014 - GLOBALIZATION TRAP | 2014 |  |
|||||||||
 |
|||||||||||
|
2013 2014 |
 |
||||||||||
FINANCIAL REPRESSION - Net Bank Interest Financial Repression, Central Banks, Credit Expansion, and the Importance of Being Impatient 04-06-15 John Mauldin We live in a time of unprecedented financial repression. As I have continued writing about this, I have become increasingly angry about the fact that central banks almost everywhere have decided to address the economic woes of the world by driving down the returns on the savings of those who can least afford it – retirees and pensioners. This week’s Outside the Box, from my good friend Chris Whalen of Kroll Bond Rating Agency, goes farther and outlines how a low-interest-rate and massive QE environment is also destructive of other parts of the economy. Counterintuitively, the policies pursued by central banks are actually driving the deflationary environment rather than fighting it.
It is of the highest irony that Keynesians wanted to launch a QE policy that would increase the value of financial assets (like stocks), which they claimed would produce a wealth effect. I made fun of this policy some five years ago by calling it “trickle-down monetary policy.” Subsequent research has verified that there is no wealth effect from QE. Well, it did make our stocks go up, on the backs of savers. We’ve transferred interest income from savers into the stock market. We’ve made retirement far riskier for our older pensioners than it should be. As Chris Whalen writes: Indeed, in the present interest rate environment, to paraphrase John Dizard of the Financial Times, it has become mathematically impossible for fiduciaries [brokers, investment advisors and managers of pension funds and annuities] to meet the beneficiaries’ future investment return target needs through the prudent buying of securities. Everywhere I go I talk with investment advisors and brokers who are scratching their heads trying to figure out how to create retirement portfolios that provide sufficient income without significantly moving out the risk curve at precisely the wrong time in their client’s lives. It is a conundrum that has been made for more difficult by Federal Reserve policy. Economics Professor Larry Kotlikoff (Boston University) and our mutual friend syndicated financial columnist Scott Burns came by to visit me last week. I have talked with Larry on and off over the last few years, and Scott and I go back literally decades. A few years ago, Scott and Larry wrote a very good book called The Clash of Generations. Now, Larry has branched off on his own and written a really powerful manual on Social Security called Get What's Yours: The Secrets to Maxing Out Your Social Security. I will admit I have not paid much attention to Social Security. I just assumed I should start mine when I’m 70, as so many columns I have read suggested. Larry and I recently spent an hour discussing the Social Security system (or perhaps it would be better to call it the Social Security Maze). Three thousand pages of law and tens of thousands of regulations and so many nuances and “gotchas” that it is really difficult to understand what might be best in your particular circumstances. Larry asked me questions for about two minutes and then proceeded to make me $40,000 over the next five years. It turns out I qualify for an obscure (at least to me) regulation that allows me to get some Social Security income for four years prior to turning 70 without affecting my post-70 benefits. There are scores of such obscure rules. Larry says it is more often the case than not that he can sit down with somebody and make them more money than they thought they were going to get. As one reviewer says: This book is necessary for three reasons:
If you or your parents are on Social Security or you are approaching “that age,” you really should get this book. Did you know that if you are divorced you can get a check for half of your former spouse’s Social Security income without affecting their income at all? But you can’t know whether this is a good strategy unless you look at other options. How many retirees or those nearing retirement know about such Social Security options as file and suspend (apply for benefits and then don’t take them)? Or start stop start (start benefits, stop them, then restart them)? Or– just as important – when and how to use these techniques? Get What’s Yours covers the most frequent benefit scenarios faced by married retired couples, by divorced retirees, by widows and widowers, among others. It explains what to do if you’re a retired parent of dependent children, disabled, or an eligible beneficiary who continues to work, and how to plan wisely before retirement. It addresses the tax consequences of your choices, as well as the financial implications for other investments. The book is written in Larry’s usual easy-to-read style, and you can jump to the sections that might be most relevant to you. The book is $11 on Kindle and under $15 at Amazon. This might be some of the better financial advice that you get from reading my letter: go get a copy of Get What’s Yours. I can’t guarantee it will make you $40,000 in five minutes, but it can show you how to navigate the system. Larry also has a website with some inexpensive software to help you maximize your own Social Security. Seeing as how Social Security is the largest source of income for most US retirees, this is something everyone should pay attention to. It is time to hit the send button. Quickly, we finalized the agenda for the 2015 Strategic Investment Conference. You can see it by clicking on the link. Then go ahead and register before the price goes up. This really is the best economic conference that I know of anywhere this year. Your wondering how long they’ll pay me Social Security analyst, John Mauldin, Editor This research note is based on the presentation given by Christopher Whalen, Kroll Bond Rating Agency (KBRA) Senior Managing Director and Head of Research, at the Banque de France on Monday, March 23, 2015, for an event organized by the Global Interdependence Center (GIC) entitled “New Policies for the Post Crisis Era.” KBRA is pleased to be a sponsor of the GIC. SummaryInvestors are keenly focused on the Federal Open Market Committee (FOMC) to see whether the U.S. central bank is prepared to raise interest rates later this year – or next. The attention of the markets has been focused on a single word, “patience,” which has been a key indicator of whether the Fed is going to shift policy after nearly 15 years of maintaining extraordinarily low interest rates. This week, the Fed dropped the word “patience” from its written policy guidance, but KBRA does not believe that the rhetorical change will be meaningful to fixed income investors. We do not expect that the Fed will attempt to raise interest rates for the balance of 2015. This long anticipated shift in policy guidance by the Fed comes even as interest rates in the EU are negative and the European Central Bank has begun to buy securities in open market operations mimicking those conducted by the FOMC over the past several years. Investors and markets need to appreciate that, regardless of what the FOMC decides this month or next, the global economy continues to suffer from the effects of the financial excesses of the 2000s. The decision by the ECB to finally begin U.S. style “quantitative easing” (QE) almost eight years after the start of the subprime financial crisis in 2007 speaks directly to the failure of policy to address both the causes and the terrible effects of the financial crisis. Consider several points:
So what is to be done? KBRA believes that the FOMC and policy makers in the U.S. and EU need to refocus their efforts on first addressing the issue of excessive debt and secondly rebalancing fiscal policies so as to boost private sector economic activity. Low or even negative interest rate policies which punish savers in order to pretend that bad debts are actually good are only making things worse and accelerate global deflation. Around the globe, nations from China to Brazil and Greece are all feeling the adverse effects of excessive debt and the related decline in commodity prices and overall economic activity. This decline, in turn, is being felt via lower prices for both commodities and traded goods – that is, deflation. In the U.S., sectors such as housing and energy, the effects of weak consumer activity and oversupply are combining into a perfect storm of deflation. For example, The Atlanta Fed forecast for real GDP has been falling steadily as the underlying Blue Chip economic forecasts have also declined. The drop in capital expenditures related to oil and gas have resulted in a sharp decline in related economic activity and employment. Falling prices for oil and other key industrial commodities, weak private sector credit creation, falling transaction volumes in the U.S. housing sector, and other macroeconomic indicators all suggest that economic growth remains quite fragile. To deal with this dangerous situation, the FOMC should move to gradually increase interest rates to restore cash flow to the financial system, following the famous dictum of Adam Smith that the “Great Wheel” of circulation is the means by which the flow of goods and services moves through the economy: “The great wheel of circulation is altogether different from the goods which are circulated by means of it. The revenue of the society consists altogether in those goods, and not in the wheel which circulates them” (Smith 1811: 202). Increased regulation and a decrease in the effective leverage in many sectors of banking and commerce have contributed to a slowing of credit creation and economic activity overall. And most importantly, the issue of unresolved debt, on and off balance sheet, remains a dead weight retarding economic growth. For this reason, KBRA believes that investors ought to become impatient with policy makers and encourage new approaches to boosting economic growth. Related Publications:
Analytical Contact: Christopher Whalen, Senior Managing Director [email protected], (646) 731-2366 |
04-20-15 | THESIS | |||||||||
2011 2012 2013 2014 |
 |
||||||||||
| THEMES - Normally a Thursday Themes Post & a Friday Flows Post | |||||||||||
I - POLITICAL |
|||||||||||
| CENTRAL PLANNING - SHIFTING ECONOMIC POWER - STATISM | G | THEME | |||||||||
| - - CORPORATOCRACY - CRONY CAPITALSIM | THEME |  |
|||||||||
- - CORRUPTION & MALFEASANCE - MORAL DECAY - DESPERATION, SHORTAGES. |
THEME |  |
|||||||||
| - - SECURITY-SURVEILLANCE COMPLEX - STATISM | M | THEME | |||||||||
| - - CATALYSTS - FEAR (POLITICALLY) & GREED (FINANCIALLY) | G | THEME | |||||||||
II-ECONOMIC |
|||||||||||
| GLOBAL RISK | |||||||||||
| - GLOBAL FINANCIAL IMBALANCE - FRAGILITY, COMPLEXITY & INSTABILITY | G | THEME | |||||||||
| - - SOCIAL UNREST - INEQUALITY & A BROKEN SOCIAL CONTRACT | US | THEME | |||||||||
| - - ECHO BOOM - PERIPHERAL PROBLEM | M | THEME | |||||||||
| - -GLOBAL GROWTH & JOBS CRISIS | |||||||||||
| - - - PRODUCTIVITY PARADOX - NATURE OF WORK | THEME | MACRO w/ CHS |
|||||||||
| - - - STANDARD OF LIVING - EMPLOYMENT CRISIS, SUB-PRIME ECONOMY | US | THEME | MACRO w/ CHS |
||||||||
III-FINANCIAL |
|||||||||||
| FLOWS -FRIDAY FLOWS | MATA RISK ON-OFF |
THEME |  |
||||||||
| CRACKUP BOOM - ASSET BUBBLE | THEME | ||||||||||
| SHADOW BANKING - LIQUIDITY / CREDIT ENGINE | M | THEME | |||||||||
| GENERAL INTEREST |
|
||||||||||
| STRATEGIC INVESTMENT INSIGHTS - Weekend Coverage | |||||||||||
|
SII | ||||||||||
|
SII | ||||||||||
|
SII | ||||||||||
|
SII | ||||||||||
| TO TOP | |||||||||||


Read More - OUR RESEARCH - Articles Below

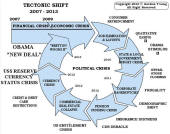
Tipping Points Life Cycle - Explained
Click on image to enlarge
TO TOP
 |
YOUR SOURCE FOR THE LATEST THINKING & RESEARCH
|
�
TO TOP