|
JOHN RUBINO'SLATEST BOOK |
|||||||||||||||||||||||||||||||||||||||||||||||||||||||||||||||||||||||||||||||||||||||||||||||||||||||||||||||||||||||||||||||||||||||||||||||||||||||||||||||||||||||||||||||||||||||||||||||||||||||||||||||||||||||||||||||||||||||||||||||||||||||||||||||||||||||||||||||||||||||||||||||||||||||||||||||||||||||||||||||||||||||||||||||||||||||||||||||||
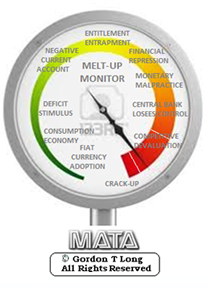
"MELT-UP MONITOR "
Meltup Monitor: FLOWS - The Currency Cartel Carry Cycle - 09 Dec 2013 Meltup Monitor: FLOWS - Liquidity, Credit & Debt - 04 Dec 2013 Meltup Monitor: Euro Pressure Going Critical - 28- Nov 2013 Meltup Monitor: A Regression-to-the-Exponential Mean Required - 25 Nov 2013
|

![]()
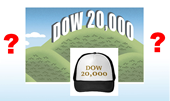
"DOW 20,000 "
Lance Roberts Charles Hugh Smith John Rubino Bert Dohman & Ty Andros
|
HELD OVER
Currency Wars
Euro Experiment
Sultans of Swap
Extend & Pretend
Preserve & Protect
Innovation
Showings Below
"Currency Wars "
|

"SULTANS OF SWAP" archives open ACT II ACT III
ALSO Sultans of Swap: Fearing the Gearing! Sultans of Swap: BP Potentially More Devistating than Lehman! |
"EURO EXPERIMENT"
archives open EURO EXPERIMENT : ECB's LTRO Won't Stop Collateral Contagion!
EURO EXPERIMENT: |
![]()
"INNOVATION"
archives open |

"PRESERVE & PROTE CT"
archives open |

Weekend Feb. 27th , 2016
Follow Our Updates
on TWITTER
https://twitter.com/GordonTLong
AND FOR EVEN MORE TWITTER COVERAGE
![]()
| FEBRUARY | ||||||
| S | M | T | W | T | F | S |
| 1 | 2 | 3 | 4 | 5 | 6 | |
| 7 | 8 | 9 | 10 | 11 | 12 | 13 |
| 14 | 15 | 16 | 17 | 18 | 19 | 20 |
| 21 | 22 | 23 | 24 | 25 | 26 | 27 |
| 28 | 29 | |||||
KEY TO TIPPING POINTS |
| 1- Bond Bubble |
| 2 - Risk Reversal |
| 3 - Geo-Political Event |
| 4 - China Hard Landing |
| 5 - Japan Debt Deflation Spiral |
| 6- EU Banking Crisis |
| 7- Sovereign Debt Crisis |
| 8 - Shrinking Revenue Growth Rate |
| 9 - Chronic Unemployment |
| 10 - US Stock Market Valuations |
| 11 - Global Governance Failure |
| 12 - Chronic Global Fiscal ImBalances |
| 13 - Growing Social Unrest |
| 14 - Residential Real Estate - Phase II |
| 15 - Commercial Real Estate |
| 16 - Credit Contraction II |
| 17- State & Local Government |
| 18 - Slowing Retail & Consumer Sales |
| 19 - US Reserve Currency |
| 20 - US Dollar |
| 21 - Financial Crisis Programs Expiration |
| 22 - US Banking Crisis II |
| 23 - China - Japan Regional Conflict |
| 24 - Corruption |
| 25 - Public Sentiment & Confidence |
| 26 - Food Price Pressures |
| 27 - Global Output Gap |
| 28 - Pension - Entitlement Crisis |
| 29 - Central & Eastern Europe |
| 30 - Terrorist Event |
| 31 - Pandemic / Epidemic |
| 32 - Rising Inflation Pressures & Interest Pressures |
| 33 - Resource Shortage |
| 34 - Cyber Attack or Complexity Failure |
| 35 - Corporate Bankruptcies |
| 36 - Iran Nuclear Threat |
| 37- Finance & Insurance Balance Sheet Write-Offs |
| 38- Government Backstop Insurance |
| 39 - Oil Price Pressures |
| 40 - Natural Physical Disaster |
Reading the right books?
No Time?

We have analyzed & included
these in our latest research papers Macro videos!
![]()
OUR MACRO ANALYTIC
CO-HOSTS
John Rubino's Just Released Book
![]()
Charles Hugh Smith's Latest Books
![]()
![]()
Our Macro Watch Partner
Richard Duncan Latest Books
MACRO ANALYTIC
GUESTS
F William Engdahl

![]()
![]()

![]()

![]()

![]()
OTHERS OF NOTE
![]()
![]()
![]()


![]()
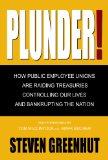
Book Review- Five Thumbs Up
for Steve Greenhut's
Plunder!
![]()
|
Have your own site? Offer free content to your visitors with TRIGGER$ Public Edition!
Sell TRIGGER$ from your site and grow a monthly recurring income!
Contact [email protected] for more information - (free ad space for participating affiliates).
HOTTEST TIPPING POINTS |
Theme Groupings |
||
We post throughout the day as we do our Investment Research for: LONGWave - UnderTheLens - Macro
|
|||
|
MOST CRITICAL TIPPING POINT ARTICLES TODAY
|
|
||
 |
|||
|
02-27-16 | SII | |
|
|||
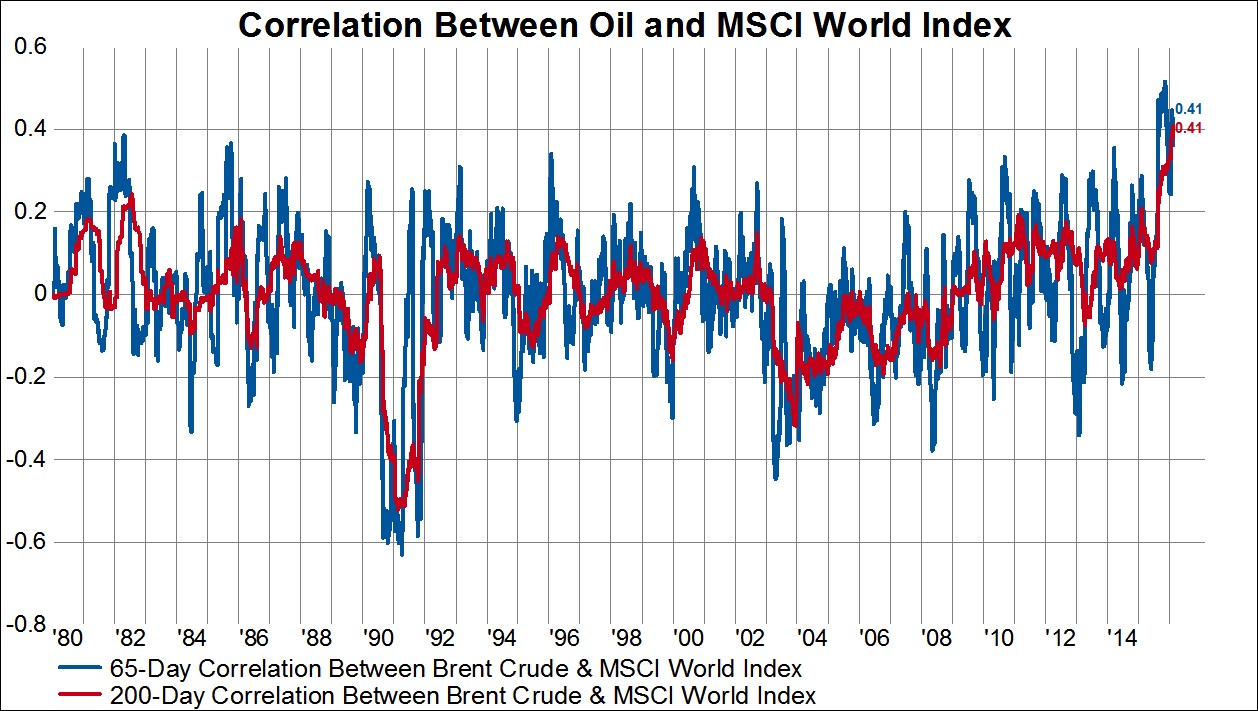
Correlation Between Oil And Stocks Highest Since 1980Submitted by Eric Bush via Gavekal Capital blog, Stock prices and oil prices have been moving in a more positive correlated fashion recently than at any point since 1980. The 65-day correlation between Brent Crude Oil and MSCI World Index peaked at 52% on 11/13/2015 and has since fallen back a bit to 41%. The 200-day moving average is also at 41% and continues to climb higher. The current correlation of 41% is the highest correlation between stocks and oil prices ever over the history we have for both series.
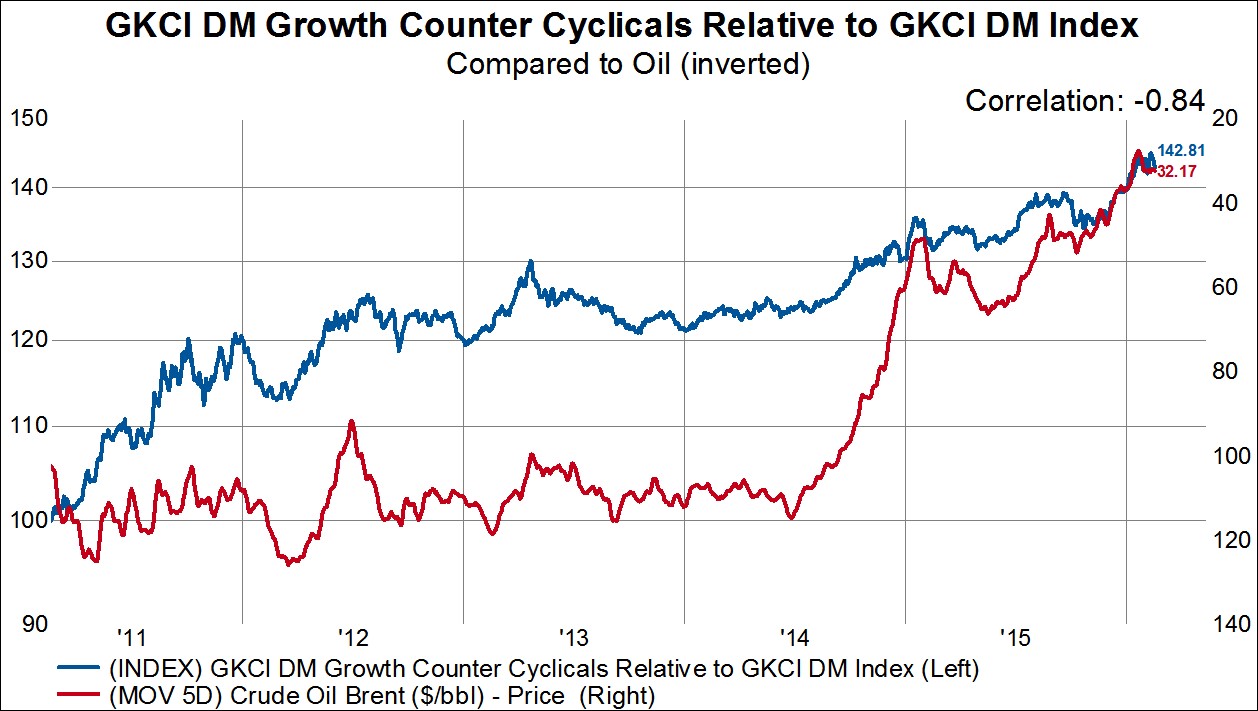
Of course there have been certain sectors of the stock market that have been highly correlated to the price of oil for quite a while. And fortunately for investors, there have been sectors that have had a negative correlation. In the first chart below, we show GKCI Developed Market cyclical sectors (Consumer Discretionary, Energy, Financials, Industrials, Information Technology, Materials) relative to the overall stock market (blue line). The red line shows the 5-day moving average for Brent Crude Oil. Over the past five years, these two series have had a 85% correlation. As oil has fallen, cyclical stocks have fallen with it. 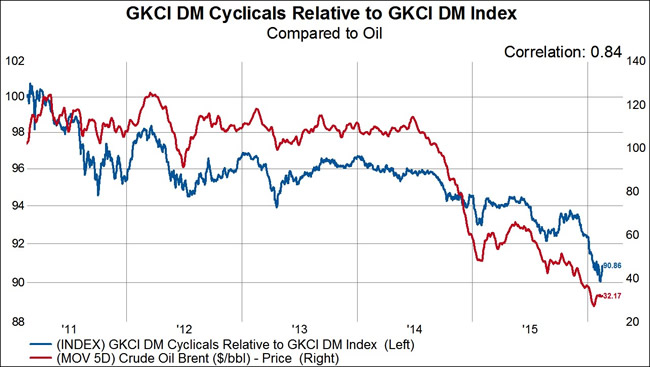 In the second chart, we show GKCI Developed Market growth counter-cyclical sectors (Consumer Staples and Health Care) relative to the overall stock market (blue line). Once again, the red line shows the 5-day moving average for Brent Crude Oil.
This time we have inverted the right-hand scale so as to better illustrate the relationship. Here, we see growth-counter cyclicals have actually had a NEGATIVE relationship with oil prices. To the tune of a -84% correlation over the past five years. Consequently, growth counter-cyclical stocks have been the best way for investors to buck the drag that oil prices have had on stock prices. |
|||
TIPPING POINTS, STUDIES, THESIS, THEMES & SII COVERAGE THIS WEEK PREVIOUSLY POSTED - (BELOW)
|
|||
| MOST CRITICAL TIPPING POINT ARTICLES THIS WEEK - Feb 21st, 2016 to Feb 27th, 2016 | |||
| TIPPING POINTS - This Week - Normally a Tuesday Focus | |||
| BOND BUBBLE | 1 | ||
| RISK REVERSAL - WOULD BE MARKED BY: Slowing Momentum, Weakening Earnings, Falling Estimates | 2 | ||
| GEO-POLITICAL EVENT | 3 | ||
| CHINA BUBBLE | 4 | ||
| JAPAN - DEBT DEFLATION | 5 | ||
EU BANKING CRISIS |
6 |
||
8 - Shrinking Revenue Growth Rate |
8 |
||
Citi Asks "When Does A Recession Become A Depression?"Submitted by Tyler Durden on 02/22/2016 10:27 -0500
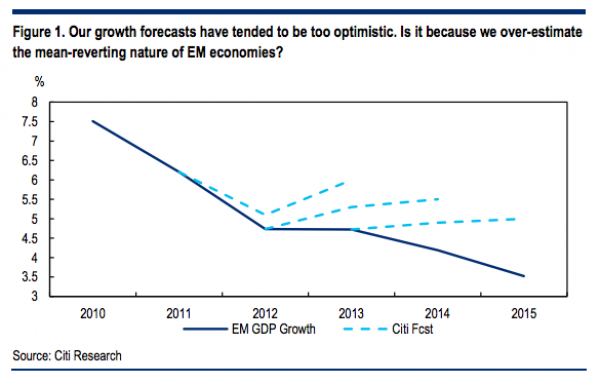
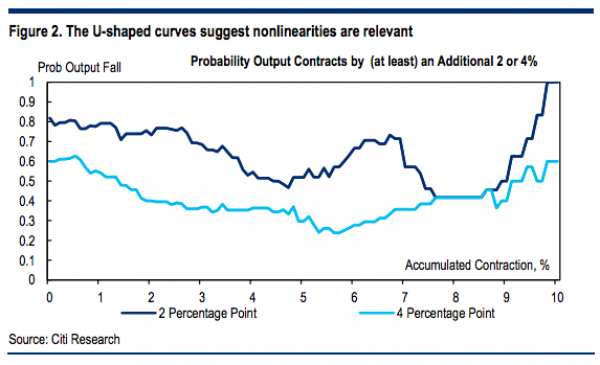
“When it rains, it pours.” That is most assuredly one of the most heavily used cliches in the history of the English language but a failure to understand it apparently causes Citi’s economics team to get it wrong when it comes to forecasting the depth and trajectory of recessions. In a new note, the bank looks at what happens when mean reversion fails, pushing a struggling economy even further into the abyss. Here’s a list of some of the mean reverting forces that help economies to correct and pull themselves out of trouble:
But an overreliance on the assumption that these forces will everywhere and always lead economies out of the recessionary doldrums has apparently caused Citi to be “too optimistic” in their forecasts on EM growth - and that’s putting it nicely:
In an effort to figure out why their forecasts have consistently missed the mark as multiple EMs head toward severe corrections, Citi took a look at 55 recession episodes in emerging markets during the last few decades and discovered a funny thing: when things are going bad they tend to get worse, not better:
Now to someone without a PhD in economics this would have been obvious, but as anyone who's ever done any academic research knows, the "very serious" people spend quite a bit of their time discovering things that largely belong in the realm of common sense. A slavish adherence to the notion of predictable business cycles has led professional economists astray on any number of occasions and indeed, the entire thesis behind the machinations central banks are currently going through rests on the notion that these cycles can be smoothed and manipulated. Far from being able to successfully tinker with them, it would appear economists don't understand them at all. * * * Below, find Citi's take on what the above means for Brazil, the poster child for EM malaise.
|
|||
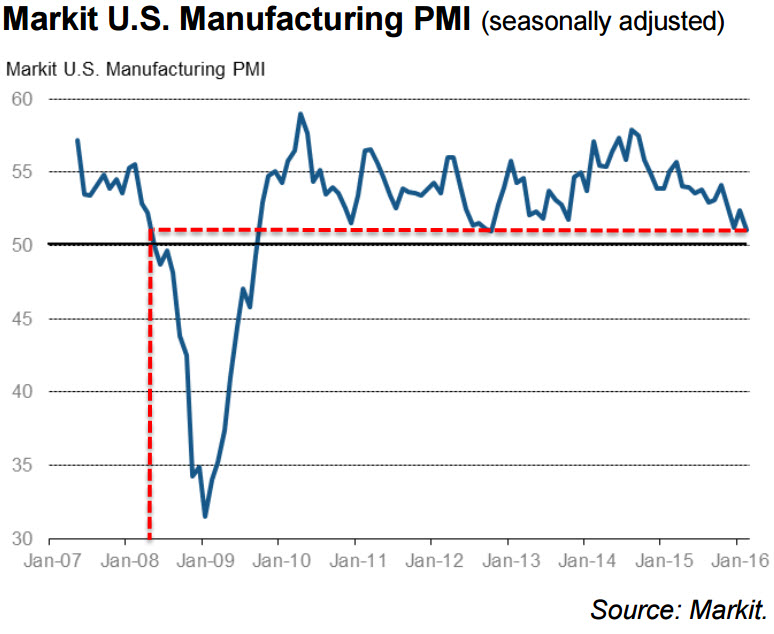
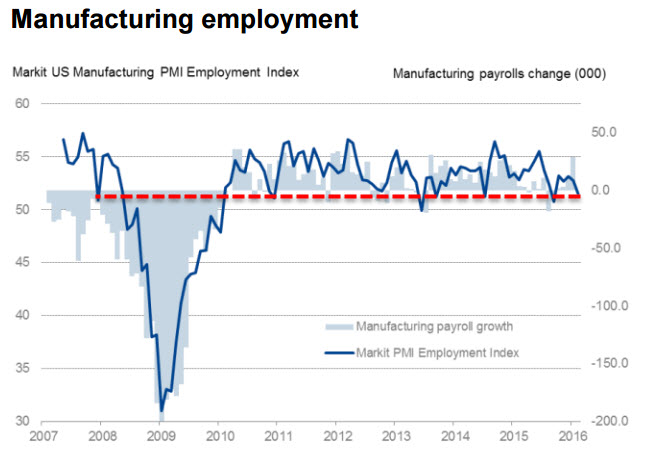
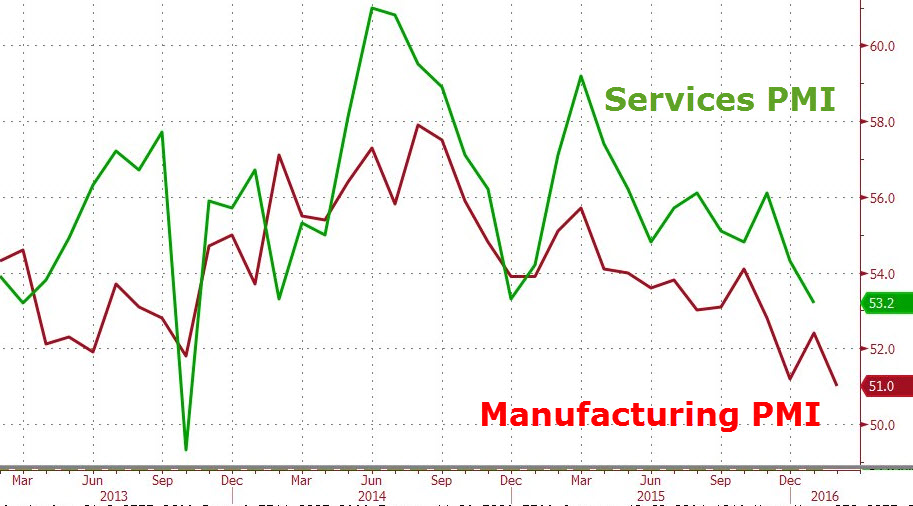
PMI Plunges - The Last Time US Manufacturing Was This Weak, Bernanke Hinted At QE3Submitted by Tyler Durden on 02/22/2016 09:53 -0500
On the heels of weakness in the rest of the world's PMIs, US Manufacturing just printed 51.0 (missing expectations of 52.4) and tumbling to its lowest since October 2012... followed rapidly by Bernanke hinting at QE3. While Markit does 'blame the extreme weather', it notes however that "every indicator from the flash PMI survey, from output, order books and exports to employment, inventories and prices, is flashing a warning light about the health of the manufacturing economy." Not good...
Even worse...
Chris Williamson, chief economist at Markit said:
And with Services now tumbling also, what excuse will the permabulls have next...
Charts: Markit and Bloomberg |
|||
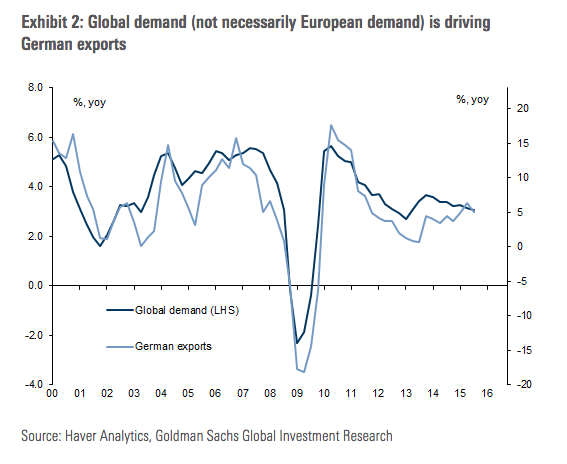
Has The German Manufacturing Juggernaut "Lost Its Mojo?"Earlier today, we highlighted the noticeable weakness in European PMIs which largely missed expectations on - what else? - sluggish global demand and generally anemic economic growth. Specifically, Germany’s PMI fell for the second month in a row in February, declining to 53.8 from 54.5 the previous month. Worryingly, the manufacturing PMI slumped 50.2, missing estimates by a wide margin and hitting its lowest level in 15 months. Services looked ok, but as anyone who follows global macro knows, it’s all about manufacturing for the world’s fourth largest economy. The health of Germany’s manufacturing sector serves as a useful barometer not only for the health of the European economy for the pace of global growth and trade in general. Indeed, that’s one of the reasons why the Volkswagen emissions scandal was (and still is) so troubling. It has the potential to dent Germany’s manufacturing juggernaut. In the wake of Monday’s data, Goldman is out asking if perhaps German manufacturing “has lost its mojo.” “German real GDP grew a moderate 0.3%qoq in the fourth quarter of last year, and by 1.5% for the whole of 2015,” Goldman writes, adding that “part of the relative disappointment can be located in the manufacturing sector, which has shown a sub-par performance since 2011.” What’s to blame, you ask? Why sluggish global growth of course:
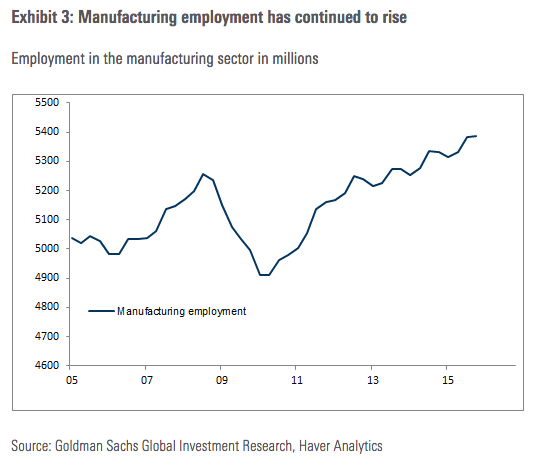
Yes, "it is indeed" weaker global demand, a fact which underscores one of the key themes when it comes to assessing the state of the global economy. Depressed aggregate demand, anemic growth, and sluggish trade have become endemic. It's now a structural rather than a cyclical problem. But everyone knows that by now (or at least they should). What puzzles Goldman is that manufacturing employment is on the rise and capacity utilization doesn't all that bad either.
So what gives? When in doubt, just say the numbers are wrong. "Together with the relative strength of the employment figures we see a possibility that the price-adjusted figures under-report the strength of the German manufacturing sector," Goldman posits. Perhaps. But if the problem is subpar global growth, then analyzing the sub-components is futile. Either aggregate demand and trade pick up or the German economy sinks with everyone else. "Barring any sharp slowdown of the global economy, we would expect a continuation of the solid, though not spectacular, growth of the German economy," Goldman concludes. About that whole "barring any sharp slowdown of the global economy" thing...
...note the red arrows...
|
|||
| TO TOP | |||
| MACRO News Items of Importance - This Week | |||
GLOBAL MACRO REPORTS & ANALYSIS |
|||
US ECONOMIC REPORTS & ANALYSIS |
|||
| CENTRAL BANKING MONETARY POLICIES, ACTIONS & ACTIVITIES | |||
| Market - WEDNESDAY STUDIES | |||
| STUDIES - MACRO pdf | |||
TECHNICALS & MARKET |
|
||
TECHNICALS & MARKET |
02-26-16 |
||
"It's All A Short Squeeze"Goldman Expects A 20% DropBefore Markets Can RallySubmitted by Tyler Durden on 02/24/2016
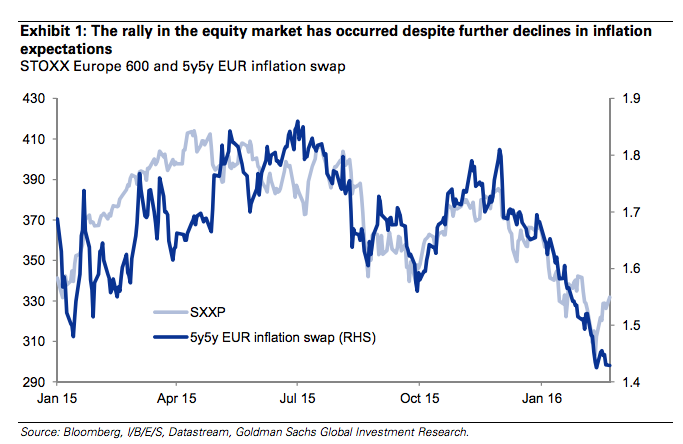
Three weeks into January things were looking rather grim. Plunging crude, jitters about the ongoing (and increasingly unpredictable) yuan devaluation, and spillovers to global risk assets stemming from an ill-fated attempt by Chinese regulators to implement a stock market circuit breaker got US equities off to one of their worst Januarys in history. Compounding the problem, it seemed that the market had all of the sudden woken up to two very important (and very interconnected) facts: 1) central banks are desperate, and 2) sluggish global growth and trade look to have become structural and endemic rather than cyclical and transitory. All of this weighed heavily on risk appetite and the bears stood by and watched as a kind of slow motion panic spread through markets. Since then, things have stabilized. Sort of. Oil is still a huge question mark and barring a Saudi production cut (which oil minister al-Naimi made clear on Tuesday isn’t going to happen) will likely continue to fuel the global disinflationary impulse. Meanwhile, markets are asking more questions about negative rates and central banker omnipotence every day. For those wondering whether we’ll be riding the short squeeze euphoria wave higher, Goldman’s answer is definitively “no.” In a note out this morning, the bank says short covering and positioning have fueled the bounce and that a sustained rebound is exceptionally unlikely until either valuations get significantly more attractive or inflation expectations stabilize. * * * From Goldman Over the past couple of weeks, it would appear that many of the worries that beset the markets through January have faded. But we think it is risky to read too much into price action currently. Volatility remains very high and much of the moves may reflect positioning rather than a genuine change of view about fundamentals. Remember that at the heart of the correction there has been a growing concern about growth and, with it, the risks of deflation. The rally in the equity market has occurred despite further declines in inflation expectations (and bond yields). In Europe 5 year-5 year forward inflation swaps (which Mr. Draghi has emphasized in the past) have recently hit an all-time low.
Even in the US the market is pricing core CPI inflation to turn negative in 1-years’ time, an outcome that did not occur even in 2008-2009; the 5-year/5-year inflation breakeven rate is only at 1.45% - well below the Fed’s target. Ironically the stabilization in oil prices and EM assets that has been at the core of recent short covering and recovery in risk appetite was probably explained initially more by the fear of weaker data than confidence in a genuine economic recovery. Concerns about a broadening out of the manufacturing downturn in January to the broader economy, together with falling inflation expectations and tightening financial conditions, pushed out the expected timing of interest rate rises. This, in turn, has capped the rise in the US dollar thereby alleviating some pressure on commodity prices and EM currencies. Another critical ingredient of the rebound in risk assets has been the strengthening of the CNY since February and the narrowing gaps between CNY and CNH. Some would also point to a more stable price for oil which likely led to some short covering and resulted in mining and oil moving to the top of the best performing sector list year to date. However, this may be premature. Hopes of an OPEC deal explained some of the stability in oil prices, but our commodity team expects oil prices to remain volatile and oscillate between $20/bbl and $40/bbl in the near term. But there has been a roughly 8% rally since the trough – does this mark the start of a sustained recovery in the index? On the valuation front the picture is complicated. Anything that compares equites to bonds makes equities look very cheap. But on the other hand absolute valuations are not yet cheap – prices have fallen but so have earnings expectations.
As a result, most valuation measures have increased in recent years, leaving equities vulnerable to perceived increases in risks. It is for this reason that we think a continued meaningful rise in markets is not likely unless either valuations have fallen further first, or the macro data shows more meaningful signs of improvement and the fears about deflation shift towards fears of missing the leverage to inflation.
For equities to move meaningfully higher from here, we think valuations would need to be cheaper first (around 11x or 12x forward earnings compared with 14x currently). Without this, the market is likely to remain volatile, but tread water until there is a clear shift in inflation expectations. * * * In other words, Goldman thinks stocks need to fall some 20% from here before the buyers come out in earnest. Goldman’s conclusion: there will be no sustained rally until at least one of the following three things occurs: 1) Valuations become cheap; 2) The broad macro data stabilizes enough to shift up inflation expectations and/or; 3) Policy action becomes more supportive. Put simply, number 2 isn't going to happen. At least not for the foreseeable future. Oil prices would need to rise dramatically, the global deflationary supply glut would need to moderate on the back of a sustained uptick in aggregate demand, and China would need to stop exporting deflation. As for number 3, monetary policy can't get any more supportive. Literally. Rates are so low that the cash ban calls are rolling in and for a variety of reasons, policy makers across the globe have been reluctant to embark on massive fiscal stimulus programs. Finally, as for number 1, either earnings would need to rise or else stocks need to fall. Considering the fact that the world looks very likely to careen into recession just as primary market appettite for the bond deals that are fueling bottom line-inflating buybacks dissipates, we know which alternative seems more likely to us.
|
|||
TECHNICALS & MARKET |
02-25-16 |
||
"Everything Is Rolling Over"BofA Watches The CarnageSubmitted by Tyler Durden on 02/24/2016 10:56 -0500
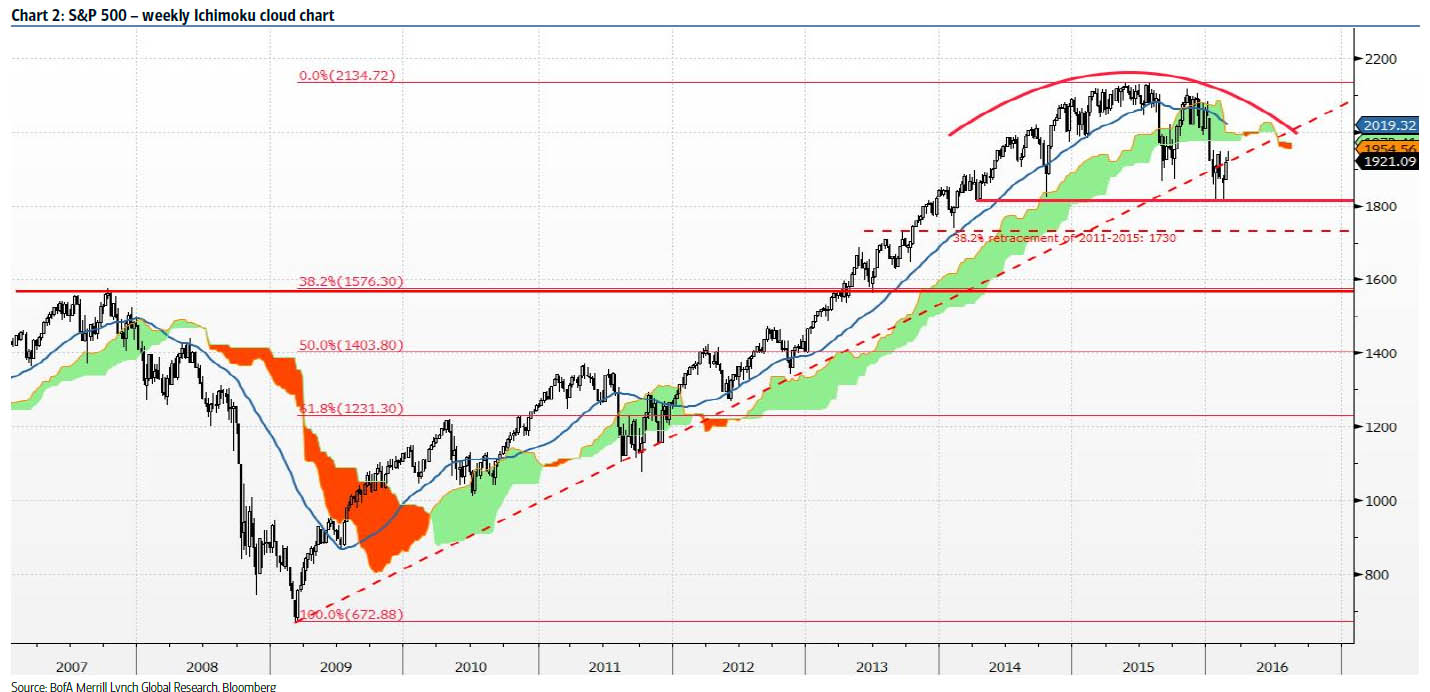
In recent weeks Bank of America's new chief technician Stephen Suttmeier has been surprisingly bearish, predicting that the rally is over, as Tom DeMark cautioned yesterday, key support levels are not defended in which case the S&P 500 is looking at a substantially greater drop. Today, his skepticism reached new heights, when he warned that should the failure to break out higher persist then the market is facing a drop to as low ast 1575-1600, something which even Goldman now agrees with. Below is an excerpt from his latest attempt at a diplomatic guide down:
Or just a breakdown in both 7 years of momentum and central bank credibility.
However, Buried just a little deeper in the note, is his far less politically correct assessment, one which suggests that with most indicators rolling over, the last one to follow will be price, especially now that as Jack Lew explained there will be no surprise G-20 "rabbit in the hat" moment in Shanghai over the coming weekend.
Looks like central planners are going to have their hands full to preserve years of a carefully, if artificially, erected "wealth effect."
|
|||
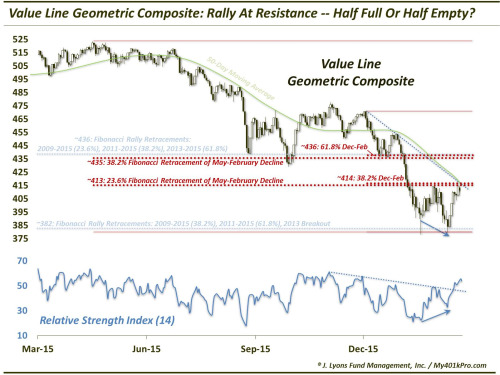
Is The Stock Rally GlassHalf Full Or Half Empty?Submitted by Tyler Durden on 02/24/2016 11:34 -0500
The February stock market bounce has reached a crossroads – will there be another leg higher or has the rally run its course? The rally in stocks has reached an key juncture it would seem in many of the major indices. That includes our favorite index: the Value Line Geometric Composite (VLG). Once again, the VLG is an unweighted average of approximately 1700 stocks. The calculation of the index amounts to essentially the median stock performance among that universe. Thus, in our view, it is probably the best gauge of the true health of the broad stock market. If that is the case, the market’s health is truly up in the air at this point. Consider first where the VLG is coming from. On January 6, the VLG broke down from what we determined to be a pass/fail line of support around 436, based on key Fibonacci Retracement levels of the post-2009 bull market. Indeed, the index plunged immediately and severely upon breaking that level. The next support we earmarked below stood at 382, or about 12% lower. It took the VLG just 2 weeks to hit that level, which we noted on January 20. The index held that 382 level on January 20, as well as on a subsequent re-test on February 11. Since then, the VLG has bounced solidly, moving as high as 415 yesterday before encountering multiple resistance layers. Today, the VLG, settled at 409.85. As quant-oriented managers, this is an interesting juncture to us. To wit: a move from 409 back up to 436 would mark a rise of +6.6015%. Meanwhile, a drop back down to 382 from 409 would signify a loss of -6.6015%. So which spot is the next destination? Or, in other words, is the rally glass half full or half empty?
First off, what sort of potential resistance are we seeing in this vicinity? The layers of potential resistance are plentiful and formidable, enough to engender a “half-empty” attitude. Among others, they include
Price is truth, as they say, and the onus is certainly on the bulls to prove that they can vault the VLG over this area of resistance. That said, there are plenty of clues to be found beyond price that often serve instructively in determining where prices are likely to go. This includes price-based derivative indicators (e.g., Relative Strength Index,or RSI) that measure the degree of momentum within a move. While we do not typically use these classical technical analysis tools, they are very popular among traders and can prove useful at times. For example, traders often use RSI to spot divergences in price vs. momentum. For example, note on the chart how the VLG made a lower closing low in February versus its January 20 low, while RSI held above that initial low. This positive divergence can (but not always) give a head’s up regarding a potential upside reversal. In this case, prices did indeed turn up, leading to this late February rally. Note also the post-December down trendlines on price and RSI. The VLG is bumping into the trendline while the RSI has broken above. This is another potential positive divergence that could be a harbinger of a trendline break in prices as well. Mark one down for the glass “half-full” crowd. Lastly, while price is the final arbiter of market action, it is not exactly predictive. That is why we use a stable of indicators based on various measures of breadth and momentum of breadth, et al. to instruct us as to the likely course of future prices. While this approach does not always hold true, particularly for indices that are heavily weighted toward a relatively small number of constituents, it is especially helpful on a broad, equal-weight index like the VLG. Currently, we would assess the status of most of these proprietary indicators as “constructive”. That is, they are positively oriented and supportive of potentially higher prices. So where’s the next stop for stock prices, 6.6015% higher or lower? While the immediate resistance is considerable, there is ample evidence to suggest that prices could overcome that resistance eventually. We understand that a rally of that magnitude represents a fairly modest goal for investors. However, if our longer-term assessment of the stock market is close to accurate, considering the likely potential range of prices over the next 6 months to several years, we would take that gain in a heartbeat. Consider it a bearish “glass half-full” view. * * * More from Dana Lyons, JLFMI and My401kPro.
|
|||
TECHNICALS & MARKET |
02-25-16 |
||
"Everything Is Rolling Over"BofA Watches The CarnageSubmitted by Tyler Durden on 02/24/2016 10:56 -0500
In recent weeks Bank of America's new chief technician Stephen Suttmeier has been surprisingly bearish, predicting that the rally is over, as Tom DeMark cautioned yesterday, key support levels are not defended in which case the S&P 500 is looking at a substantially greater drop. Today, his skepticism reached new heights, when he warned that should the failure to break out higher persist then the market is facing a drop to as low ast 1575-1600, something which even Goldman now agrees with. Below is an excerpt from his latest attempt at a diplomatic guide down:
Or just a breakdown in both 7 years of momentum and central bank credibility.
However, Buried just a little deeper in the note, is his far less politically correct assessment, one which suggests that with most indicators rolling over, the last one to follow will be price, especially now that as Jack Lew explained there will be no surprise G-20 "rabbit in the hat" moment in Shanghai over the coming weekend.
Looks like central planners are going to have their hands full to preserve years of a carefully, if artificially, erected "wealth effect."
|
|||
Is The Stock Rally GlassHalf Full Or Half Empty?Submitted by Tyler Durden on 02/24/2016 11:34 -0500
The February stock market bounce has reached a crossroads – will there be another leg higher or has the rally run its course? The rally in stocks has reached an key juncture it would seem in many of the major indices. That includes our favorite index: the Value Line Geometric Composite (VLG). Once again, the VLG is an unweighted average of approximately 1700 stocks. The calculation of the index amounts to essentially the median stock performance among that universe. Thus, in our view, it is probably the best gauge of the true health of the broad stock market. If that is the case, the market’s health is truly up in the air at this point. Consider first where the VLG is coming from. On January 6, the VLG broke down from what we determined to be a pass/fail line of support around 436, based on key Fibonacci Retracement levels of the post-2009 bull market. Indeed, the index plunged immediately and severely upon breaking that level. The next support we earmarked below stood at 382, or about 12% lower. It took the VLG just 2 weeks to hit that level, which we noted on January 20. The index held that 382 level on January 20, as well as on a subsequent re-test on February 11. Since then, the VLG has bounced solidly, moving as high as 415 yesterday before encountering multiple resistance layers. Today, the VLG, settled at 409.85. As quant-oriented managers, this is an interesting juncture to us. To wit: a move from 409 back up to 436 would mark a rise of +6.6015%. Meanwhile, a drop back down to 382 from 409 would signify a loss of -6.6015%. So which spot is the next destination? Or, in other words, is the rally glass half full or half empty?
First off, what sort of potential resistance are we seeing in this vicinity? The layers of potential resistance are plentiful and formidable, enough to engender a “half-empty” attitude. Among others, they include
Price is truth, as they say, and the onus is certainly on the bulls to prove that they can vault the VLG over this area of resistance. That said, there are plenty of clues to be found beyond price that often serve instructively in determining where prices are likely to go. This includes price-based derivative indicators (e.g., Relative Strength Index,or RSI) that measure the degree of momentum within a move. While we do not typically use these classical technical analysis tools, they are very popular among traders and can prove useful at times. For example, traders often use RSI to spot divergences in price vs. momentum. For example, note on the chart how the VLG made a lower closing low in February versus its January 20 low, while RSI held above that initial low. This positive divergence can (but not always) give a head’s up regarding a potential upside reversal. In this case, prices did indeed turn up, leading to this late February rally. Note also the post-December down trendlines on price and RSI. The VLG is bumping into the trendline while the RSI has broken above. This is another potential positive divergence that could be a harbinger of a trendline break in prices as well. Mark one down for the glass “half-full” crowd. Lastly, while price is the final arbiter of market action, it is not exactly predictive. That is why we use a stable of indicators based on various measures of breadth and momentum of breadth, et al. to instruct us as to the likely course of future prices. While this approach does not always hold true, particularly for indices that are heavily weighted toward a relatively small number of constituents, it is especially helpful on a broad, equal-weight index like the VLG. Currently, we would assess the status of most of these proprietary indicators as “constructive”. That is, they are positively oriented and supportive of potentially higher prices. So where’s the next stop for stock prices, 6.6015% higher or lower? While the immediate resistance is considerable, there is ample evidence to suggest that prices could overcome that resistance eventually. We understand that a rally of that magnitude represents a fairly modest goal for investors. However, if our longer-term assessment of the stock market is close to accurate, considering the likely potential range of prices over the next 6 months to several years, we would take that gain in a heartbeat. Consider it a bearish “glass half-full” view. * * * More from Dana Lyons, JLFMI and My401kPro.
|
|||
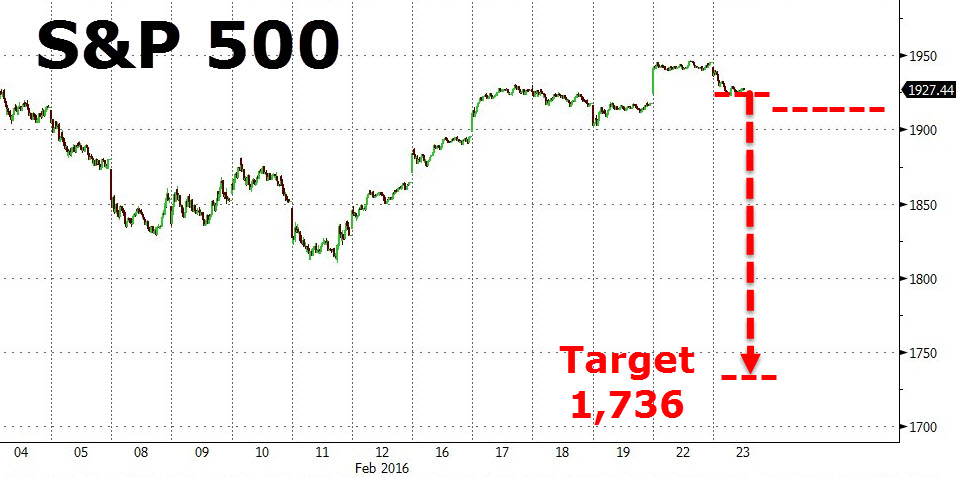
Tom DeMark WarnsIf The S&P Closes Below This Level,It Could "Wreak Havoc To The Downside"Posted:Tue, 23 Feb 2016 18:19:16 GMTThe S&P 500 is three trading days from reaching "trend exhaustion," according to infamous technical analyst Tom DeMark. "The foundation of the ongoing rally is suspect," warns DeMark, noting that if the market closes below these key levels in the next three days, DeMark warns "the decline is going to be sharp."
As Bloomberg reports, a top in the S&P 500 would also be confirmed should the S&P 500 finish below 1,926.82 on Tuesday, or close less than 1,917 on Wednesday or Thursday, DeMark said.
* * * A handful of chart-based calls by DeMark have looked prescient in recent weeks, including a prediction on Feb. 11 that oil would rally and a Jan. 20 forecast for a temporary bottom in the S&P 500. And traders pay close attention to the levels he suggests.
|
|||
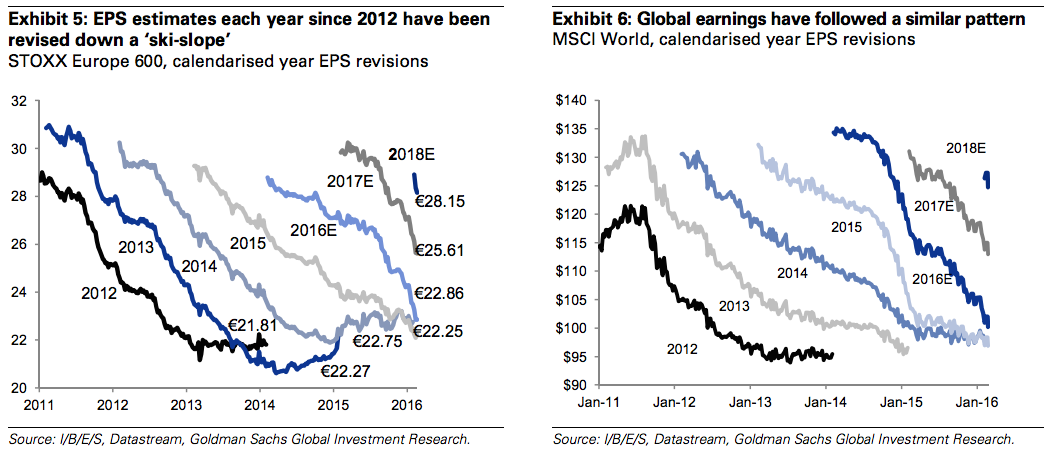
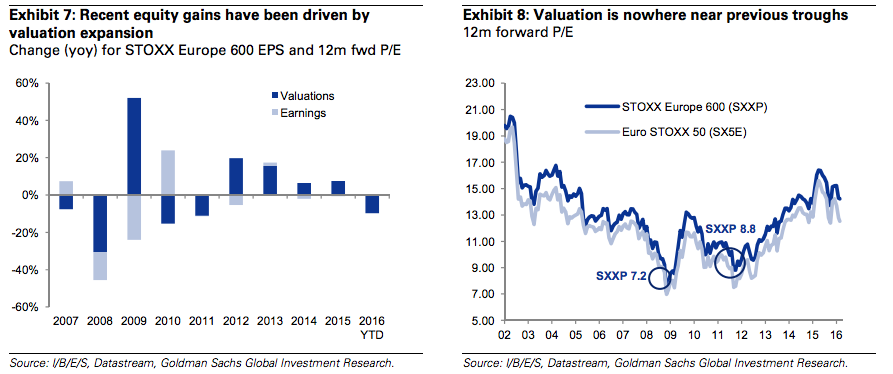
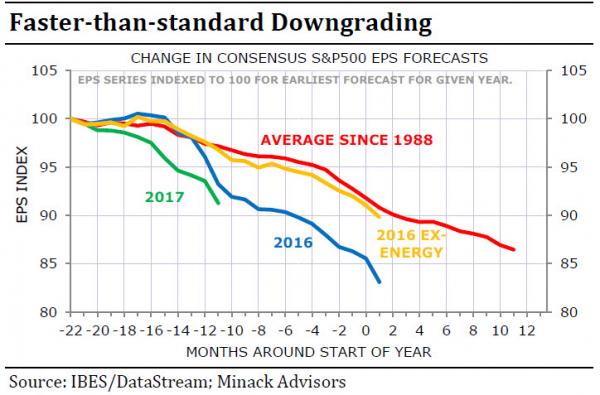
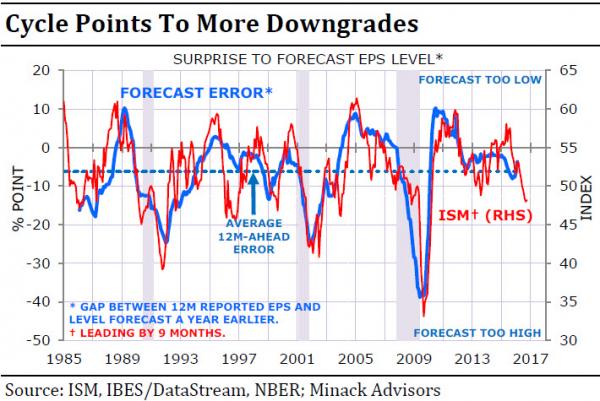
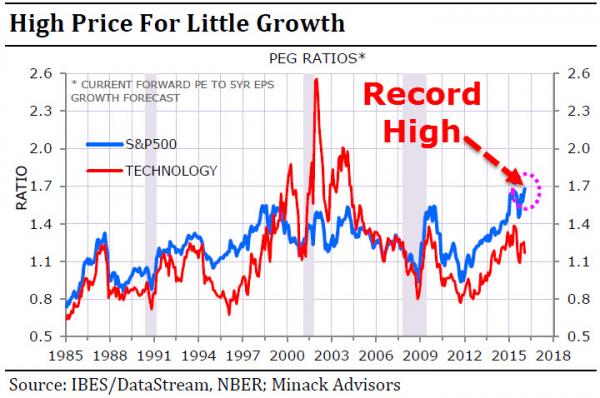
The Good(ish), The Bad, & The Ugly Of Equity ValuationsPosted:Tue, 23 Feb 2016 20:20:00 GMTThe good news is that lower rates can justify higher valuations, but as former Morgan Stanley guru Gerard Minack explains, the bad news is lower earnings growth. In Minack's view the rally from the 2011 lows was the equity market factoring in the beneficial part of the story: re-rating on the back of a low discount rate; but, markets are only now starting to focus on the corollary: lower trend earnings growth. With theprospective P/E of the S&P500 is now at an 'ugly' all-time high relative to the medium term EPS forecasts, and downgrades set to continue based on macro weakness, equity valuations suggest this 'correction' is far from over. S&P500 earnings are now falling. Lower oil prices and a strong dollar are hurting, but the biggest issue seems to be rising labour costs capping margins. In addition, medium-term earnings expectations are also falling – rightly, in my view, given current high margins and the prospect of low growth. UGLY - Consensus forecasts for 2016 and 2017 are being scaled back faster than usual...
UGLIER - Earnings face well-known headwinds, notably a stronger dollar and falling oil. Cycle indicators, such as the manufacturing ISM, point to further larger-than-usual downgrades to EPS forecasts
UGLIEST - The prospective PE of the S&P500 is now at an all-time high relative to the medium term EPS forecasts
Trade accordingly.
|
|||
| COMMODITY CORNER - AGRI-COMPLEX | |||
| THESIS - Mondays Posts on Financial Repression & Posts on Thursday as Key Updates Occur | |||
|
2016 | THESIS 2016 |  |
| 2015 - FIDUCIARY FAILURE | 2015 | THESIS 2015 |  |
| 2014 - GLOBALIZATION TRAP | 2014 |  |
|
 |
|||
|
2013 2014 |
 |
||
Dr. Marc Faber: “They Will Bankrupt the World!”Dr. Marc Faber joins FRA Co-founder Gordon T. Long in an exciting discussion of monetary malpractice, negative interest rates, the influence of current geopolitical risk and much more. Dr Marc Faber was born in Zurich, Switzerland. He went to school in Geneva and Zurich and finished high school with the Matura. He studied Economics at the University of Zurich and, at the age of 24, obtained a PhD in Economics. Between 1970 and 1978, Dr Faber worked for White Weld & Company Limited in New York, Zurich and Hong Kong. Since 1973, he has lived in Hong Kong. From 1978 to February 1990, he was the Managing Director of Drexel Burnham Lambert (HK) Ltd. In June 1990, he set up his own business, MARC FABER LIMITED which acts as an investment advisor and fund manager. Dr Faber publishes a widely read monthly investment newsletter “The Gloom Boom & Doom Report” report which highlights unusual investment opportunities, and is the author of several books including “ TOMORROW’S GOLD – Asia’s Age of Discovery” which was first published in 2002 and highlights future investment opportunities around the world. “ TOMORROW’S GOLD ” was for several weeks on Amazon’s best seller list and is being translated into Japanese, Chinese, Korean, Thai and German. Dr. Faber is also a regular contributor to several leading financial publications around the world. A regular speaker at various investment seminars, Dr Faber is well known for his “contrarian” investment approach. He is also associated with a variety of funds and is a member of the Board of Directors of numerous companies. JAPANESE NEGATIVE INTEREST RATES AND THEIR GLOBAL IMPLICATIONS “It’s an experiment by few mad professors that occupy senior positions in central banks.” Over the last 5000 years of recorded human history, interest rates have never been as low as they are now. The time value of money is the natural state. It is the markets way of pricing today’s money and the future’s money. The higher the uncertainty of future money is, the higher the rate of interest will be. What central banks are doing at the present is incomprehensible to me, unless it means an expropriation of money. The central banks in their madness believe this will result in economic growth. But in reality it will force people to become insecure. For example if you received 6% on your money, and then rates become zero and in this case become negative which in other words you’re being penalized for your deposit. Does that rate make you save more or spend more? One thing I will never understand is despite us having democracies, somewhere, somehow, the system has given so much power to a bunch of well understood, unelected academics and most of them have never worked for the private sector for a day. The Fed, Bank of Japan, ECB are all likeminded people; they all believe money printing boosts economic activity and tight money is negative. “They will bankrupt the world.” We do not know how badly it will end, but an interesting thing to note is if you look at the 2008 financial crisis, which sector got the most bailout money? It was the banks and the fund managers. Then you look at the performance of their stocks, it is a disaster. Bailout money and money printing doesn’t help at all. In fact it has made matters worse for the average American. I side with Americans who support Bernie Sanders because he is expressing the views of ordinary people that the Wall Street guys and the banking lunatics have essentially cheated the people. “In every instance where they have negative interest rates, the exact opposite of the objective occurs.” This view of central banks to distort the free market and capitalist system is a view of the paternalist; some people that think they know better. They think they can steer the economy like how you would drive a car. FED RAISING RATES “As a working man it is hard to believe the world has handed so much power to a bunch of ignorant and arrogant people.” Firstly Janet Yellen was the president of the San Francisco Federal Reserve which is in charge of California, Arizona, Nevada and another state. In her district we had the biggest real estate bubbles ever. Now she is the Fed chairman and slashed interest rates. We have had eight years of zero interest rates, and now she increases it by a quarter of a percent which is meaningless. She should have increased rates when there was a strong recovery in 2010 and 2011 but she waited. She waited right until the world is entering a very deep recession. She will go down and have a front portrait in a museum as a central bank failure. IMPLICATIONS OF MONETARY MALPRACTICE “There are reasons to believe that central banks will go bust.” Systemically I think they have allowed the debt level to expand, particularly they have allowed government credit to expand as a percentage of the economy. You have to understand that when you try to supress individual risks in a system, eventually you end up with systemic risk. We will eventually have a huge crisis and investor will not know how to deal with it. People like Bernie Sanders are not blaming the Fed, they are blaming Wall Street. In other words they are blaming rich people for the hardship or ordinary people. The Fed essentially threw money at Wall Street and naturally they kept it for themselves. Yes, there is a trickle-down effect which makes them give their waiter a slightly larger tip; it is insignificant. ISSUES OF CURRENT GEOPOLITICAL RISK “Everything the US touched in the Middle East and Central Asia, from Afghanistan to Iraq, Syria, Egypt and Lebanon, it all turned into a complete disaster.” The Neocons had this brilliant idea to start making trouble in Ukraine, not understanding it is Russian territory and historically until the early 20th century Ukraine was part of Russia. Also not understanding that Crimea is of huge strategic importance to Russia, just like what California is to the US. Russia will never give up Crimea, I can promise you that. This is because it is a warm water port and they need it to have the access to the Mediterranean, without it they are at the mercy of America. The Europeans are equally as incompetent. Angela Merkel just follows the US without understanding she is hurting the business interest of Germany. Russia and Germany were historically, culturally and politically very close. The interventions are very poorly thought out. In the case of China, it is the second largest economy in the world with a population of 1.3 billion people. It is a highly advanced economy, especially in defense technology. A pivot to Asia by the US is seen by the Chinese as an aggression. It is a threat to the sovereignty and security of China which has created another set of geopolitical tensions. FEAR OF A COLLAPSING PETRODOLLAR Under Mr. Greenspan the central bank enjoyed a lot of prestige. He had done better than his predecessors; his only major mistake was deliberately creating the NASDAQ bubble. “However, Bernanke and Yellen are complete chaos. I don’t actually believe that they make the decisions; they are told by someone what they should do.” It is difficult to tell what people think but if you look into the Japanese negative interest rates, the intention was to weaken the Yen. Not that the weak currency helps anyone, but by slashing interest rates and having them below zero 10yr Japanese bond will cause you to lose money unless the Yen appreciates. The idea was to have negative interest rates cause the Yen weaken but it actually strengthened. INVESTMENT OPPORTUNITIES IN ASIA The area of Indochina is a boomtown. Not Thailand but Cambodia exports are rising at about 20%/annum. Vietnam has huge inflow of foreign direct investment, partly because the Taiwanese, Koreans and Japanese can invest in Vietnam and produce goods there. There are a lot of investments coming from China and South East Asia. The US is afraid of China gaining too much influence in that part of the world so they waste money there by trying to displace the Chinese. The Chinese will go to Cambodian government and say they are going to make a road or a bridge and in 6 months it will be built. Whereas the US will send a team of useless characters to go check out the scenery then come back in 3 months to check out more scenery and 5 years later nothing will have been done. All the while in this time the Chinese will have built roads, bridges, tunnels and all kinds of infrastructure. ADVICE FOR INVESTORS “My advice is to have a diversified portfolio. You have to have some equities, some bonds, real estate and precious metals.” In my view it will not end well. This era of artificially low and market distorting interest rate structure will end terribly. There is a popular notion now of ‘sell everything’ but this is a flawed idea. You sell everything and you have all this money now, what will you do? Deposit it in banks? What happens when the bank goes bankrupt? In practise it is very dangerous to have all your money with one bank.
Abstract written by, Karan Singh |
|||
2011 2012 2013 2014 |
 |
||
| THEMES - Normally a Thursday "Themes" Post & a Friday "Flows" Post | |||
I - POLITICAL |
|||
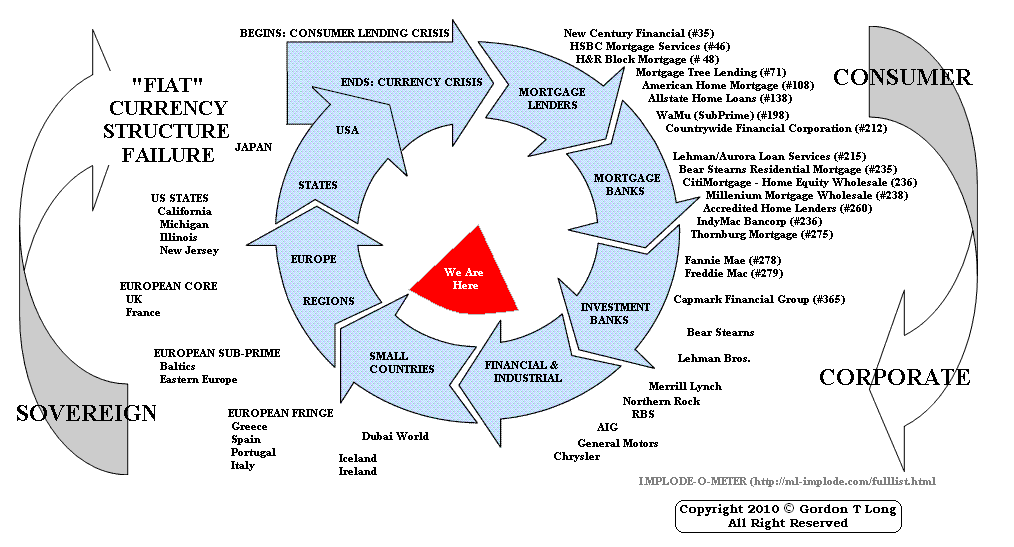
CENTRAL PLANNING - SHIFTING ECONOMIC POWER - STATISM
MACRO MAP - EVOLVING ERA OF CENTRAL PLANNING
|
G | THEME | |
| - - CRISIS OF TRUST - Era of Uncertainty | G | THEME | |
CORRUPTION & MALFEASANCE - MORAL DECAY - DESPERATION - RESENTMENT. |
US | THEME PAGE |  |
| - - SECURITY-SURVEILLANCE COMPLEX - STATISM | G | THEME | |
| - - CATALYSTS - FEAR (POLITICALLY) & GREED (FINANCIALLY) | G | THEME | |
II-ECONOMIC |
|||
| GLOBAL RISK | |||
| - GLOBAL FINANCIAL IMBALANCE - FRAGILITY, COMPLEXITY & INSTABILITY | G | THEME | |
| - - SOCIAL UNREST - INEQUALITY & A BROKEN SOCIAL CONTRACT | US | THEME | |
| - - ECHO BOOM - PERIPHERAL PROBLEM | M | THEME | |
| - -GLOBAL GROWTH & JOBS CRISIS | |||
| - - - PRODUCTIVITY PARADOX - NATURE OF WORK | THEME | MA w/ CHS |
|
| 01-08-16 | THEME | MA w/ CHS |
|
| - - - STANDARD OF LIVING - EMPLOYMENT CRISIS, SUB-PRIME ECONOMY | US | THEME | MA w/ CHS |
III-FINANCIAL |
|||
|
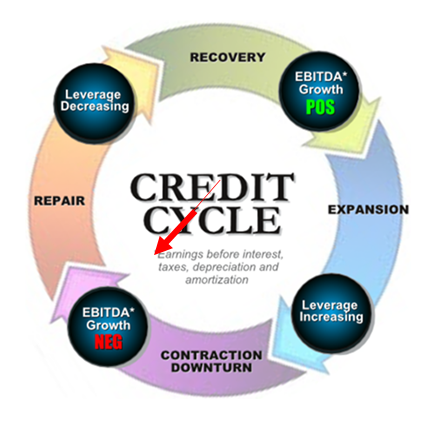
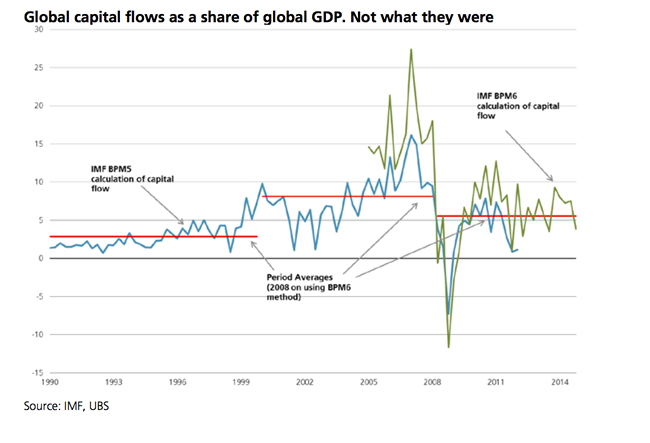
FLOWS - Liqudity, Credit & Debt
|
MATA RISK ON-OFF |
THEME |
w/ R Duncan |
|
|||
| CRACKUP BOOM - ASSET BUBBLE | 12-31-15 | THEME | |
| SHADOW BANKING - LIQUIDITY / CREDIT ENGINE | M | THEME | |
| GENERAL INTEREST |
|
||
| STRATEGIC INVESTMENT INSIGHTS - Weekend Coverage | |||
|
|||
|
SII | ||
|
SII | ||
|
SII | ||
|
SII | ||
| TO TOP | |||


Read More - OUR RESEARCH - Articles Below

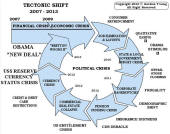
Tipping Points Life Cycle - Explained
Click on image to enlarge
TO TOP
 |
YOUR SOURCE FOR THE LATEST THINKING & RESEARCH
|
�
TO TOP