|
JOHN RUBINO'SLATEST BOOK |
|||||||||||||||||||||||||||||||||||||||||||||||||||||||||||||||||||||||||||||||||||||||||||||||||||||||||||||||||||||||||||||||||||||||||||||||||||||||||||||||||||||||||||||||||||||||||||||||||||||||||||||||||||||||||||||||||||||||||||||||||||||||||||||||||||||||||||||||||||||||||||||||||||||||||||||||||||||||||||||
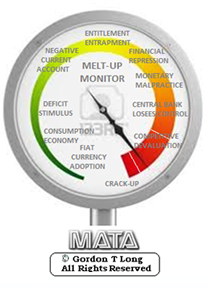
"MELT-UP MONITOR "
Meltup Monitor: FLOWS - The Currency Cartel Carry Cycle - 09 Dec 2013 Meltup Monitor: FLOWS - Liquidity, Credit & Debt - 04 Dec 2013 Meltup Monitor: Euro Pressure Going Critical - 28- Nov 2013 Meltup Monitor: A Regression-to-the-Exponential Mean Required - 25 Nov 2013
|

![]()
"DOW 20,000 "
Lance Roberts Charles Hugh Smith John Rubino Bert Dohman & Ty Andros
|

HELD OVER
Currency Wars
Euro Experiment
Sultans of Swap
Extend & Pretend
Preserve & Protect
Innovation
Showings Below
"Currency Wars "
|


"SULTANS OF SWAP" archives open ACT II ACT III
ALSO Sultans of Swap: Fearing the Gearing! Sultans of Swap: BP Potentially More Devistating than Lehman! |

"EURO EXPERIMENT"
archives open EURO EXPERIMENT : ECB's LTRO Won't Stop Collateral Contagion!
EURO EXPERIMENT: |

![]()
"INNOVATION"
archives open |

"PRESERVE & PROTE CT"
archives open |


Fri. Feb. 19th , 2016
Follow Our Updates
on TWITTER
https://twitter.com/GordonTLong
AND FOR EVEN MORE TWITTER COVERAGE
![]()
| FEBRUARY | ||||||
| S | M | T | W | T | F | S |
| 1 | 2 | 3 | 4 | 5 | 6 | |
| 7 | 8 | 9 | 10 | 11 | 12 | 13 |
| 14 | 15 | 16 | 17 | 18 | 19 | 20 |
| 21 | 22 | 23 | 24 | 25 | 26 | 27 |
| 28 | 29 | |||||
KEY TO TIPPING POINTS |
| 1- Bond Bubble |
| 2 - Risk Reversal |
| 3 - Geo-Political Event |
| 4 - China Hard Landing |
| 5 - Japan Debt Deflation Spiral |
| 6- EU Banking Crisis |
| 7- Sovereign Debt Crisis |
| 8 - Shrinking Revenue Growth Rate |
| 9 - Chronic Unemployment |
| 10 - US Stock Market Valuations |
| 11 - Global Governance Failure |
| 12 - Chronic Global Fiscal ImBalances |
| 13 - Growing Social Unrest |
| 14 - Residential Real Estate - Phase II |
| 15 - Commercial Real Estate |
| 16 - Credit Contraction II |
| 17- State & Local Government |
| 18 - Slowing Retail & Consumer Sales |
| 19 - US Reserve Currency |
| 20 - US Dollar |
| 21 - Financial Crisis Programs Expiration |
| 22 - US Banking Crisis II |
| 23 - China - Japan Regional Conflict |
| 24 - Corruption |
| 25 - Public Sentiment & Confidence |
| 26 - Food Price Pressures |
| 27 - Global Output Gap |
| 28 - Pension - Entitlement Crisis |
| 29 - Central & Eastern Europe |
| 30 - Terrorist Event |
| 31 - Pandemic / Epidemic |
| 32 - Rising Inflation Pressures & Interest Pressures |
| 33 - Resource Shortage |
| 34 - Cyber Attack or Complexity Failure |
| 35 - Corporate Bankruptcies |
| 36 - Iran Nuclear Threat |
| 37- Finance & Insurance Balance Sheet Write-Offs |
| 38- Government Backstop Insurance |
| 39 - Oil Price Pressures |
| 40 - Natural Physical Disaster |
Reading the right books?
No Time?

We have analyzed & included
these in our latest research papers Macro videos!
![]()
OUR MACRO ANALYTIC
CO-HOSTS
John Rubino's Just Released Book

![]()
Charles Hugh Smith's Latest Books
![]()
![]()
Our Macro Watch Partner
Richard Duncan Latest Books

MACRO ANALYTIC
GUESTS
F William Engdahl

![]()

![]()

![]()

![]()

![]()
OTHERS OF NOTE
![]()
![]()

![]()


![]()
Book Review- Five Thumbs Up
for Steve Greenhut's
Plunder!

![]()
|
Have your own site? Offer free content to your visitors with TRIGGER$ Public Edition!
Sell TRIGGER$ from your site and grow a monthly recurring income!
Contact [email protected] for more information - (free ad space for participating affiliates).
HOTTEST TIPPING POINTS |
Theme Groupings |
||
We post throughout the day as we do our Investment Research for: LONGWave - UnderTheLens - Macro
|
|||
|
MOST CRITICAL TIPPING POINT ARTICLES TODAY
|
|
||
| THEMES - Normally a Thursday "Themes" Post & a Friday "Flows" Post | |||
III-FINANCIAL |
|||
|
FLOWS - Liqudity, Credit & Debt
|
MATA RISK ON-OFF |
THEME |
w/ R Duncan |
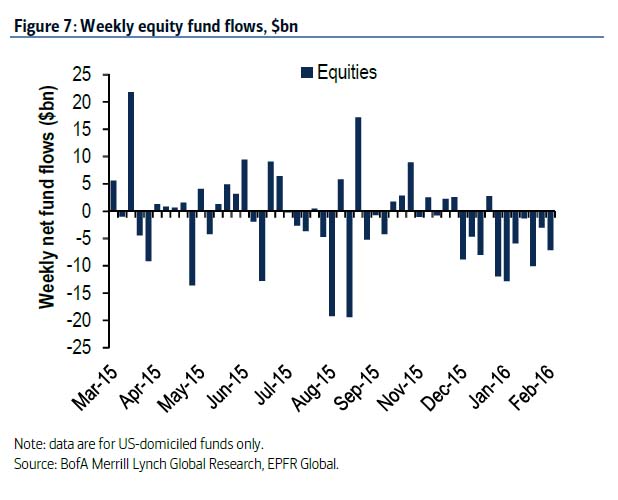
"Capitulation": Longest Streak Of Equity Outflows Since 2008;Biggest Gold Inflows Since 2010Submitted by Tyler Durden on 02/19/2016 09:16 -0500
The latest Lipper fund flow data is an and it is not pretty: in the latest week, there was $12.2 billion in equity outflows, the largest weekly redemption in 5 months...
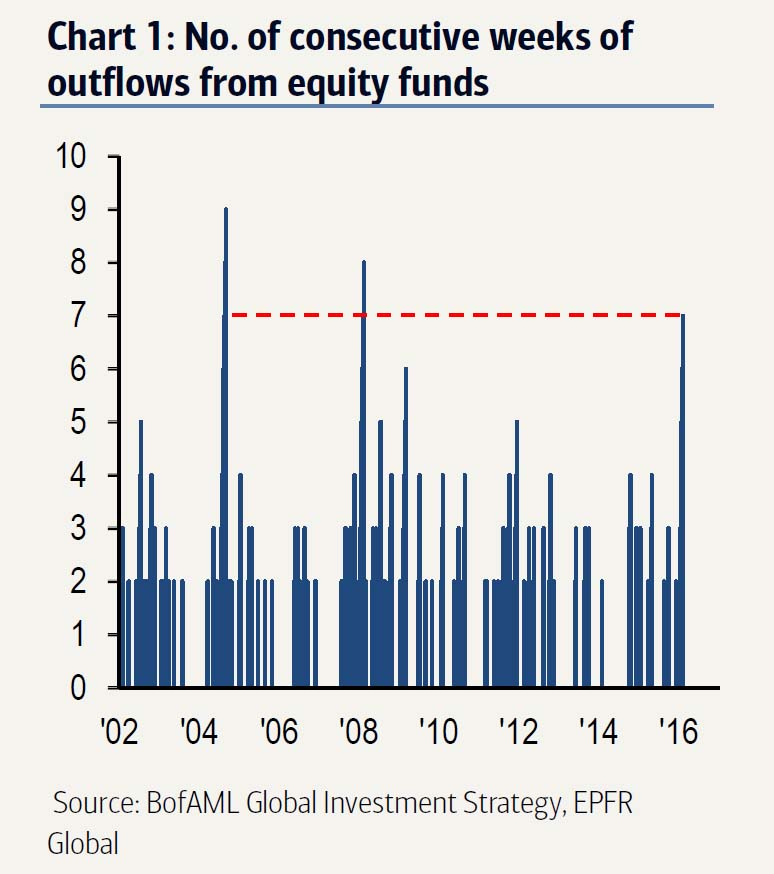
... and more importantly, this represents 7 straight weeks of outflows: the longest streak since 2008.
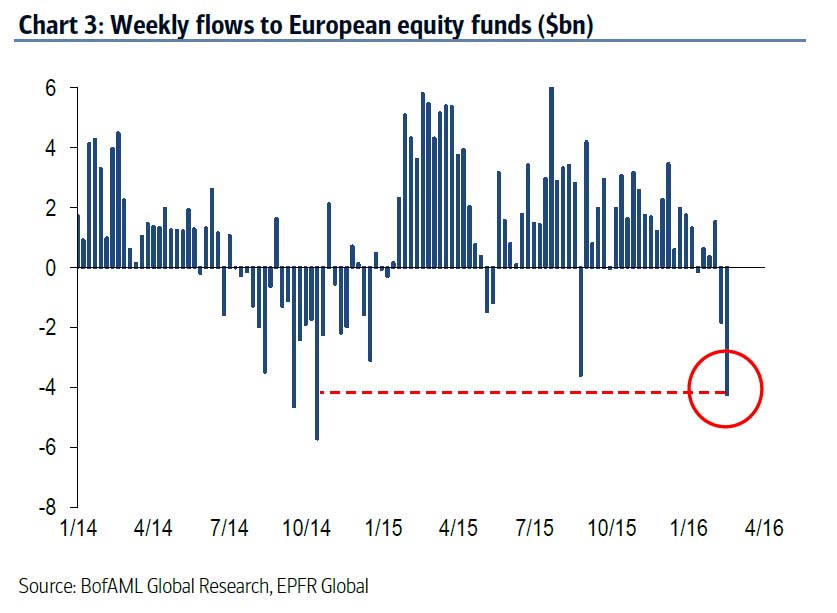
Concurrent with the flight from US equities, we have seen the biggest European equity redemptions since October 14:
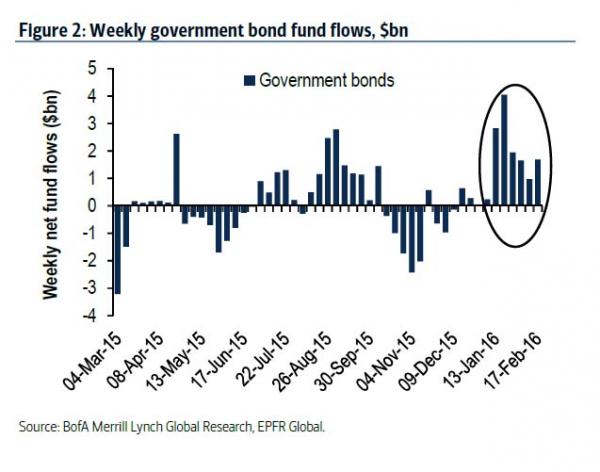
This was offset by an inverse 7 consecutive weeks of government bond inflows, with $1.69bn in fund deposits in the last week up from $0.98 billion, and explains who has been buying all those Treasurys that SWFs, EMs and China have been selling.
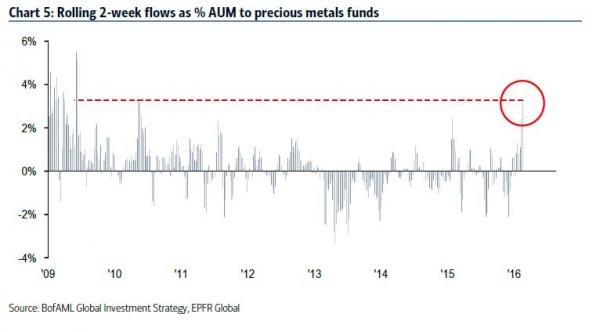
And the punchline: we just had the biggest 2-week gold inflow ($3.2bn) since May’10, which according to BofA is a "hedge against “risk-off” & “dollar-off”
Michael Hartnett's summary:
The only problem is that while this capitulation shoudl have led to buying at the 1812 bottom, the surge in stocks had nothing to do with bulls buying, and everything to do with shorts covering. And now that shorts have largely covered, even as buybacks continue, all those who have delevered and unwound position, have a choice: buy at ridiculously high valuations at a time when the S&P is facing 7 consecutive quarters of negative annual earnings... or wait for the market to once again crash before stepping in. |
|||
|
2013 2014 |
 |
||
Why Negative Interest RatesSpell Doom For CapitalismPosted:Thu, 18 Feb 2016 22:40:00 GMT
. . |
|||
TIPPING POINTS, STUDIES, THESIS, THEMES & SII COVERAGE THIS WEEK PREVIOUSLY POSTED - (BELOW)
|
|||
| MOST CRITICAL TIPPING POINT ARTICLES THIS WEEK - Feb 14th, 2016 to Feb 20th, 2016 | |||
| TIPPING POINTS - This Week - Normally a Tuesday Focus | |||
| BOND BUBBLE | 1 | ||
| RISK REVERSAL - WOULD BE MARKED BY: Slowing Momentum, Weakening Earnings, Falling Estimates | 2 | ||
| RISK REVERSAL - WOULD BE MARKED BY: Slowing Momentum, Weakening Earnings, Falling Estimates | 2 | ||
"A Market Collapse Is On The Horizon"Submitted by Gail Tverberg via OilPrice.com, What is ahead for 2016? Most people don’t realize how tightly the following are linked: 1. Growth in debt It looks to me as though this linkage is about to cause a very substantial disruption to the economy, as oil limits, as well as other energy limits, cause a rapid shift from the benevolent version of the economic supercycle to the portion of the economic supercycle reflecting contraction. Many people have talked about Peak Oil, theLimits to Growth, and the Debt Supercycle without realizing that the underlying problem is really the same–the fact the we are reaching the limits of a finite world. There are actually a number of different kinds of limits to a finite world, all leading toward the rising cost of commodity production. I will discuss these in more detail later. In the past, the contraction phase of the supercycle seems to have been caused primarily by too high a population relative to resources. This time, depleting fossil fuels–particularly oil–plays a major role. Other limits contributing to the end of the current debt supercycle include rising pollution and depletion of resources other than fossil fuels. The problem of reaching limits in a finite world manifests itself in an unexpected way: slowing wage growth for non-elite workers. Lower wages mean that these workers become less able to afford the output of the system. These problems first lead to commodity oversupply and very low commodity prices. Eventually these problems lead to falling asset prices and widespread debt defaults. These problems are the opposite of what many expect, namely oil shortages and high prices. This strange situation exists because the economy is a networked system. Feedback loops in a networked system don’t necessarily work in the way people expect. I expect that the particular problem we are likely to reach in 2016 is limits to oil storage. This may happen at different times for crude oil and the various types of refined products. As storage fills, prices can be expected to drop to a very low level–less than $10 per barrel for crude oil, and correspondingly low prices for the various types of oil products, such as gasoline, diesel, and asphalt. We can then expect to face a problem with debt defaults, failing banks, and failing governments (especially of oil exporters). The idea of a bounce back to new higher oil prices seems exceedingly unlikely, in part because of the huge overhang of supply in storage, which owners will want to sell, keeping supply high for a long time. Furthermore, the underlying cause of the problem is the failure of wages of non-elite workers to rise rapidly enough to keep up with the rising cost of commodity production, particularly oil production. Because of falling inflation-adjusted wages, non-elite workers are becoming increasingly unable to afford the output of the economic system. As non-elite workers cut back on their purchases of goods, the economy tends to contract rather than expand. Efficiencies of scale are lost, and debt becomes increasingly difficult to repay with interest. The whole system tends to collapse. How the Economic Growth Supercycle Works, in an Ideal Situation In an ideal situation, growth in debt tends to stimulate the economy. The availability of debt makes the purchase of high-priced goods such as factories, homes, cars, and trucks more affordable. All of these high-priced goods require the use of commodities, including energy products and metals. Thus, growing debt tends to add to the demand for commodities, and helps keep their prices higher than the cost of production, making it profitable to produce these commodities. The availability of profits encourages the extraction of an ever-greater quantity of energy supplies and other commodities. The growing quantity of energy supplies made possible by this profitability can be used to leverage human labor to an ever-greater extent, so that workers become increasingly productive. For example, energy supplies help build roads, trucks, and machines used in factories, making workers more productive. As a result, wages tend to rise, reflecting the greater productivity of workers in the context of these new investments. Businesses find that demand for their goods and services grows because of the growing wages of workers, and governments find that they can collect increasing tax revenue. The arrangement of repaying debt with interest tends to work well in this situation. GDP grows sufficiently rapidly that the ratio of debt to GDP stays relatively flat. Over time, the cost of commodity production tends to rise for several reasons: 1. Population tends to grow over time, so the quantity of agricultural land available per person tends to fall. Higher-priced techniques (such as irrigation, better seeds, fertilizer, pesticides, herbicides) are required to increase production per acre. Similarly, rising population gives rise to a need to produce fresh water using increasingly high-priced techniques, such as desalination. 2. Businesses tend to extract the least expensive fuels such as oil, coal, natural gas, and uranium first. They later move on to more expensive to extract fuels, when the less-expensive fuels are depleted. For example, Figure 1 shows the sharp increase in the cost of oil extraction that took place about 1999.
Figure 1. Figure by Steve Kopits of Westwood Douglas showing the trend in per-barrel capital expenditures for oil exploration and production. CAGR is “Compound Annual Growth Rate.” 3. Pollution tends to become an increasing problem because the least polluting commodity sources are used first. When mitigations such as substituting renewables for fossil fuels are used, they tend to be more expensive than the products they are replacing. The leads to the higher cost of final products. 4. Overuse of resources other than fuels becomes a problem, leading to problems such as the higher cost of producing metals, deforestation, depleted fish stocks, and eroded topsoil. Some workarounds are available, but these tend to add costs as well. As long as the cost of commodity production is rising only slowly, its increasing cost is benevolent. This increase in cost adds to inflation in the price of goods and helps inflate away prior debt, so that debt is easier to pay. It also leads to asset inflation, making the use of debt seem to be a worthwhile approach to finance future economic growth, including the growth of energy supplies. The whole system seems to work as an economic growth pump, with the rising wages of non-elite workers pushing the growth pump along. The Big “Oops” Comes when the Price of Commodities Starts Rising Faster than Wages of Non-Elite Workers Clearly the wages of non-elite workers need to be rising faster than commodity prices in order to push the economic growth pump along. The economic pump effect is lost when the wages of non-elite workers start falling, relative to the price of commodities. This tends to happen when the cost of commodity production begins rising rapidly, as it did for oil after 1999 (Figure 1). The loss of the economic pump effect occurs because the rising cost of oil (or electricity, or food, or other energy products) forces workers to cut back on discretionary expenditures. This is what happened in the 2003 to 2008 period as oil prices spiked and other energy prices rose sharply. (See my article Oil Supply Limits and the Continuing Financial Crisis.) Non-elite workers found it increasingly difficult to afford expensive products such as homes, cars, and washing machines. Housing prices dropped. Debt growth slowed, leading to a sharp drop in oil prices and other commodity prices.
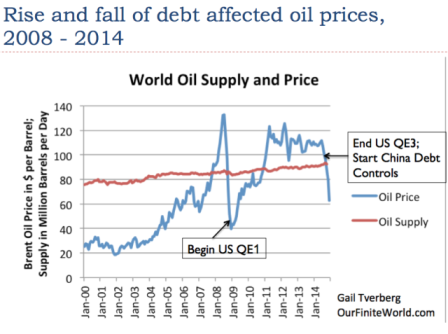
Figure 2. World oil supply and prices based on EIA data. It was somewhat possible to “fix” low oil prices through the use of Quantitative Easing (QE) and the growth of debt at very low interest rates, after 2008. In fact, these very low interest rates are what encouraged the very rapid growth in the production of US crude oil, natural gas liquids, and biofuels. Now, debt is reaching limits. Both the US and China have (in a sense) “taken their foot off the economic debt accelerator.” It doesn’t seem to make sense to encourage more use of debt, because recent very low interest rates have encouraged unwise investments. In China, more factories and homes have been built than the market can absorb. In the US, oil “liquids” production rose faster than it could be absorbed by the world market when prices were over $100 per barrel. This led to the big price drop. If it were possible to produce the additional oil for a very low price, say $20 per barrel, the world economy could probably absorb it. Such a low selling price doesn’t really “work” because of the high cost of production. Debt is important because it can help an economy grow, as long as the total amount of debt does not become unmanageable. Thus, for a time, growing debt can offset the adverse impact of the rising cost of energy products. We know that oil prices began to rise sharply in the 1970s, and in fact other energy prices rose as well.
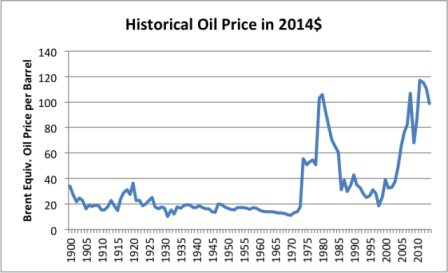
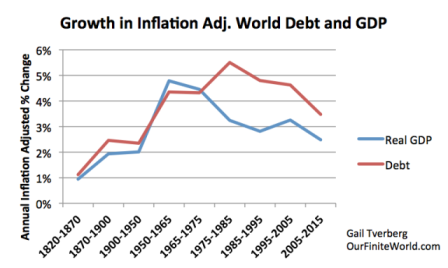
Figure 3. Historical World Energy Price in 2014$, from BP Statistical Review of World History 2015. Looking at debt growth, we find that it rose rapidly, starting about the time oil prices started spiking. Former Director of the Office of Management and Budget, David Stockman, talks about “The Distastrous 40-Year Debt Supercycle,” which he believes is now ending.
Figure 4. Worldwide average inflation-adjusted annual growth rates in debt and GDP, for selected time periods. Seepost on debt for explanation of methodology. In recent years, we have been reaching a situation where commodity prices have been rising faster than the wages of non-elite workers. Jobs that are available tend to be low-paid service jobs. Young people find it necessary to stay in school longer. They also find it necessary to delay marriage and postpone buying a car and home. All of these issues contribute to the falling wages of non-elite workers. Some of these individuals are, in fact, getting zero wages, because they are in school longer. Individuals who retire or voluntarily leave the work force further add to the problem of wages no longer rising sufficiently to afford the output of the system. The US government has recently decided to raise interest rates. This further reduces the buying power of non-elite workers. We have a situation where the “economic growth pump,” created through the use of a rising quantity of cheap energy products plus rising debt, is disappearing. While homes, cars, and vacation travel are available, an increasing share of the population cannot afford them. This tends to lead to a situation where commodity prices fall below the cost of production for a wide range of types of commodities, making the production of commodities unprofitable. In such a situation, a person expects companies to cut back on production. Many defaults may occur. China has acted as a major growth pump for the world for the last 15 years, since it joined the World Trade Organization in 2001. China’s growth is now slowing, and can be expected to slow further. Its growth was financed by a huge increase in debt. Paying back this debt is likely to be a problem.
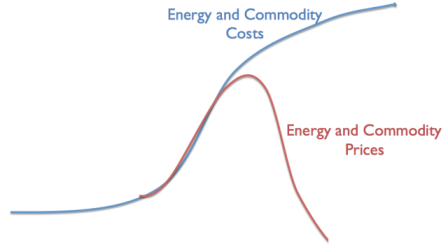
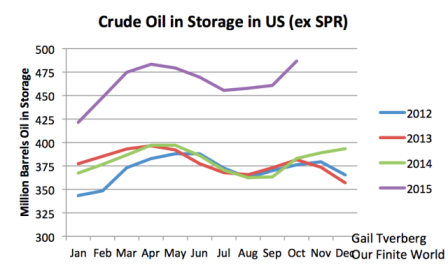
Figure 5. Author’s illustration of problem we are now encountering. Thus, we seem to be coming to the contraction portion of the debt supercycle. This is frightening, because if debt is contracting, asset prices (such as stock prices and the price of land) are likely to fall. Banks are likely to fail, unless they can transfer their problems to others–owners of the bank or even those with bank deposits. Governments will be affected as well, because it will become more expensive to borrow money, and because it becomes more difficult to obtain revenue through taxation. Many governments may fail as well for that reason. The U. S. Oil Storage Problem Oil prices began falling in the middle of 2014, so we might expect oil storage problems to start about that time, but this is not exactly the case. Supplies of US crude oil in storage didn’t start rising until about the end of 2014.
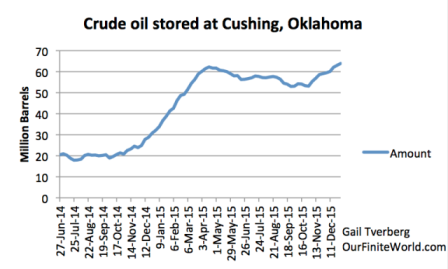
Figure 6. US crude oil in storage, excluding Strategic Petroleum Reserve, based on EIA data. Once crude oil supplies started rising rapidly, they increased by about 90 million barrels between December 2014 and April 2015. After April 2015, supplies dipped again, suggesting that there is some seasonality to the growing crude oil supply. The most “dangerous” time for rapidly rising amounts added to storage would seem to be between December 31 and April 30. According to the EIA, maximum crude oil storage is 551 million barrels of crude oil (considering all storage facilities). Adding another 90 million barrels of oil (similar to the run-up between Dec. 2014 and April 2015) would put the total over the 551 million barrel crude oil capacity. Cushing, Oklahoma, is the largest storage area for crude oil. According to the EIA, maximum working storage for the facility is 73 million barrels. Oil storage at Cushing since oil prices started declining is shown in Figure 7.
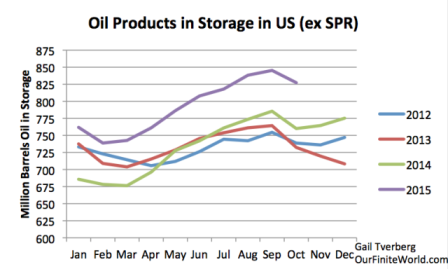
Figure 7. Quantity of crude oil stored at Cushing between June 27, 2014, and June 1, 2016, based on EIA data. Clearly the same kind of run up in oil storage that occurred between December and April one year ago cannot all be stored at Cushing, if maximum working capacity is only 73 million barrels, and the amount currently in storage is 64 million barrels. Another way of storing oil is as finished products. Here, the run-up in storage began earlier (starting in mid-2014) and stabilized at about 65 million barrels per day above the prior year, by January 2015. Clearly, if companies can do some pre-planning, they would prefer not to refine products for which there is little market. They would rather store unneeded oil as crude, rather than as refined products.
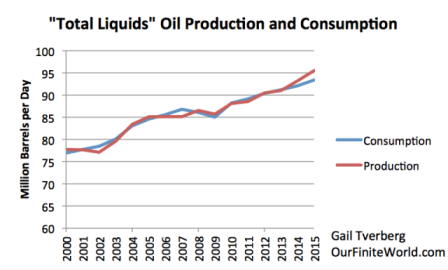
Figure 8. Total Oil Products in Storage, based on EIA data. EIA indicates that the total capacity for oil products is 1,549 million barrels. Thus, in theory, the amount of oil products stored can be increased by as much as 700 million barrels, assuming that the products needing to be stored and the locations where storage are available match up exactly. In practice, the amount of additional storage available is probably quite a bit less than 700 million barrels because of mismatch problems. In theory, if companies can be persuaded to refine more products than they can sell, the amount of products that can be stored can rise significantly. Even in this case, the amount of storage is not unlimited. Even if the full 700 million barrels of storage for crude oil products is available, this corresponds to less than one million barrels a day for two years, or two million barrels a day for one year. Thus, products storage could easily be filled as well, if demand remains low. At this point, we don’t have the mismatch between oil production and consumption fixed. In fact, both Iraq and Iran would like to increase their production, adding to the production/consumption mismatch. China’s economy seems to be stalling, keeping its oil consumption from rising as quickly as in the past, and further adding to the supply/demand mismatch problem. Figure 9 shows an approximation to our mismatch problem. As far as I can tell, the problem is still getting worse, not better.
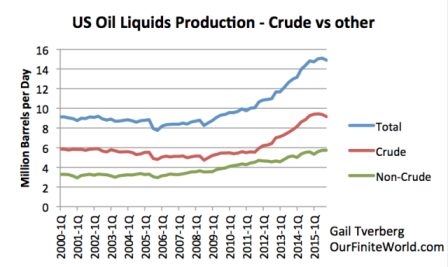
Figure 9. Total liquids oil production and consumption, based on a combination of BP and EIA data. There has been a lot of talk about the United States reducing its production, but the impact so far has been small, based on data from EIA’s International Energy Statistics and its December 2015 Monthly Energy Review.
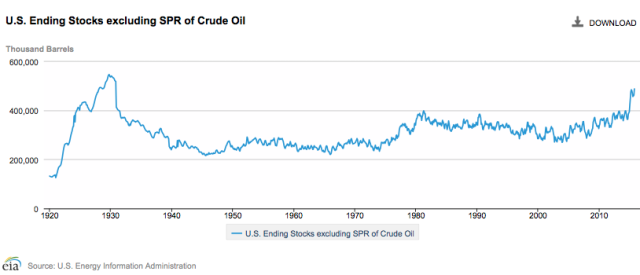
Figure 10. US quarterly oil liquids production data, based on EIA’s International Energy Statistics and Monthly Energy Review. Based on information through November from EIA’s Monthly Energy Review, total liquids production for the US for the year 2015 will be about 700,000 barrels per day higher than it was for 2014. This increase is likely greater than the increase in production by either Saudi Arabia or Iraq. Perhaps in 2016, oil production of the US will start decreasing, but so far, increases in biofuels and natural gas liquids are partly offsetting recent reductions in crude oil production. Also, even when companies are forced into bankruptcy, oil production does not necessarily stop because of the potential value of the oil to new owners. Figure 11 shows that very high stocks of oil were a problem, way back in the 1920s. There were other similarities to today’s problems as well, including a deflating debt bubble and low commodity prices. Thus, we should not be too surprised by high oil stocks now, when oil prices are low.
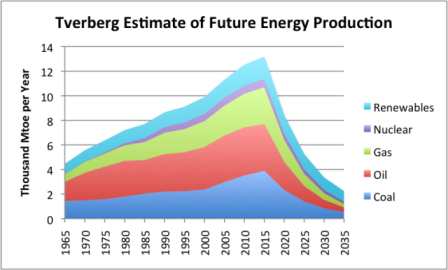
(Click to enlarge) Figure 11. US ending stock of crude oil, excluding the strategic petroleum reserve. Figure by EIA. Many people overlook the problems today because the US economy tends to be doing better than that of the rest of the world. The oil storage problem is really a world problem, however, reflecting a combination of low demand growth (caused by low wage growth and lack of debt growth, as the world economy hits limits) continuing supply growth (related to very low interest rates making all kinds of investment appear profitable and new production from Iraq and, in the near future, Iran). Storage on ships is increasingly being filled up and storage in Western Europe is 97% filled. Thus, the US is quite likely to see a growing need for oil storage in the year ahead, partly because there are few other places to put the oil, and partly because the gap between supply and demand has not yet been fixed. What is Ahead for 2016? 1. Problems with a slowing world economy are likely to become more pronounced, as China’s growth problems continue, and as other commodity-producing countries such as Brazil, South Africa, and Australia experience recession. There may be rapid shifts in currencies, as countries attempt to devalue their currencies, to try to gain an advantage in world markets. Saudi Arabia may decide to devalue its currency, to get more benefit from the oil it sells. 2. Oil storage seems likely to become a problem sometime in 2016. In fact, if the run-up in oil supply is heavily front-ended to the December to April period, similar to what happened a year ago, lack of crude oil storage space could become a problem within the next three months. Oil prices could fall to $10 or below. We know that for natural gas and electricity, prices often fall below zero when the ability of the system to absorb more supply disappears. It is not clear the oil prices can fall below zero, but they can certainly fall very low. Even if we can somehow manage to escape the problem of running out of crude oil storage capacity in 2016, we could encounter storage problems of some type in 2017 or 2018. 3. Falling oil prices are likely to cause numerous problems. One is debt defaults, both for oil companies and for companies making products used by the oil industry. Another is layoffs in the oil industry. Another problem is negative inflation rates, making debt harder to repay. Still another issue is falling asset prices, such as stock prices and prices of land used to produce commodities. Part of the reason for the fall in price has to do with the falling price of the commodities produced. Also, sovereign wealth funds will need to sell securities, to have money to keep their economies going. The sale of these securities will put downward pressure on stock and bond prices. 4. Debt defaults are likely to cause major problems in 2016. As noted in the introduction, we seem to be approaching the unwinding of a debt supercycle. We can expect one company after another to fail because of low commodity prices. The problems of these failing companies can be expected to spread to the economy as a whole. Failing companies will lay off workers, reducing the quantity of wages available to buy goods made with commodities. Debt will not be fully repaid, causing problems for banks, insurance companies, and pension funds. Even electricity companies may be affected, if their suppliers go bankrupt and their customers become less able to pay their bills. 6. It is not clear that the complete unwind will take place in 2016, but a major piece of this unwind could take place in 2016, especially if crude oil storage fills up, pushing oil prices to less than $10 per barrel. 7. Whether or not oil storage fills up, oil prices are likely to remain very low, as the result of rising supply, barely rising demand, and no one willing to take steps to try to fix the problem. Everyone seems to think that someone else (Saudi Arabia?) can or should fix the problem. In fact, the problem is too large for Saudi Arabia to fix. The United States could in theory fix the current oil supply problem by taxing its own oil production at a confiscatory tax rate, but this seems exceedingly unlikely. Closing existing oil production before it is forced to close would guarantee future dependency on oil imports. A more likely approach would be to tax imported oil, to keep the amount imported down to a manageable level. This approach would likely cause the ire of oil exporters. 8. The many problems of 2016 (including rapid moves in currencies, falling commodity prices, and loan defaults) are likely to cause large payouts of derivatives, potentially leading to the bankruptcies of financial institutions, as they did in 2008. To prevent such bankruptcies, most governments plan to move as much of the losses related to derivatives and debt defaults to private parties as possible. It is possible that this approach will lead to depositors losing what appear to be insured bank deposits. At first, any such losses will likely be limited to amounts in excess of FDIC insurance limits. As the crisis spreads, losses could spread to other deposits. Deposits of employers may be affected as well, leading to difficulty in paying employees. 9. All in all, 2016 looks likely to be a much worse year than 2008 from a financial perspective. The problems will look similar to those that might have happened in 2008, but didn’t thanks to government intervention. This time, governments appear to be mostly out of approaches to fix the problems. 10. Two years ago, I put together the chart shown as Figure 12. It shows the production of all energy products declining rapidly after 2015. I see no reason why this forecast should be changed. Once the debt supercycle starts its contraction phase, we can expect a major reduction in both the demand and supply of all kinds of energy products.
Figure 12. Estimate of future energy production by author. Historical data based on BP adjusted to IEA groupings. Conclusion We are certainly entering a worrying period. We have not really understood how the economy works, so we have tended to assume we could fix one or another part of the problem. The underlying problem seems to be a problem of physics. The economy is a dissipative structure, a type of self-organizing system that forms in thermodynamically open systems. As such, it requires energy to grow. Ultimately, diminishing returns with respect to human labor–what some of us would call falling inflation-adjusted wages of non-elite workers–tends to bring economies down. Thus all economies have finite lifetimes, just as humans, animals, plants, and hurricanes do. We are in the unfortunate position of observing the end of our economy’s lifetime. Most energy research to date has focused on the Second Law of Thermodynamics. While this is a contributing problem, this is really not the proximate cause of the impending collapse. The Second Law of Thermodynamics operates in thermodynamically closed systems, which is not precisely the issue here. We know that historically collapses have tended to take many years. This collapse may take place more rapidly because today’s economy is dependent on international supply chains, electricity, and liquid fuels–things that previous economies were not dependent on.
|
|||
| GEO-POLITICAL EVENT | 3 | ||
| CHINA BUBBLE | 4 | ||
| JAPAN - DEBT DEFLATION | 5 | ||
EU BANKING CRISIS |
6 |
||
| TO TOP | |||
| MACRO News Items of Importance - This Week | |||
GLOBAL MACRO REPORTS & ANALYSIS |
|||
US ECONOMIC REPORTS & ANALYSIS |
|||
| CENTRAL BANKING MONETARY POLICIES, ACTIONS & ACTIVITIES | |||
| Market - WEDNESDAY STUDIES | |||
| STUDIES - MACRO pdf | |||
TECHNICALS & MARKET |
|
||
TECHNICALS & MARKET |
02-17-16 |
||
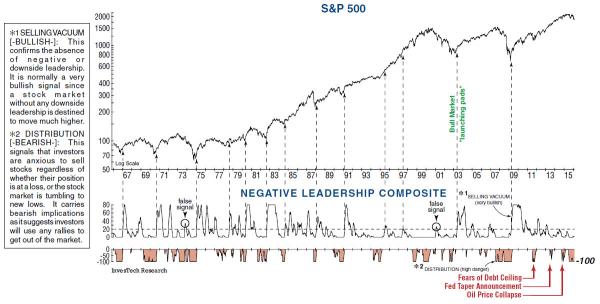
"Killer Wave" ConfirmsBig Bear Market LoomsExcerpted from James Stack's InvesTech.com, Technical Evidence: Confirming a bear market It’s been 26 years since we developed our Negative Leadership Composite (NLC) to help identify the best buying opportunities, as well as the highest risk markets. It’s pure common sense that broad upside leadership (and absence of downside or negative leadership) signifies or confirms a new bull market. It usually does the same for second or third bull market legs. This is shown when a bullish “SELLING VACUUM” [*1] appears in the NLC. Conversely, broad and increasing downside leadership –shown by “DISTRIBUTION” [shaded region *2]– will always confirm high risk early in a bear market by dropping to -100. Our challenge, at times like this, is distinguishing whether “DISTRIBUTION” might be caused by temporary factors, which was the case three times in the current bull market – the Congressional showdown over the debt limit, the market’s Fed “taper tantrum,” and the oil price collapse over a year ago. Judging by the depth, duration, and broadening sector contribution to the “DISTRIBUTION” in leadership, we must conclude that Wall Street is currently in a bear market.
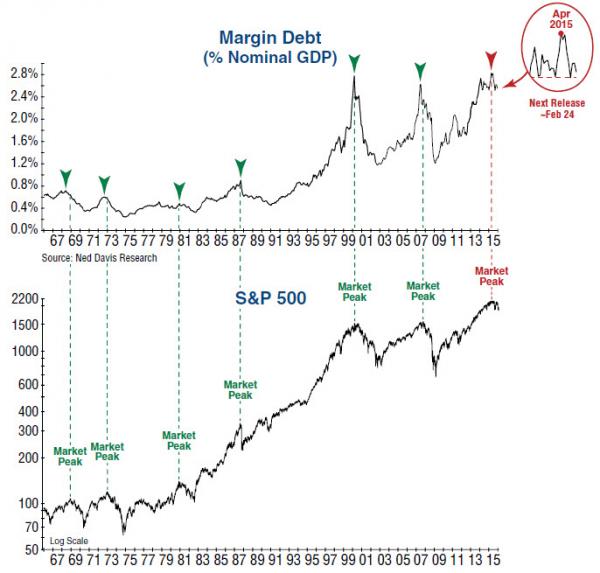
The run up in margin debt has also become an increasing concern in the past few years. This represents “hot money” borrowed to buy stocks on margin… that will likely panic as selling in a true bear market progresses.
Note that past peaks in margin debt have coincided with, or led, peaks in the stock market. That was also the case a year ago when margin debt peaked a month before the blue chip indexes. But as we’ve pointed out, the final peak cannot clearly be identified until margin debt falls enough to make new highs or peaks unlikely. Based on the volatile, high volume down days we’ve experienced since the start of this year, we anticipate margin debt may confirm a bear market when reported later this month by tumbling decisively through the support levels of the past 18 months. Two (almost three) major U.S. indexes already qualify as bear markets… Investors might be surprised to learn that most foreign stock markets –including London’s FTSE (Financial Times Stock Exchange) Index, the German DAX, and Tokyo Nikkei– are all off more than 20% from last year’s highs. China’s Shanghai Composite has tumbled 46% from its peak last June.
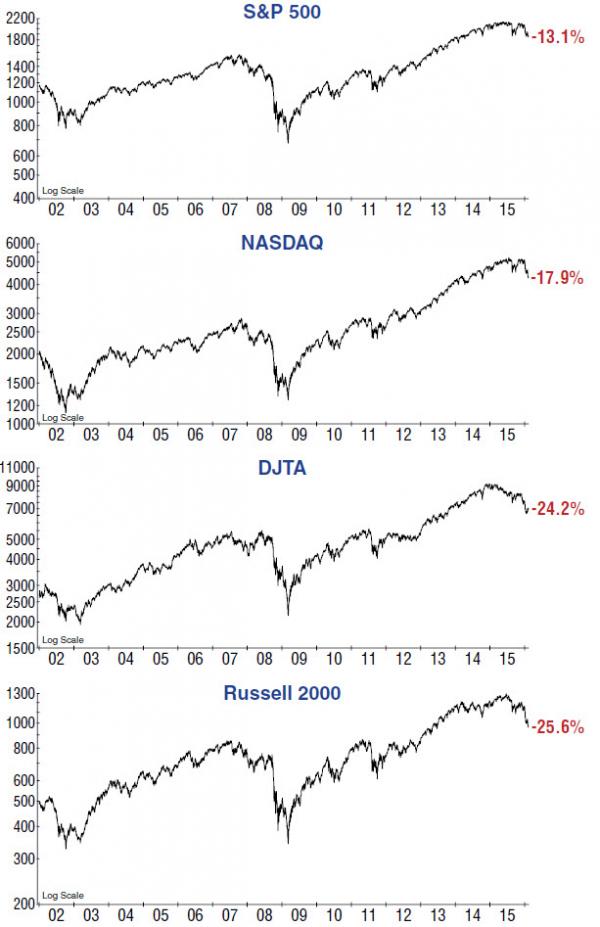
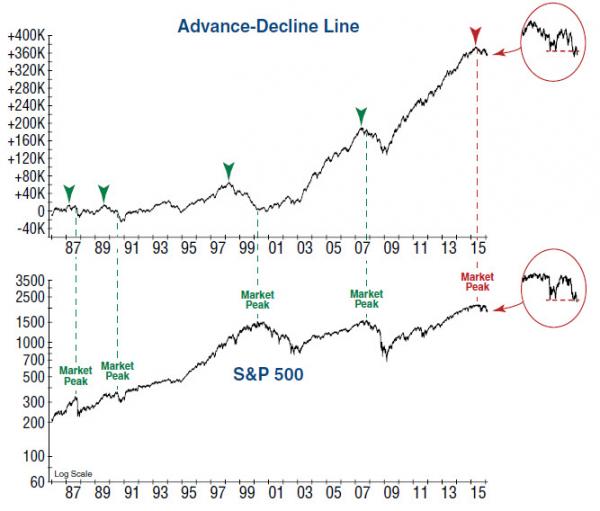
Globally, one of the safest places to be has been in solid blue chip stocks in the U.S. The S&P 500 Index and Dow Jones Industrial Average are approximately 13-14% off their peaks last May. Meanwhile, the Nasdaq Index is within several percentage points of hitting the -20% threshold of qualifying as a bear market. By comparison, the Dow Jones Transportation Average is already in bear market territory with a loss of -24%. And the premier small-cap Russell 2000 Index has tumbled over 25%. In summary, the bear market damage to many investors’ portfolios has already proven significantly more severe than what is portrayed by the more resilient blue chip DJIA and S&P 500. Even within the S&P 500 Index, over 60% of component stocks are down 20% from their 12-month highs, while 37% are down more than 30%! We also find little to cheer about in market breadth or participation. The Advance-Decline Line, which showed a bearish negative divergence with the S&P 500’s secondary peak in November, continues to weaken with –or ahead of– the blue chip indexes.
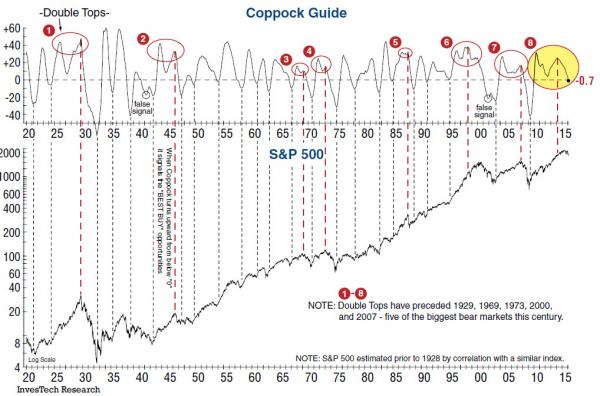
When the majority of “troops” are in retreat, it can become increasingly difficult for the “generals” to stand their ground. Without a measurable improvement in breadth, we believe this market will continue to struggle in the coming weeks and months. More bad news... The Coppock Guide, which has been weakening for almost 2 years, is now confirming a bear market. That’s bad news for the market in the near-term, but has positive implications down the road. This important indicator was developed more than 50 years ago by Edwin S. Coppock and has often been described as “a barometer of the market’s emotional state.” As such, it methodically tracks the ebb and flow of equity markets, moving slowly from one emotional extreme to the other. By calculation, the Coppock Guide is the 10-month weighted moving total of a 14-month rate of change plus an 11-month rate of change of a market index. While that sounds complicated, it’s actually an oscillator that reverses direction when long-term momentum in the market peaks in one direction or the other. Historically, the value of the Coppock Guide lies in signaling or confirming low risk buying opportunities that emerge once a bear market bottom is in place (black dotted lines on the graph below). And since market bottoms are typically sudden V-shaped reversals, it works amazingly well – as it did shortly after the bottom in 2009.
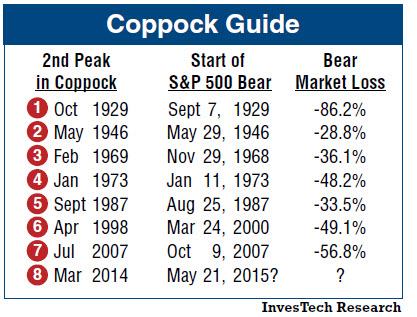
Unfortunately, the Coppock Guide is generally not as useful in identifying market peaks. One reason is that bull market tops are usually slow, rounding formations in which momentum –and the Coppock Guide– peak up to a year or more ahead of the market. Yet there are certain instances when it has proven invaluable at a market top… In the late 1960s a technician named Don Hahn observed another phenomenon about the Coppock Guide. When a double top occurs without the graph falling to “0” –a phenomenon that Hahn referred to as a “Killer Wave”– it confirms an extended bull market where psychological excesses can reach extremes. In those situations, the appearance of a second peak generally means a bear market has just begun or is not far off (see red dashed lines). The late 1990s was an exception. Killer Waves are rare, and they can be dangerous. This is only the 8th bull market in the past 95 years to see a double top in the Coppock. The table at right shows that in 5 of the previous cases the second peaks were associated with the start of the more notorious bear markets of the past century: 1929, 1969, 1973, 2000, and 2007.
The Coppock Guide is now projected to drop through “0” in February, which in the past carries over a 75% probability that a bear market has taken hold. Of course, that does not mean the bear market will soon end, and it would be foolish to attempt to second guess when or where the Coppock might bottom. But the more important message for defensive investors is this: Once the Coppock Guide does hit bottom and turns upward –by even 1 point– we will be presented with one of those historical buying opportunities that comes around only once or twice a decade. We can’t rush it… and we certainly can’t forecast it… but we can look forward to it and quickly recognize it when it does occur. So be patient, stay defensive, and remember that there is light at the end of the tunnel. |
|||
| COMMODITY CORNER - AGRI-COMPLEX | |||
| THESIS - Mondays Posts on Financial Repression & Posts on Thursday as Key Updates Occur | |||
|
2016 | THESIS 2016 |  |
| 2015 - FIDUCIARY FAILURE | 2015 | THESIS 2015 |  |
| 2014 - GLOBALIZATION TRAP | 2014 |  |
|
 |
|||
|
2013 2014 |
|
||
Felix Zulauf talks Financial Repression& Warns of What is AheadFRA Co-founder Gordon T. Long recently interviews Felix Zulauf, Founder and President at Zulauf Asset Management AG.
Mr. Zulauf focused on macro and strategic issues within the firm. In spring 2009 Zulauf Asset Management was split in two parts and Felix Zulauf fully owns the split-off Zulauf Asset Management AG focusing on some advisory activities to selected family offices and institutions including a US based global macro fund. Felix Zulauf always believed that the world economy and the financial markets move in cycles. That has helped him avoiding all the major casualties in the financial markets since the 1973/74 bear market in equities. He has been a member of Barron’s Roundtable for over 20 years. QUESTION: How would you define Financial Repression? FELIX ZULAUF: “Financial Repression is an attempt by the government and central banks to reduce free market forces and the freedom of individuals to do what they would do if they had the free choice. It is compounded by market manipulations such as money printing, regulations, and distorting the interest rate; which are the best capital allocator there is and much better than any committee or central bank. Government authorities force capital to be allocated wherever they want capital to be allocated and not where the market would allocate it. It is the beginning of an era that will lead to decisive decline of prosperity and individual freedom.” QUESTION: What type of economist would you consider yourself? FELIX ZULAUF: “I am closer to the Austrian School. It is important to know that economies and financial markets do not progress in a linear way. They are cyclical; there are expansions and contractions and recessions have the job to remove the excessive build up in expansions. Bear markets have the same job, to reduce excess in boom markets. This is a very natural action and reaction process.” QUESTION: You wrote the following – could you elaborate on it: FELIX ZULAUF:“At some point in time we have to get rid of the debt that we have. Obviously central banks are trying to do that by financial repression. The consensus among the investment community is that financial repression will work. I’m not so sure. Financial repression means that they put interest rates below the inflation rate, and by doing that the debt-to-GDP level of the different segments in an economy, the households, governments, etc., drops down over time. I’m not sure that policy will be successful, but for some more years they will try that. If it doesn’t work, then we will go into other things such as currency reforms, confiscation .. It’s very hard to imagine the world will solve its problems in a conventional way. More likely we will see more government controls on capital flows as things get out of control over time.” Central banks have used mechanisms to reduce the level of debt ration within the economy. They have tried these mechanisms for many years and it hasn’t worked. You have seen some deleveraging in parts of the world economy, but in total the world economy has leveraged more. Debt to GDP is the highest level it has been in modern history and therefore this route the central banks have taken has failed. QUESTION: Where are we in the possible outcomes you warned us of? FELIX ZULAUF: If it unfolds in a free market mechanism fashion then it would lead to massive bankruptcies but I doubt the authorities will allow this to play out be cause it can lead to a systemic collapse. I think eventually there will be another burden on taxpayers and there will be attempts to confiscate some of the wealth out there through whatever means they can think of to bring down and finance the debt. The bottom line is in the future we will be less wealthy. QUESTION: How will the leverage failure unfold? FELIX ZULAUF: I don’t know if there is a way to escape. Even if you made all the right decisions and came out a winner and were able to preserve your capital, they would most likely tax you on whatever gains you make. Ideologically, we are in a very highly socialist environment. You have to have a certain diversification as an investor and you have to make sure you’re in the right jurisdiction. QUESTION: How can the fed raise rates into a economy where broad fires are burning especially in credit markets? FELIX ZULAUF: Quantitative easing does not work. You cannot fix the problems rampant in today’s economies by printing mass amount of money. You have to solve problems from a political and economic angle but not by printing money. I don’t expect any further rate hike by the Fed, they are attempting normalize but it won’t work because the economy is soft. They have tried and I think it is becoming more and more apparent to them that money printing does not work. Rather than money printing I think they have adopted a bond yield target. Central banks are tired of QE, they realize they have to leave some pressure on the economy, politicians, and entrepreneurs move forward and make the necessary decisions. I don’t think this is a good message to the financial markets, because it means the financial markets have to suffer more pain until the central banks come in and attempt to fix the system again. QUESTION: What does the BOJ’s recent announcement of NIRP signal? FELIX ZULAUF: With the world economy growing at such low rates, we have a risk of running into systemic growth again. I suspect the Chinese will eventually let the currency go and then you have another deflation hit the world economy, this is when you run into another systemic crisis. Letting the currency go and letting the currency find its own equilibrium will lead to a central bank crisis. This affects pricing power and when pricing power is affected it trickles down to profit margins, and therefore corporate earnings are going to decline.
|
|||
2011 2012 2013 2014 |
 |
||
| THEMES - Normally a Thursday "Themes" Post & a Friday "Flows" Post | |||
I - POLITICAL |
|||
CENTRAL PLANNING - SHIFTING ECONOMIC POWER - STATISM
MACRO MAP - EVOLVING ERA OF CENTRAL PLANNING
|
G | THEME | |
| - - CRISIS OF TRUST - Era of Uncertainty | G | THEME | |
CORRUPTION & MALFEASANCE - MORAL DECAY - DESPERATION - RESENTMENT. |
US | THEME PAGE |  |
| - - SECURITY-SURVEILLANCE COMPLEX - STATISM | G | THEME | |
| - - CATALYSTS - FEAR (POLITICALLY) & GREED (FINANCIALLY) | G | THEME | |
II-ECONOMIC |
|||
| GLOBAL RISK | |||
| - GLOBAL FINANCIAL IMBALANCE - FRAGILITY, COMPLEXITY & INSTABILITY | G | THEME | |
| - - SOCIAL UNREST - INEQUALITY & A BROKEN SOCIAL CONTRACT | US | THEME | |
| - - ECHO BOOM - PERIPHERAL PROBLEM | M | THEME | |
| - -GLOBAL GROWTH & JOBS CRISIS | |||
| - - - PRODUCTIVITY PARADOX - NATURE OF WORK | THEME | MA w/ CHS |
|
| 01-08-16 | THEME | MA w/ CHS |
|
| - - - STANDARD OF LIVING - EMPLOYMENT CRISIS, SUB-PRIME ECONOMY | US | THEME | MA w/ CHS |
III-FINANCIAL |
|||
|
FLOWS - Liqudity, Credit & Debt
|
MATA RISK ON-OFF |
THEME |
w/ R Duncan |
Another Reason to Worry About BanksFor investors seeking reasons to worry about banks, here's another: They’ve lent a lot of money in currencies that borrowers will have a hard time paying back. The phenomenon illustrates how capital flows work in a financially integrated world — and how they can contribute to booms and busts. As the U.S. Federal Reserve and the European Central Bank held interest rates extremely low to support their own economies, they pushed banks to seek higher returns elsewhere, and also made borrowing in their currencies very attractive all around the world. The result was that the total amount of dollar and euro lending to non-bank borrowers outside the U.S. and the euro area grew 57 percent during the past six years — to $12.7 trillion, according to the Bank for International Settlements. The top chart shows how that looks. Such rapid credit growth is a classic precursor of financial crises, and the foreign-exchange element adds a nasty twist. The Fed's plans to increase interest rates, together with growing concerns about emerging markets, have caused the value of the dollar to rise sharply against a range of currencies. The euro has gained against some currencies, too. So for borrowers in countries such as Brazil and Turkey, whose currencies have weakened, the cost of paying back all that debt has shot up. The bottom chart shows a breakdown by country, estimating how much the local-currency value of dollar and euro debt to banks (including that of financial institutions, companies and governments) has grown as a share of gross domestic product during the past two years, due to exchange-rate changes alone. The result tends to be what we've seen happening in global markets. Concerns about defaults cause investors to flee — a response that, by pushing exchange rates down further and halting the flow of credit, makes those defaults ever more likely. Borrowing Binge
Currency Effect
The question then becomes whether lenders — those same banks whose share prices have gyrated in recent days — have enough equity capital to absorb the losses. If not, the financial distress can spread quickly, as the world learned in 2008. Can anything be done? Actually, yes. As the economist Helene Rey has noted, tougher limits on leverage — that is, on the amount that banks and others can borrow for each dollar in equity — could go a long way toward mitigating the global boom-bust cycle at little or no cost to the economy. Borrowers would have less opportunity to get overextended in the first place, and the financial system would be better prepared to absorb the losses if they did. Regulators have moved in that direction since 2008, but not far enough. Mark Whitehouse writes editorials on global economics and finance. This column does not necessarily reflect the opinion of the editorial board or Bloomberg LP and its owners. |
|||
| CRACKUP BOOM - ASSET BUBBLE | 12-31-15 | THEME | |
| SHADOW BANKING - LIQUIDITY / CREDIT ENGINE | M | THEME | |
| GENERAL INTEREST |
|
||
| STRATEGIC INVESTMENT INSIGHTS - Weekend Coverage | |||
 |
|||
|
SII | ||
|
SII | ||
|
SII | ||
|
SII | ||
| TO TOP | |||


 FELIX ZULAUF has worked in the financial markets and asset management for almost 40 years. He started his investment career as a trader for a large Swiss Bank and received training in research and portfolio management thereafter with several leading investment banks in New York, Zurich and in Paris. Felix joined Union Bank of Switzerland (UBS), Zurich, in 1977 and held several positions over the years including managing global mutual funds, heading the institutional portfolio management unit and at the same time acting as the global strategist for the UBS Group. After two years with a medium-sized Financial Organization as a member of the executive board, he founded his wholly owned Zulauf Asset Management AG in 1990, allowing him to independently practice his own individual investment philosophy.
Read More - OUR RESEARCH - Articles Below

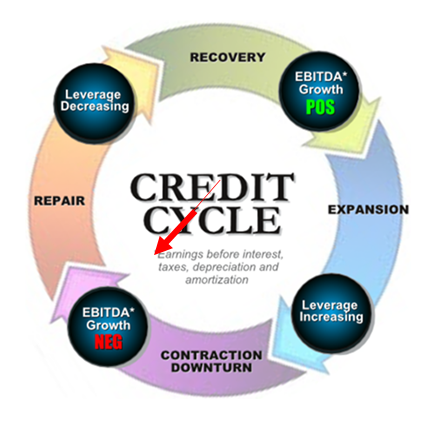
Tipping Points Life Cycle - Explained
Click on image to enlarge
TO TOP
 |
YOUR SOURCE FOR THE LATEST THINKING & RESEARCH
|
�
TO TOP