|
JOHN RUBINO'SLATEST BOOK |
|||||||||||||||||||||||||||||||||||||||||||||||||||||||||||||||||||||||||||||||||||||||||||||||||||||||||||||||||||||||||||||||||||||||||||||||||||||||||||||||||||||||||||||||||||||||||||||
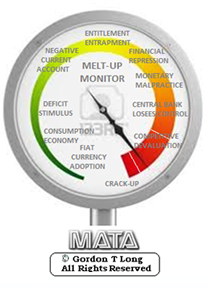
"MELT-UP MONITOR "
Meltup Monitor: FLOWS - The Currency Cartel Carry Cycle - 09 Dec 2013 Meltup Monitor: FLOWS - Liquidity, Credit & Debt - 04 Dec 2013 Meltup Monitor: Euro Pressure Going Critical - 28- Nov 2013 Meltup Monitor: A Regression-to-the-Exponential Mean Required - 25 Nov 2013
|

![]()
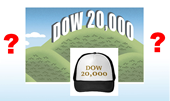
"DOW 20,000 "
Lance Roberts Charles Hugh Smith John Rubino Bert Dohman & Ty Andros
|
HELD OVER
Currency Wars
Euro Experiment
Sultans of Swap
Extend & Pretend
Preserve & Protect
Innovation
Showings Below
"Currency Wars "
|

"SULTANS OF SWAP" archives open ACT II ACT III
ALSO Sultans of Swap: Fearing the Gearing! Sultans of Swap: BP Potentially More Devistating than Lehman! |
"EURO EXPERIMENT"
archives open EURO EXPERIMENT : ECB's LTRO Won't Stop Collateral Contagion!
EURO EXPERIMENT: |
![]()
"INNOVATION"
archives open |

"PRESERVE & PROTE CT"
archives open |

Wed. Jan. 7th, 2015
Follow Our Updates
on TWITTER
https://twitter.com/GordonTLong
AND FOR EVEN MORE TWITTER COVERAGE
STRATEGIC MACRO INVESTMENT INSIGHTS
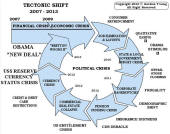
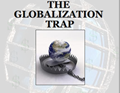 2014 THESIS: GLOBALIZATION TRAP
NOW AVAILABLE FREE to Trial Subscribers
185 Pages
What Are Tipping Poinits?
Understanding Abstraction & Synthesis
Global-Macro in Images: Understanding the Conclusions
![]()
| JANIUARY | ||||||
| S | M | T | W | T | F | S |
| 1 | 2 | 3 | ||||
| 4 | 5 | 6 | 7 | 8 | 9 | 10 |
| 11 | 12 | 13 | 14 | 15 | 16 | 17 |
| 18 | 19 | 20 | 21 | 22 | 23 | 24 |
| 25 | 262 | 27 | 28 | 29 | 30 | 30 |
KEY TO TIPPING POINTS |
| 1 - Risk Reversal |
| 2 - Japan Debt Deflation Spiral |
| 3- Bond Bubble |
| 4- EU Banking Crisis |
| 5- Sovereign Debt Crisis |
| 6 - China Hard Landing |
| 7 - Chronic Unemployment |
| 8 - Geo-Political Event |
| 9 - Global Governance Failure |
| 10 - Chronic Global Fiscal ImBalances |
| 11 - Shrinking Revenue Growth Rate |
| 12 - Iran Nuclear Threat |
| 13 - Growing Social Unrest |
| 14 - US Banking Crisis II |
| 15 - Residential Real Estate - Phase II |
| 16 - Commercial Real Estate |
| 17 - Credit Contraction II |
| 18- State & Local Government |
| 19 - US Stock Market Valuations |
| 20 - Slowing Retail & Consumer Sales |
| 21 - China - Japan Regional Conflict |
| 22 - Public Sentiment & Confidence |
| 23 - US Reserve Currency |
| 24 - Central & Eastern Europe |
| 25 - Oil Price Pressures |
| 26 - Rising Inflation Pressures & Interest Pressures |
| 27 - Food Price Pressures |
| 28 - Global Output Gap |
| 29 - Corruption |
| 30 - Pension - Entitlement Crisis |
| 31 - Corporate Bankruptcies |
| 32- Finance & Insurance Balance Sheet Write-Offs |
| 33 - Resource Shortage |
| 34 - US Reserve Currency |
| 35- Government Backstop Insurance |
| 36 - US Dollar Weakness |
| 37 - Cyber Attack or Complexity Failure |
| 38 - Terrorist Event |
| 39 - Financial Crisis Programs Expiration |
| 40 - Natural Physical Disaster |
| 41 - Pandemic / Epidemic |
Reading the right books?
No Time?

We have analyzed & included
these in our latest research papers Macro videos!
![]()
OUR MACRO ANALYTIC
CO-HOSTS
John Rubino's Just Released Book
![]()
Charles Hugh Smith's Latest Books
![]()
![]()
Our Macro Watch Partner
Richard Duncan Latest Books
MACRO ANALYTIC
GUESTS
F William Engdahl
![]()
![]()

![]()
![]()

![]()
OTHERS OF NOTE
![]()
![]()
![]()


![]()
Book Review- Five Thumbs Up
for Steve Greenhut's
Plunder!
![]()
TODAY'S TIPPING POINTS
|
Scroll TWEETS for LATEST Analysis
Read More - OUR RESEARCH - Articles Below
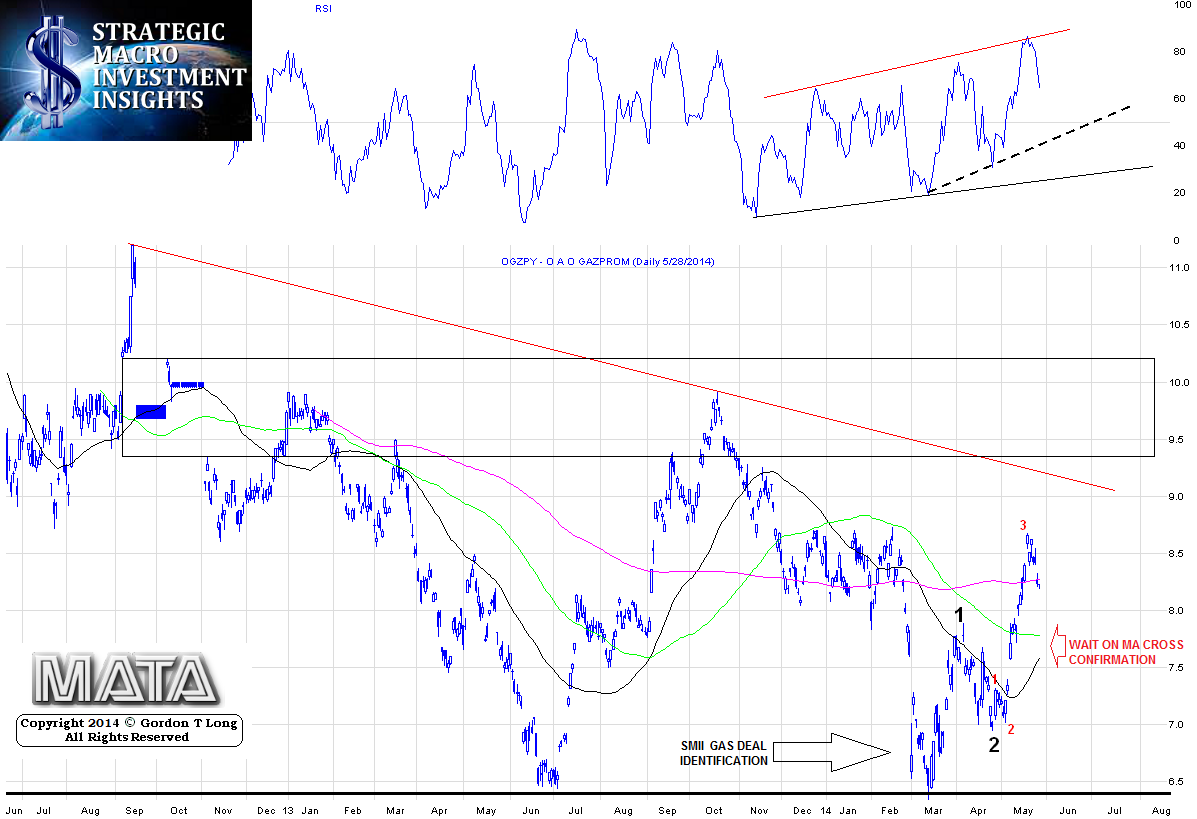
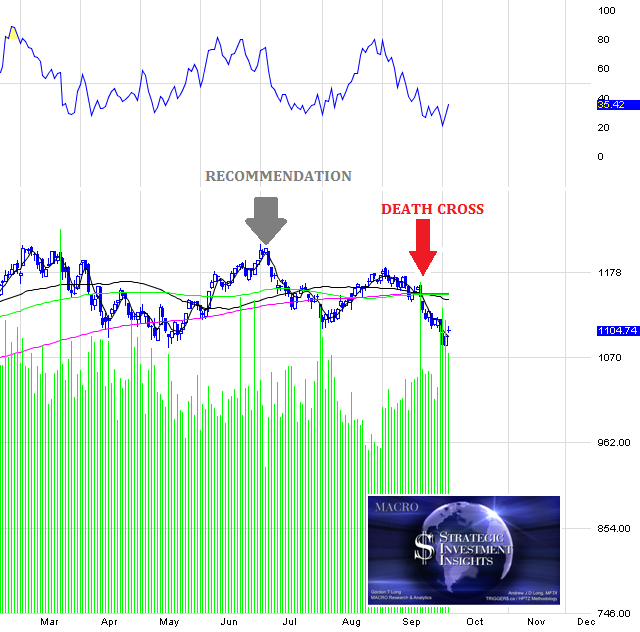
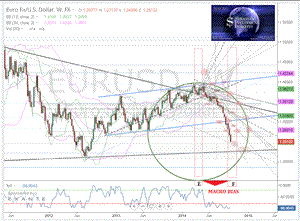
HOTTEST TIPPING POINTS |
Theme Groupings |
||||||||||||||||||||||||||||||||||||||||||||||||||||||||||||||||||||||||||||||
Investing in Macro Tipping Points
THESE ARE NOT RECOMMENDATIONS - THEY ARE MACRO COMMENTARY ONLY - Investments of any kind involve risk. Please read our complete risk disclaimer and terms of use below by clicking HERE |
|||||||||||||||||||||||||||||||||||||||||||||||||||||||||||||||||||||||||||||||
We post throughout the day as we do our Investment Research for: LONGWave - UnderTheLens - Macro |
|||||||||||||||||||||||||||||||||||||||||||||||||||||||||||||||||||||||||||||||
"BEST OF THE WEEK "
|
Posting Date |
Labels & Tags | TIPPING POINT or THEME / THESIS or INVESTMENT INSIGHT |
||||||||||||||||||||||||||||||||||||||||||||||||||||||||||||||||||||||||||||
|
MOST CRITICAL TIPPING POINT ARTICLES TODAY
|
|
||||||||||||||||||||||||||||||||||||||||||||||||||||||||||||||||||||||||||||||
RISK - Global Economy & Markets
IS CRITICAL SUPPORT THEREFORE ABOUT TO BE BROKEN? CLICK TO ENLARGE DOWNSIDE GREATER THAN UPSIDE
|
01-07-15 | PATTERNS | |||||||||||||||||||||||||||||||||||||||||||||||||||||||||||||||||||||||||||||
RISK - US Markets Cannot Remain Disconnected from Global Economy & Markets |
01-07-15 | PATTERNS | |||||||||||||||||||||||||||||||||||||||||||||||||||||||||||||||||||||||||||||
RISK - False Perceptions & Beliefs Always Preceed Market Corrections PRESENTLY HAVE COMPLETE FAITH THAT CENTRAL BANKS WILL KEEP MARKETS RISING (THOUGH LIQUDITY FLOWS ARE NOW FALLING)
|
01-07-15 | SENTIMENT | |||||||||||||||||||||||||||||||||||||||||||||||||||||||||||||||||||||||||||||
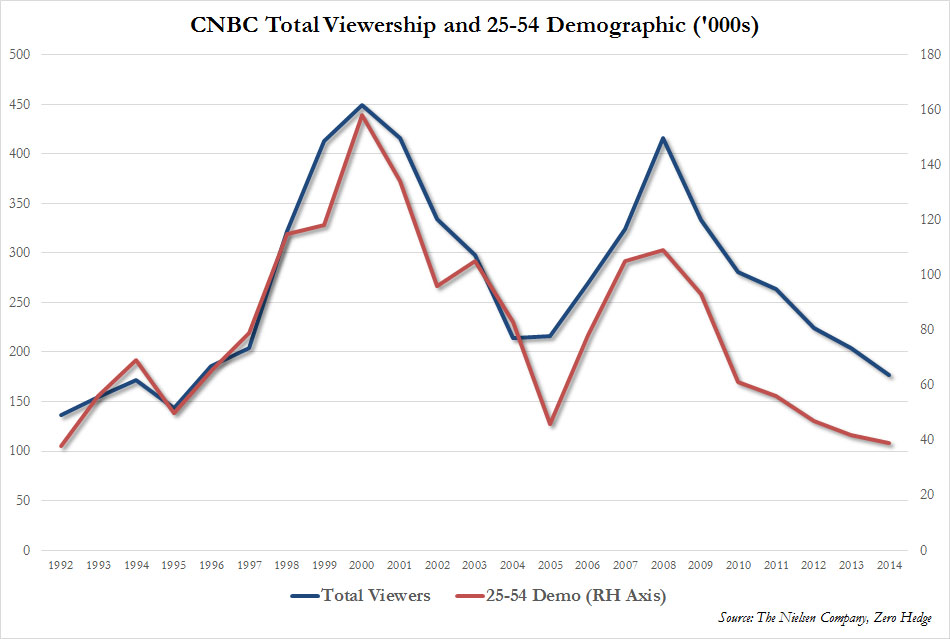
RISK -THE PUBLIC IS NOT INTERESTED IN THE MARKETS AS THEY ONCE WHERE If your job is to sit in front of a camera selling the notion of getting rich from investing, you’re not going to talk about bonds or currencies (maybe the latter is of interest but only with insane amounts of leverage which usually bankrupts a trader in his or her first trade). The mainstream financial media likes to focus on stocks because:
SOMETHING HOWEVER HAS CHANGED NIELSEN VIA ZH : Another year of putting lipstick on the zombie known as the global economy, kept walking only thanks to $11 trillion in liquidity injections by the world's central banks and tens of trillions of new Chinese credit created out of thin air and promptly misallocated and embezzled, and the results are in. The bottom line: according to Nielsen, is that despite the S&P recording a whopping 53 all time highs, and the Dow rising over 18,000, the channel that was once must watch financial TV for mom and pop, and has since devolved into endless cheerleading of failed policies and rigged markets, namely CNBC, just suffered its worst year in, well, ever. But don't worry: the "retail investor" who has now fully given up on the "market", will surely be back this year, and with it CNBC's ratings. In the meantime, here are the facts:
Program Highlights 2014
Finally, one wonders if without the Fed and other central banks, the real S&P500 wouldn't look like the chart of CNBC's Nielsen ratings... How ironic, then, that another market crash is precisely what CNBC needs to regain its audience before it slides into complete oblivion (by both viewers and advertisers). Source: Nielsen
|
01-07-15 | SENTIMENT | |||||||||||||||||||||||||||||||||||||||||||||||||||||||||||||||||||||||||||||
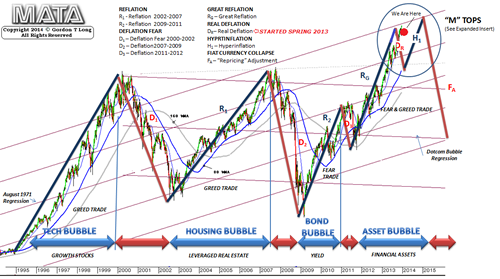
PATTERNS - Our "M TOP" POSITIONING OUR "M" TOP
|
01-07-15 | PATTERNS | |||||||||||||||||||||||||||||||||||||||||||||||||||||||||||||||||||||||||||||
| MOST CRITICAL TIPPING POINT ARTICLES THIS WEEK - Jan 4th ,2014 - Jan 10th, 2014 | |||||||||||||||||||||||||||||||||||||||||||||||||||||||||||||||||||||||||||||||
| TO TOP | |||||||||||||||||||||||||||||||||||||||||||||||||||||||||||||||||||||||||||||||
| MACRO News Items of Importance - This Week | |||||||||||||||||||||||||||||||||||||||||||||||||||||||||||||||||||||||||||||||
GLOBAL MACRO REPORTS & ANALYSIS |
|||||||||||||||||||||||||||||||||||||||||||||||||||||||||||||||||||||||||||||||
RISK - Dollar Danger The year of Dollar Danger for the world 01-01-15-Ambrose Evans-Pritchard, Telegraph We are entering a new financial order where there is no longer an automatic “Fed Put” or a “Politburo Put” to act as a safety net for asset markets US DOLLAR America’s closed economy can handle a:
Large parts of the world cannot. That in a nutshell is the story of 2015. Tightening by the US Federal Reserve will have turbo-charged effects on a global financial system addicted to zero rates and dollar liquidity. BRICS
CURRENCIES
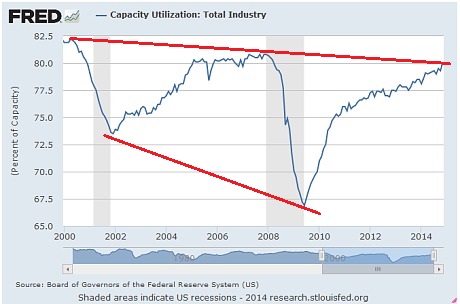
FEDERAL RESERVE POLICY The Yellen Fed will be forced to back down in the end, just as the Bernanke Fed had to retreat after planning a return to normal policy at the end of QE1 and QE2. For now the Fed is on the warpath, digesting figures showing US capacity use soaring to 80.1pc, and growth running at an 11-year high of 5pc in the third quarter.
CHINA The Fed pivot comes as China’s Xi Jinping is:
Uncle Xi will ultimately blink, but traders betting on a quick return to credit stimulus may lose their shirts first. Worse yet, when he blinks, a tool of choice may be to drive down the yuan to fight Japan’s devaluation, and to counter beggar-thy-neighbour dynamics across East Asia. This would export yet more Chinese deflation to the rest of the world. At best we are entering a new financial order where there is no longer an automatic “Fed Put” or a “Politburo Put” to act as a safety net for asset markets. That may be healthy in many ways, but it may also be a painful discovery for some. ENERGY SHOCK A sated China is as much to “blame” for the crash in oil prices as America’s shale industry. Together they have knouted Russia's Vladimir Putin. The bear market will short-circuit at Brent prices of $40, but not just because shale capitulates. Marginal producers in Canada, the North Sea, West Africa and the Arctic will share the punishment. The biggest loser will be Saudi Arabia, reaping the geostrategic whirlwind of its high stakes game, facing
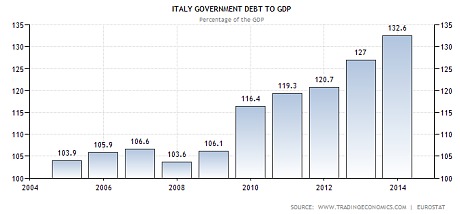
RUSSIA Mr Putin will achieve his objective of crippling Ukraine’s economy and freezing the conflict in the Donbass, but only by crippling Russia in the process. Controls will not stem capital flight. Mr Putin will have to choose been a dangerous loss of foreign reserves and a dangerous chain of corporate bankruptcies. He will continue to pawn Russia’s national interest to Beijing in order to save his Siloviki regime, but wiser heads in Moscow will question how a perpetual dispute with Europe and the revival of a dying NATO can possibly be in Russia’s interest. They will check his folly. EU The European Central Bank cannot save the day for asset markets as the Fed pulls back: It does not print dollars, and dollars are what now matter. Nor is it constitutionally able to act with panache in any case. While Mario Draghi and the Latin bloc could theoretically impose full-fledged QE against German resistance, such Frechheit would sap German political consent for the EMU project. Mr Draghi will accept a bad compromise: low-octane QE that makes no macro-economic difference, but noisy enough to provoke a storm. The eurozone will be in deflation by February, forlornly trying to ignite its damp wood by rubbing stones. Real interest rates will ratchet higher. The debt load will continue to rise at a faster pace than nominal GDP across Club Med. The region will sink deeper into a compound interest trap.
The political triggers for the next spasm of the EMU crisis are complex, yet trouble must come since the North-South gap is as wide as ever in key respects, and the depression drags on. The detonator may of course be Greece. If Syriza rebels hold their poll lead into the snap-election this month, a cathartic showdown with Brussels will occur in short order. The EU creditors may agree to debt forgiveness for Greece, but they might equally refuse to talk with a gun held to their heads. There is a 50/50 risk that they would instead switch off life-support and eject Greece, calculating that they now have the back-stop machinery to stop contagion. In this they would be wrong. EQUITY MARKETS Breaking my normal rule of discussing equity prices let me say only that the S&P 500 index of Wall Street stocks will not defy monetary gravity or the feedback loops of global stress for much longer. Half the earnings of US big-cap companies come from overseas, repatriated into a stronger dollar, and therefore worth less in reporting terms.
The index has risen at double-digit rates for three years, further inflated this year by
Expect a shake-out of 20pc comparable to the LTCM crisis in 1998 when the wheels came off in Russia and East Asia, though don’t be shocked by worse. Emerging markets are a much bigger part of the world economy today, and their combined debt ratio is a record 175pc of GDP. Once these hiccups are behind us, we can look forward to sunlit uplands as always. Happy New Year. |
01-05-15 | GLOBAL MACRO |
|||||||||||||||||||||||||||||||||||||||||||||||||||||||||||||||||||||||||||||
US ECONOMIC REPORTS & ANALYSIS |
|||||||||||||||||||||||||||||||||||||||||||||||||||||||||||||||||||||||||||||||
RISK - Fed is Allowing Adjusted Monetary Base to Fall A FALLING (Even Slowing) MONETARY BASE HAS NOT HISTORICALLY BEEN GOOD FOR STOCKS!
|
01-06-15 | US MONETARY | US ECONOMICS |
||||||||||||||||||||||||||||||||||||||||||||||||||||||||||||||||||||||||||||
| Market | |||||||||||||||||||||||||||||||||||||||||||||||||||||||||||||||||||||||||||||||
| TECHNICALS & MARKET |
|
||||||||||||||||||||||||||||||||||||||||||||||||||||||||||||||||||||||||||||||
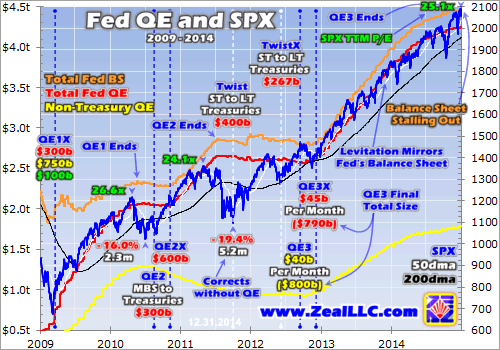
RISK -Has the Fed "Abandoned" the Stock Market? The seemingly-invincible US stock markets powered higher again last year, still directly fueled by the Fed’s epic quantitative-easing money printing. But 2015 is shaping up to be radically different from the past couple years. The Fed (seemingly) effectively abandoned the stock markets when it terminated its bond buying late last year. So this year we will finally see if these lofty stock markets can remain afloat without the Fed. Mainstream stock investors and speculators are certainly loving life these days. The flagship S&P 500 stock index enjoyed an excellent 2014, climbing 11.4%. And that followed 2013’s massive and amazing 29.6% blast higher! The last couple years were truly extraordinary and record-breaking on many fronts, with the US stock markets essentially doing nothing but rally to an endless streak of new nominal record highs. Such anomalously-one-sided stock markets naturally bred the extreme euphoria universally evident today. Greedy traders have totally forgotten the endlessly-cyclical nature of stock-market history, where bear markets always follow bulls. They’ve convinced themselves that these stock markets can keep on magically levitating indefinitely, that major selloffs of any magnitude are no longer a threat worth considering. FED DISTORTIONS But extrapolating that incredible upside action of 2013 and 2014 into the future is supremely irrational, because its driver has vanished. The past couple years’ mammoth stock-market rally was completely artificial, the product of central-bank market manipulation. The Federal Reserve not only created vast sums of new money out of thin air to monetize bonds, but it aggressively jawboned the stock markets higher. Virtually every time the Fed made a decision, or its high officials opened their mouths, the implication was being made that it wouldn’t tolerate any material stock-market selloff. The Fed kept saying that it was ready to ramp up quantitative easing if necessary. Stock traders understood this exactly the way the Fed intended, assuming the American central bank was effectively backstopping the US stock markets! This short-circuited the normal and healthy way stock markets operate, cyclically. In normal times when stock traders grow too greedy and bid stocks up too high too fast, corrections periodically arrive. They drag overextended stocks back down, kindling fear and restoring critical sentiment balance. But with the Fed convincing stock traders it was ready to arrest any significant selling, they naturally lost all fear. With the Fed printing money with reckless abandon, every minor stock-market dip was quickly bought. But with no significant selloffs to rebalance sentiment, greed flourished out of control. That eventually forced the stock markets to today’s immensely overextended and overvalued levels, which stock-market history shows are exceedingly dangerous. The Fed distortion in these markets is extreme beyond belief. And it has to end badly. The material selloffs in ongoing bull markets that the Fed foolishly chose to suppress keep sentiment balanced. They prevent greed from growing so extreme that it sucks in too much near-future buying. If euphoria pulls enough buying forward, there aren’t enough new buyers left to continue propelling the bull higher so it collapses under its own weight. We’re reaching that point. Wildfires are a fantastic analogy. The longer a forest grows without suffering any significant fires to clear out flammable underbrush, the greater the conflagration when some wildfire inevitably erupts. Fire-suppression efforts, however noble, simply ensure the wildfire fuel sources will balloon to dangerous proportions. Stock markets are like the forest, and periodic corrections are like smaller fires that burn away fuel. By aggressively inflating its balance sheet through money printing, the Fed artificially suppressed all the normal healthy stock-market selloffs that should have rebalanced sentiment. But back in late October, it ended its latest QE3 bond-monetizing campaign. And with this new year ushering in a new Congress dominated by anti-Fed Republicans, it is politically impossible for the Fed to launch any kind of QE4. So the Fed’s wildly-unprecedented balance-sheet growth of recent years is over. 2015 will actually be the first year since 2007 without any quantitative easing! And as this stacked chart of the Fed’s balance sheet shows, a year without monetizing bonds is going to be a big shock to stock traders. Orange is the total balance sheet, red is monetized US Treasuries, and yellow shows the Fed’s mortgage-backed securities. Today’s stock-market mess began with 2008’s epic once-in-a-century stock panic. In its dark heart that October, the benchmark S&P 500 stock index (SPX) plummeted a sickening 30.0% in a single month! The Fed, fully realizing stock-market levels exert a huge influence over national economic activity, panicked. It slashed interest rates to zero in December 2008, and started printing money hand over fist to buy bonds. In the first 8 months of 2008 before that stock panic, the Fed’s balance sheet averaged $875b. But by the end of 2008, it had skyrocketed 154% higher to $2218b. Once it put its foot on the money-printing pedal, the Fed was terrified of letting off. So it converted its temporary QE buying during the stock panic to quasi-permanent holdings of US Treasuries and MBS bonds. This helped its balance sheet keep on ballooning. QE1’s debt monetizations were born, and soon expanded. After its pre-announced buying fully ran its course, the Fed followed the same pattern in QE2 and the so-called Operation Twist. That campaign shifted Fed capital from short-term Treasuries to longer-term ones in an attempt to manipulate interest rates lower. And finally QE3 came along, which proved far different from those other QE campaigns before it. QE1, QE2, and Twist, despite their expansions, all had pre-announced levels of Fed money printing and debt monetization. But QE3 didn’t. QE3 was totally open-ended, which was wildly unprecedented. With no pre-determined limit, the psychological impact of QE3 on stock traders was vastly greater. The Fed kept implying it was ready to expand QE3 anytime if stock markets needed help, and traders believed it. The cyclical stock bull following the preceding cyclical bear climaxing in 2008’s stock panic was totally righteous before QE3 came along in late 2012. Between the March 2009 cyclical-bear bottom and early September 2012 before the Fed announced QE3, the SPX powered 112.5% higher over 42 months. This was right in line with average mid-secular-bear cyclical-bull precedent of a doubling in 35 months. The Fed’s balance sheet was flat in 2009 as it shifted temporary stock-panic QE into enormous MBS and Treasury purchases. The SPX rallied 23.5% higher that year, which is totally expected after a panic-grade selloff. Then in 2010 when the Fed birthed QE2 which initially just converted MBS holdings into Treasuries, its balance sheet grew 9%. And the SPX’s strong gains tapered off to a more normal 12.8%. But in late 2010, QE2 was effectively tripled to include massive new Treasury buying. And most of that happened the following year, which led the Fed’s balance sheet to balloon by 21% in 2011. Yet despite that, the SPX was dead flat and looking increasingly toppy in early 2012. So in September that year, the Fed birthed the unprecedented open-ended QE3. This was subsequently more than doubled shortly later in December. Since QE3 didn’t ramp up to full speed until early 2013, the Fed’s balance sheet was flat in 2012. Yet the SPX was still able to muster a 13.4% gain on a still-normal-yet-maturing cyclical bull market. Up until about SPX 1500 in early 2013, the stock-market gains from the early-2009 bear-market lows were totally righteous. The Fed’s extreme QE3 distortions began to manifest in early 2013, and have greatly worsened since. 2013 was the only full year of QE3, and it witnessed incredible monetary inflation as you can see in the chart above. That year the Fed’s balance sheet rocketed up by a staggering 38%! That was its biggest percentage increase by far since that 2008 stock-panic year. And in absolute terms, 2013’s $1107b of Fed balance-sheet expansion nearly rivals 2008’s crisis $1345b! 2013 was an exceedingly-anomalous year. That gargantuan money printing, and the associated Fed jawboning about backstopping stock markets, catapulted the SPX 29.6% higher in 2013! The correlation between the soaring stock markets and the soaring Fed balance sheet was nearly perfect, as the next chart below reveals. The vast sums of money the Fed was creating out of thin air to monetize debt were effectively finding their way into the stock markets! The Fed started to wind down QE3’s new buying in 2014, which reduced its balance-sheet growth to a 12% pace. But starting from such supremely-inflated levels, that was still another $486b of new money conjured from nothing! And there’s no doubt 2014’s still-massive monetary expansion was the primary driver of last year’s strong 11.4% SPX up year. The Fed goosed the stock markets in 2013 and 2014. But even this hyper-dovish Keynesian Fed gradually realized it can’t print hundreds of billions of new dollars a year forever and not trigger massive and serious inflation. So it finally shut down QE3’s new buying in recent months, although it still plans to roll over money from maturing bonds. In the relatively-short 6.3-year span between late 2008 and today, the Fed has more than quintupled its balance sheet to $4472b! To put that into perspective, the Fed started publishing its balance-sheet total in November 1990. In the 17.8 years between then and the dawn of late 2008’s stock panic, the Fed’s balance sheet merely grew by 3.1x. Compare that to the 5.1x in the QE era since then which is only just over a third as long! There has never been a remotely comparable extreme period of new money created in the Fed’s entire 101-year history. And while all that inflation didn’t filter down to normal Americans and catapult general price levels higher, yet at least, it did deluge into the US stock markets. This next chart is incredibly damning, and reveals the terrible problem the stock markets face in 2015. When the SPX is overlaid on top of the Fed’s balance sheet, the correlation is incredibly high. Without more Fed inflation, these stock markets are in serious trouble.
Even though the cyclical stock bull between early 2009 and late 2012 was righteous, the powerful SPX advance still mirrored the Fed’s balance sheet remarkably well. When the Fed was printing money to buy Treasuries, ramping up its total holdings, the SPX surged higher. But whenever the Fed’s balance sheet merely stalled out, first between QE1 and QE2 and later between QE2 and Twist, the SPX corrected hard. Provocatively the only two full-blown corrections, 10%+ selloffs, of this entire cyclical bull happened when the Fed’s balance sheet stopped growing in mid-2010 and mid-2011. The SPX corrected 16.0% in 2.3 months in the first one, and 19.4% in 5.2 months in the second. Those are enormous selloffs by the standards of the past couple years, when the Fed’s extraordinary QE3 stock-market levitation was in force. Since the Fed birthed QE3 in late 2012 right before that year’s critical US elections, there have been no correction-magnitude selloffs. The extremely-greedy popular sentiment fomented by the Fed has never been rebalanced away, like tinder-dry undergrowth in a forest. The biggest pullback of the past couple years’ Fed-driven levitation is merely 7.4% climaxing in October 2014, which was far too small to do any real good. In normal healthy bull markets, correction-magnitude selloffs erupt about once a year or so on average. As of the latest SPX nominal record high this week, it has been an astounding 39 months since the end of the last correction! The Fed’s implied backstop for the stock markets through QE3 is solely to blame for this extreme anomaly. Such a long sans-correction span in such lofty euphoric markets is a recipe for disaster. If the Fed hadn’t effectively suppressed any stock-market selloff serious enough to bleed away greed and kindle some real fear, things would look far different today. The stock markets would be nowhere near as high, and today’s universal euphoria would be far less extreme. Like those wildfires, the longer that correction-magnitude selloffs are suppressed, the bigger and meaner the inevitable rebalancing one will be. The already-mature stock-market cyclical bull was in the process of topping in 2012 before the Fed chose to goose the stock markets with its unprecedented open-ended QE3. Ever since then, the SPX’s advance has been super-highly-correlated with the Fed’s balance sheet. A nearly-ironclad argument can be made that everything since 1500 in the SPX in early 2013 was nothing but Fed-blown hot air. Stock-market valuations reveal that the great majority of the past couple years’ extraordinary SPX rally was the result of multiple expansion, not higher earnings. Stocks were not bid higher because their underlying corporations were earning larger profits relative to their share prices, but due to the Fed’s strong psychological incentives to buy high in a surreal correction-less market. Those have now vanished. While the Fed announced the end of QE3 in late October, its balance sheet has still grown gradually since. The fact the stock markets haven’t corrected yet has led many bulls to believe the end of QE3 is no threat to the euphoric stock markets. But history certainly doesn’t support that cavalier dismissal of the post-QE3 risks. The last stock-market corrections in 2010 and 2011 erupted when the balance sheet started retreating. That’s on the verge of happening again today for the first time since 2012, before the QE3 levitation. Although the Fed has pledged to keep rolling over QE-purchased bonds into new ones as they mature, there is bound to be some modest balance-sheet shrinkage for technical reasons. And it will be very interesting to see if the stock markets can continue rallying when that happens, as history argues they likely can’t. Without QE or even the prospect of QE in 2015, the Fed’s implied backstop for the US stock markets no longer exists. Sooner or later some selling catalyst will arrive, probably out of Europe like back in 2010 and 2011. And as investors and speculators start to exit stocks, that selling will cascade as there will be insufficient quick buy-the-dip capital inflows with the Fed no longer actively convincing traders to flood back in. And the Fed abandoning the stock markets in 2015 with QE’s new buying gone is only part of the big Fed-driven risks these lofty overvalued stock markets now face. Sooner or later the bond markets are going to force the Fed’s hand in hiking interest rates from zero, where they’ve remained continuously since those temporary crisis levels were imposed in late 2008. Rising rates are super-risky for expensive stock markets. And make no mistake, the SPX is very expensive today with
Today’s very expensive valuation multiples are the result of both the Fed’s QE3 stock-market levitation and manipulated artificially-low interest rates. Rate hikes will change everything. As rates rise, overvalued stocks are hammered on multiple fronts. Rising rates make bonds relatively more attractive, so conservative investors sell overpriced stocks to return to bonds. And rising rates also directly hit profits, making stocks look even more expensive. They increase borrowing costs at the same time they retard sales as companies’ customers are forced to cut back on their own spending. So stocks get hit hard. Thanks to the Fed, the SPX’s cyclical bull has soared an astonishing 209.0% higher over 5.8 years, far beyond historical averages. This propelled the stock markets to their highest nominal levels since their last secular bull peaked in early 2000. And couple that with stocks priced near 25x earnings, not far from the 28x historical bubble level, and rising rates along with a shrinking Fed balance sheet is a huge problem. The last time the Fed raised its main federal-funds rate was way back in June 2006. So 2015 will be the first time in about 9 years that the stock markets have had to deal with rate hikes, right at the time they are the highest and most vulnerable. The smart bet to make in such a scenario is certainly the contrarian one, that
.. are going to lead to major stock selling this year. The euphoric bulls won’t even entertain that possibility, another topping indicator. They claim QE was a wild success and now the US stock markets can keep on powering higher indefinitely without the Fed. But there’s a fatal flaw in this argument, QE and the associated zero-interest-rate policy remain far from over. No one knows the true impact of QE until the Fed has fully normalized its balance sheet and interest rates! Until QE is totally unwound, which means the Fed’s balance sheet returns to that $875b level where it was before 2008’s stock panic, QE isn’t over. And even though uber-dove Janet Yellen has promised never to return to those levels, the Fed’s balance sheet still has to shrink dramatically from today’s crazy extremes. And the normalization on the interest-rate front is every bit as extreme and dangerous for stock markets. In the quarter-century between the early 1980s rate spike and 2008’s stock panic, the federal-funds rate averaged 5.3%! So interest rates aren’t normalized in the post-ZIRP era until they return to such high levels by recent standards. Traders have no idea if these Fed-inflated stock markets can stand on their own feet until the Fed’s balance sheet shrinks back to $875b and the Fed’s key federal-funds rate soars over 5%! So prudent investors and speculators need to be exceedingly careful in 2015. The extreme stock-market rally of the last couple years was the product of Fed manipulation, and those gale-force tailwinds are now reversing into howling headwinds for the stock markets. Without the Fed’s implied backstop that was such a powerful psychological motivator for traders in recent years, 2015 is going to prove a far-different ballgame. The bottom line is the Fed has abandoned the stock markets. The powerful rallies of 2013 and 2014 were driven by extreme Fed money printing to buy up bonds. But with QE3’s new buying terminated and any QE4 a political impossibility with the new Republican Congress, 2015 is going to look vastly different. A shrinking Fed balance sheet sparked major corrections even from far lower and cheaper stock levels. With the Fed’s balance sheet and zeroed interest rates finally starting to normalize in 2015, the lofty and overvalued Fed-levitated stock markets are in for some tough sledding. The implied backstop that enticed and forced so many traders to over-deploy in the stock markets in recent years has vanished. And the serious gravity of the Fed’s absence will become readily apparent once the next selloff starts cascading. |
01-05-15 | GLOBAL MACRO |
|||||||||||||||||||||||||||||||||||||||||||||||||||||||||||||||||||||||||||||
| COMMODITY CORNER - HARD ASSETS | PORTFOLIO | ||||||||||||||||||||||||||||||||||||||||||||||||||||||||||||||||||||||||||||||
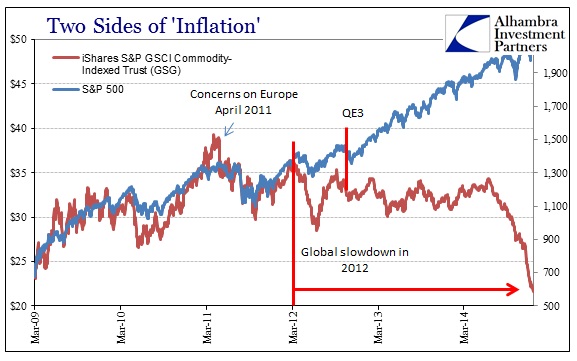
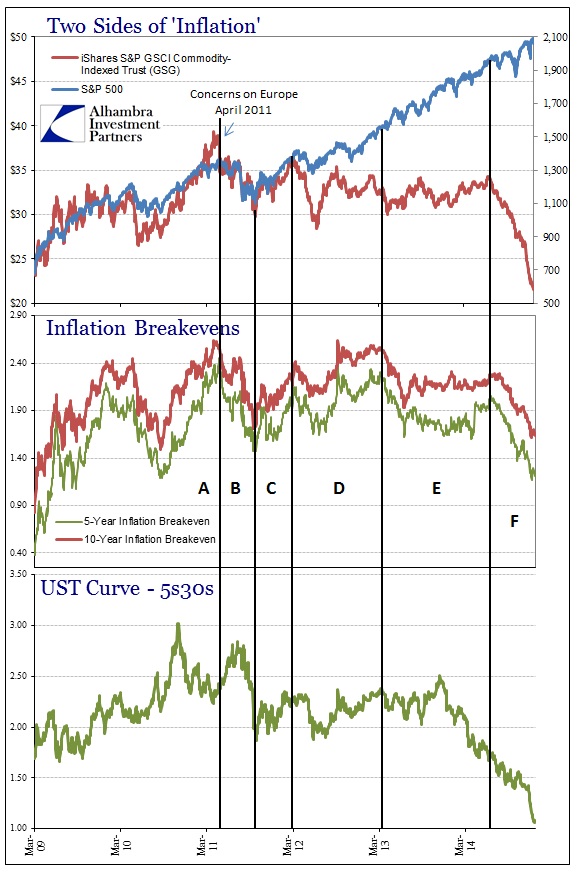
RISK - Commodities, Inflation Breakevens and Yield Curve Sending Clear Warnings Only Stocks Are Left Minding The 'Recovery' 01-03-15 Submitted by Jeffrey Snider via Alhambra Investment Partners, If I had to define the recovery period that developed after the trough in the Great Recession, it would have ended sometime in the middle of 2011. Up to that point, there was almost a uniform behavior in financial and even economic accounts (though, on the economic side, there was much left to be desired). It was by no means uneventful, as you would like in recoveries, but that was as much a systemic and structural problem as anything to do with cycle. That ragged end, as new doubts essentially replaced widespread hope, remains with us in a series of divergences that are only now closing (in the wrong direction). Given the central task of every central bank, subscribed to themselves, is essentially “inflation” that is a good place to start.
INFLATION - About SUPPLY & FLOW of Money & Credit
Commodity prices and stocks were very much aligned coming out of the depths of panic, even through the major bumps in 2010 (including the flash crash and onset of Greece). The more serious outbreak of uncertainty and fear in 2011 was unable to dislodge the correlation, as both commodity prices and stocks gyrated, but at the same times and in the same directions both up and down. It wasn’t until early 2012 that any sustained divergence appeared. Whether this durable rift occurred early on in the year or later around QE3’s introduction is really irrelevant, only that the significant events of that year were these differing tacks in “inflation” while the global economy, including the US, dropped off the prior recovery path. COMMODITIES ANCHORED BY "DEMAND"
EQUITIES USED TO BE ANCHORED BY EARNINGS & EARNINGS GROWTH (Relative to Sales Growth)
If we add additional financial measures to the mix, these inflections start to line up with the historical record of significant events. Through periods A, B & C in the chart above, all the “market” indications are in agreement.
But that was essentially the frailty by which this divergence between stock “inflation” and commodity “inflation” was created. Period C was replete with massive intervention, including significant action at the ECB, BoJ and even the Fed ($ swaps) that, as we see very clearly now, had little to no effect on the real economy.
Somewhere in Period B or C, the recovery ended as it was shattered by the global slowdown of Period D; in other words the promise of monetarism acted out in “emergency” and “unconventional” policies was never delivered. Ever since, each of these financial markets, indicated by almost any credit market rate or factor, have come to terms with that as reality except stocks. Periods A-C were unbreakable belief in central bank efficacy, which was severely diminished by 2011’s near-panic rerun and the slowdown that followed. This latest period is perhaps the final undoing of all of that, made so by the 2012 global slowdown that has been impenetrable to monetarism in any form in every location.
Either stocks have permanently decoupled, continuing exclusively within the realm of central bank omniscience that has been rebuked time and again, or there will be a:
|
01-05-15 | GLOBAL MACRO |
|||||||||||||||||||||||||||||||||||||||||||||||||||||||||||||||||||||||||||||
| THEMES | |||||||||||||||||||||||||||||||||||||||||||||||||||||||||||||||||||||||||||||||
| TO TOP | |||||||||||||||||||||||||||||||||||||||||||||||||||||||||||||||||||||||||||||||


Tipping Points Life Cycle - Explained
Click on image to enlarge
TO TOP
 |
YOUR SOURCE FOR THE LATEST THINKING & RESEARCH
|
�
TO TOP