|
JOHN RUBINO'SLATEST BOOK |
||||||||||||||||||||||||||||||||||||||||||||||||||||||||||||||||||||||||||||||||||||||||||||||||||||||||||||||||||||||||||||||||||||||||||||||||||||||||||||||||||||||||||||||||||||||||||||||||||||||||||||||||||||||||||||||||||||||||||||||||||||||||||||||||||||||||||||||||||||||||||||||||||||||||||||||||||||||
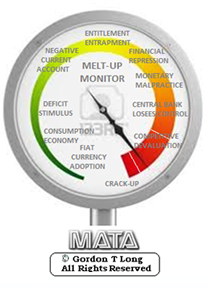
"MELT-UP MONITOR "
Meltup Monitor: FLOWS - The Currency Cartel Carry Cycle - 09 Dec 2013 Meltup Monitor: FLOWS - Liquidity, Credit & Debt - 04 Dec 2013 Meltup Monitor: Euro Pressure Going Critical - 28- Nov 2013 Meltup Monitor: A Regression-to-the-Exponential Mean Required - 25 Nov 2013
|

![]()
"DOW 20,000 "
Lance Roberts Charles Hugh Smith John Rubino Bert Dohman & Ty Andros
|
HELD OVER
Currency Wars
Euro Experiment
Sultans of Swap
Extend & Pretend
Preserve & Protect
Innovation
Showings Below
"Currency Wars "
|

"SULTANS OF SWAP" archives open ACT II ACT III
ALSO Sultans of Swap: Fearing the Gearing! Sultans of Swap: BP Potentially More Devistating than Lehman! |
"EURO EXPERIMENT"
archives open EURO EXPERIMENT : ECB's LTRO Won't Stop Collateral Contagion!
EURO EXPERIMENT: |
![]()
"INNOVATION"
archives open |

"PRESERVE & PROTE CT"
archives open |

Thurs. Apr. 7th , 2016
Follow Our Updates
on TWITTER
https://twitter.com/GordonTLong
AND FOR EVEN MORE TWITTER COVERAGE
![]()
| APRIL | ||||||
| S | M | T | W | T | F | S |
| 1 | 2 | |||||
| 3 | 4 | 5 | 6 | 7 | 8 | 9 |
| 10 | 11 | 12 | 13 | 14 | 15 | 16 |
| 17 | 18 | 19 | 20 | 21 | 22 | 23 |
| 24 | 25 | 26 | 27 | 28 | 29 | 30 |
KEY TO TIPPING POINTS |
| 1- Bond Bubble |
| 2 - Risk Reversal |
| 3 - Geo-Political Event |
| 4 - China Hard Landing |
| 5 - Japan Debt Deflation Spiral |
| 6- EU Banking Crisis |
| 7- Sovereign Debt Crisis |
| 8 - Shrinking Revenue Growth Rate |
| 9 - Chronic Unemployment |
| 10 - US Stock Market Valuations |
| 11 - Global Governance Failure |
| 12 - Chronic Global Fiscal ImBalances |
| 13 - Growing Social Unrest |
| 14 - Residential Real Estate - Phase II |
| 15 - Commercial Real Estate |
| 16 - Credit Contraction II |
| 17- State & Local Government |
| 18 - Slowing Retail & Consumer Sales |
| 19 - US Reserve Currency |
| NEW - Stagflation - Slow Growth & Personal Inflation |
| 20 - US Dollar |
| 21 - Financial Crisis Programs Expiration |
| 22 - US Banking Crisis II |
| 23 - China - Japan Regional Conflict |
| 24 - Poorly Regulated Corruption |
| 25 - Public Sentiment & Confidence |
| 26 - Food Price Pressures |
| 27 - Global Output Gap |
| 28 - Pension - Entitlement Crisis |
| 29 - Central & Eastern Europe |
| 30 - Terrorist Event |
| 31 - Pandemic / Epidemic |
| 32 - Rising Inflation Pressures & Interest Pressures |
| 33 - Resource Shortage |
| 34 - Cyber Attack or Complexity Failure |
| 35 - Corporate Bankruptcies |
| 36 - Iran Nuclear Threat |
| 37- Finance & Insurance Balance Sheet Write-Offs |
| 38- Government Backstop Insurance |
| 39 - Oil Price Pressures |
| 40 - Natural Physical Disaster |
Reading the right books?
No Time?

We have analyzed & included
these in our latest research papers Macro videos!
![]()
OUR MACRO ANALYTIC
CO-HOSTS
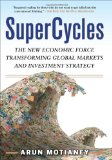
John Rubino's Just Released Book
![]()
Charles Hugh Smith's Latest Books
![]()
![]()
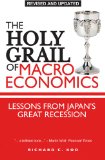
Our Macro Watch Partner
Richard Duncan Latest Books
MACRO ANALYTIC
GUESTS
F William Engdahl

![]()
![]()

![]()
![]()

![]()
OTHERS OF NOTE
![]()
![]()

![]()


![]()
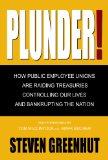
Book Review- Five Thumbs Up
for Steve Greenhut's
Plunder!
![]()
|
HOTTEST TIPPING POINTS |
Theme Groupings |
||
We post throughout the day as we do our Investment Research for: LONGWave - UnderTheLens - Macro
|
|||
"BEST OF THE WEEK " MOST CRITICAL TIPPING POINT ARTICLES TODAY
|
|
||
7- Sovereign Debt Crisis |
04-0716 | 7- Sovereign Debt Crisis |
|
Why "The Fed Can't Save Us":The Simple Explanation From Austrian Business Cycle TheoryBy Robert P. Murphy of Mises Institute The Fed Can't Save Us In December, the Fed hiked its target for the federal funds rate, which is the interest rate banks charge each other for overnight loans of reserves. Since 2008 the Fed’s target for the Fed Funds Rate had been a range of 0 percent – 0.25 percent (or what is referred to as zero to 25 “basis points”). But last month they moved that target range up to 0.25 – 0.50 percent. Ending a seven-year period of effectively zero percent interest rates. From our vantage point, we already see carnage in the financial markets, with the worst opening week in US history. This of course lines up neatly with standard Austrian business cycle theory, which says that the central bank can give an appearance of prosperity for a while with cheap credit, but that this only sets the economy up for a crash once rates begin rising. However, there is something new in the present cycle. The Fed is trying to raise rates while simultaneously maintaining its bloated balance sheet. It is attempting to pull off a magic trick whereby it can keep all of the “benefits” of its earlier rounds of monetary expansion (i.e., “quantitative easing” or “QE”) while removing the artificial stimulus of ultra-low interest rates. As we’ll see, this attempt will not end well, for the Fed officials or for the rest of us. In the meantime, Ben Bernanke will look on with concern, writing the occasional blog post and perhaps giving a speech about poor Janet Yellen’s tough predicament. Austrian Business Cycle Theory One of the seminal contributions of Ludwig von Mises was what he called the circulation credit theory of the trade cycle. In our times, we simply call it Austrian business cycle theory, sometimes abbreviated as ABCT. The Misesian theory was subsequently elaborated by Friedrich Hayek, and it was partly for this work that Hayek won the Nobel Prize in 1974. In the Mises/Hayek view, interest rates are market prices that perform a definite social function. They communicate vital information about consumer preferences regarding the timing of consumption. Entrepreneurs must decide which projects to start, and they can be of varying length. Intuitively, a high interest rate is a signal that consumers are “impatient,” meaning that entrepreneurs should not tie resources up in long projects unless there are large gains to be had in output from the delay. On the other hand, a low interest rate reduces the penalty on longer investments, and thus acts as a green light to tie capital up in lengthy projects. So long as the interest rate is set by genuine market forces, it gives the correct guidance to entrepreneurs. If consumers are willing to defer immediate gratification, they save large amounts of their income, and this pushes down interest rates. The high savings frees up real resources from current consumption — things like restaurants and movie theaters — and allows more factories and oil wells to be developed. However, if the interest rate drops not because of genuine saving, but instead because the central bank electronically buys assets with money created “out of thin air,” then entrepreneurs are given a false signal. They go ahead and take out loans at the artificially cheap rate, but now society embarks on an unsustainable trajectory. It is physically impossible for all of the entrepreneurs to complete the long-term projects they begin. In the beginning, the unsustainable expansion appears prosperous. Every industry is growing, trying to bid away workers and other resources from each other. Wages and commodity prices shoot up; unemployment and spare capacity drop. The economy is humming, and the citizens are happy. Yet it all must come crashing down. In a typical cycle, price inflation eventually rises to the level that the banks become nervous. They halt their credit expansion, allowing interest rates to start rising to a more correct level. The tightening in the credit markets causes pain initially for the most leveraged operations, but gradually more and more businesses are in trouble. A wave of layoffs ensues, with large numbers of entrepreneurs suddenly realizing they were too ambitious. The painful “bust,” or recession, sets in. This Time Is Different (Sort of) Since the financial crisis of 2008, the stock market’s surges have coincided with rounds of QE, and the market has faltered whenever the expansion came to a temporary halt. The sharp sell-off in August 2015 occurred when investors thought the first rate hike was imminent (it had been scheduled for September 2015). That particular hike was postponed, but after it went into effect in December, we soon saw the market tank to 2014 levels. As we would expect in times of Fed tightening, the official monetary base has fallen sharply in recent months, but this doesn’t mean that the Fed is selling off assets (as it would in a textbook tightening cycle). Indeed the Fed’s assets have been constant since the end of the so-called taper in late 2014. This is unusual since the monetary base and the Fed’s total assets typically move in tandem. Yet since late 2014, there have been three major drops in the monetary base that occurred while the Fed was dutifully rolling over its holdings of mortgage-backed securities and Treasuries, keeping its total assets at a steady level. The explanation is that the Fed has been testing out new techniques to temporarily suck reserves out of the banking system, while not reducing its total asset holdings. Meanwhile, the Fed in December bumped up the interest rate that it pays to commercial banks for keeping their reserves parked at the Fed. I like to describe this policy as the Fed paying banks to not make loans to their customers. What Does It All Mean? So why is the Fed trying to tighten the money supply without selling off assets as it has done in the past? It boils down to this: In order to bail out the commercial and investment banks — at least the ones who were in good standing with DC officials —as well as greasing the wheels for the federal government to run trillion-dollar deficits, the Federal Reserve in late 2008 began buying trillions of dollars worth of Treasury debt and mortgage-backed securities (MBS). This flooded the banking system with trillions of dollars of reserves, and went hand in hand with a collapse of short-term interest rates to basically zero percent. Now, the Fed wants to begin raising rates (albeit modestly), but it doesn’t want to sell off its Treasury or MBS holdings, for fear that this would cause a spike in Uncle Sam’s borrowing costs and/or crash the housing sector. So the Fed has increased the amount that it is paying commercial banks to keep their reserves with the Fed (rather than lending them out to customers), and — for those institutions that are not legally eligible for such a policy — the Fed is effectively paying to borrow the reserves itself. By adjusting the interest rate the Fed pays on such transactions, the Fed can move the floor on all interest rates up. No institution would lend to a private sector party at less than it can get from the Fed, since the Fed can create dollars at will and is thus the safest place to park or lend reserves. We thus have the worst of both worlds. We still get the economic effects of “tighter monetary policy,” because the price of credit is rising as it would in a normal Fed tightening. Yet we don’t get the benefit of a smaller Fed footprint and a return of assets to the private sector. Instead, the US taxpayer is ultimately paying subsidies to lending institutions to induce them to charge more for loans, while the big banks and Treasury still benefit from the effective bailout they’ve been getting for years. It Can’t Last Will the Fed be able to keep the game going? In a word, no. We’ve already seen that even the tiniest of interest rate hikes has gone hand in hand with a huge drop in the markets. Furthermore, the Fed’s subsidies to the banks are now on the order of $11 billion annually, but if they want to raise the fed funds rate to, say, 2 percent, then the annual payment would swell to more than $40 billion. That is “real money” in the sense that the Fed’s excess earnings would otherwise be remitted to the Treasury. Therefore, for a given level of federal spending and tax receipts, increased payments to the bankers implies an increased federal budget deficit. Janet Yellen and her colleagues are stuck with a giant asset bubble that her predecessor inflated. If they begin another round of asset purchases, they might postpone the crash, but only by making the subsequent reckoning that much more painful. You don’t make the country richer by printing money out of thin air, especially when you then give it to the government and Wall Street. The Fed’s magic trick of raising interest rates without selling assets can’t evade that basic reality. |
|||
TIPPING POINTS, STUDIES, THESIS, THEMES & SII COVERAGE THIS WEEK PREVIOUSLY POSTED - (BELOW) |
|||
| MOST CRITICAL TIPPING POINT ARTICLES THIS WEEK - Apr 3rd, 2016 to April 9th, 2016 | |||
| TIPPING POINTS - This Week - Normally a Tuesday Focus | |||
| BOND BUBBLE | 1 | ||
| RISK REVERSAL - WOULD BE MARKED BY: Slowing Momentum, Weakening Earnings, Falling Estimates | 2 | ||
| GEO-POLITICAL EVENT | 3 | ||
| CHINA BUBBLE | 4 | ||
| JAPAN - DEBT DEFLATION | 5 | ||
EU BANKING CRISIS |
6 |
||
NEW - Stagflation - Slow Growth & Personal Inflation |
04-05-16 | NEW - Stagflation - Slow Growth & Personal Inflation |
|
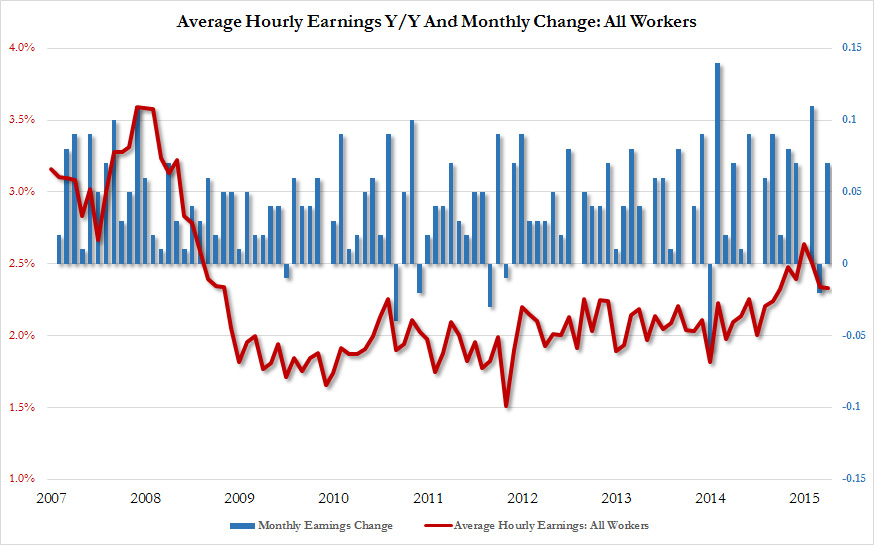
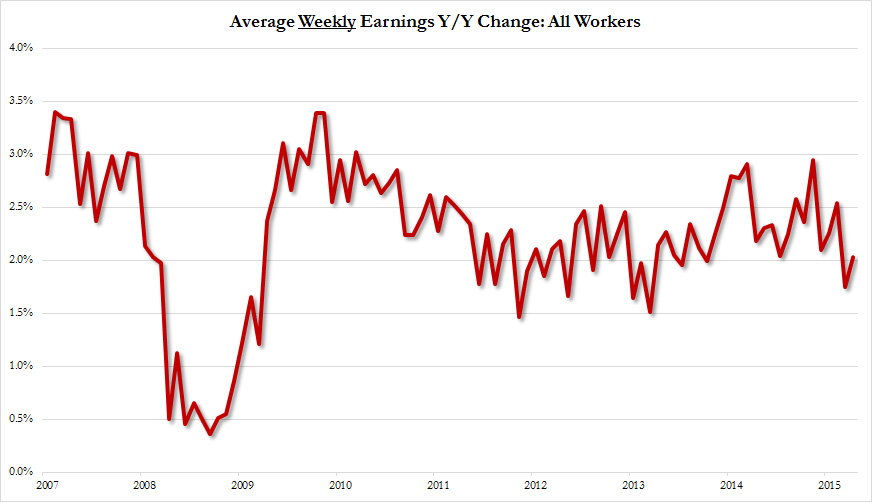
The Next Big Problem:"Stagflation Is Starting To ShowAcross The Economy"In the past few months, the Bureau of Labor Statistics has gone out of its way to show that U.S. worker compensation is finally rising. There is one problem with that: while that may be true on an hourly basis...
... on a weekly basis, the picture is vastly different. What is happening is that weekly wage growth have gone nowhere in years, but because the average hours worked per week has declined and today hit a 2 year low of 34.4, it translates into more money per hour worked.
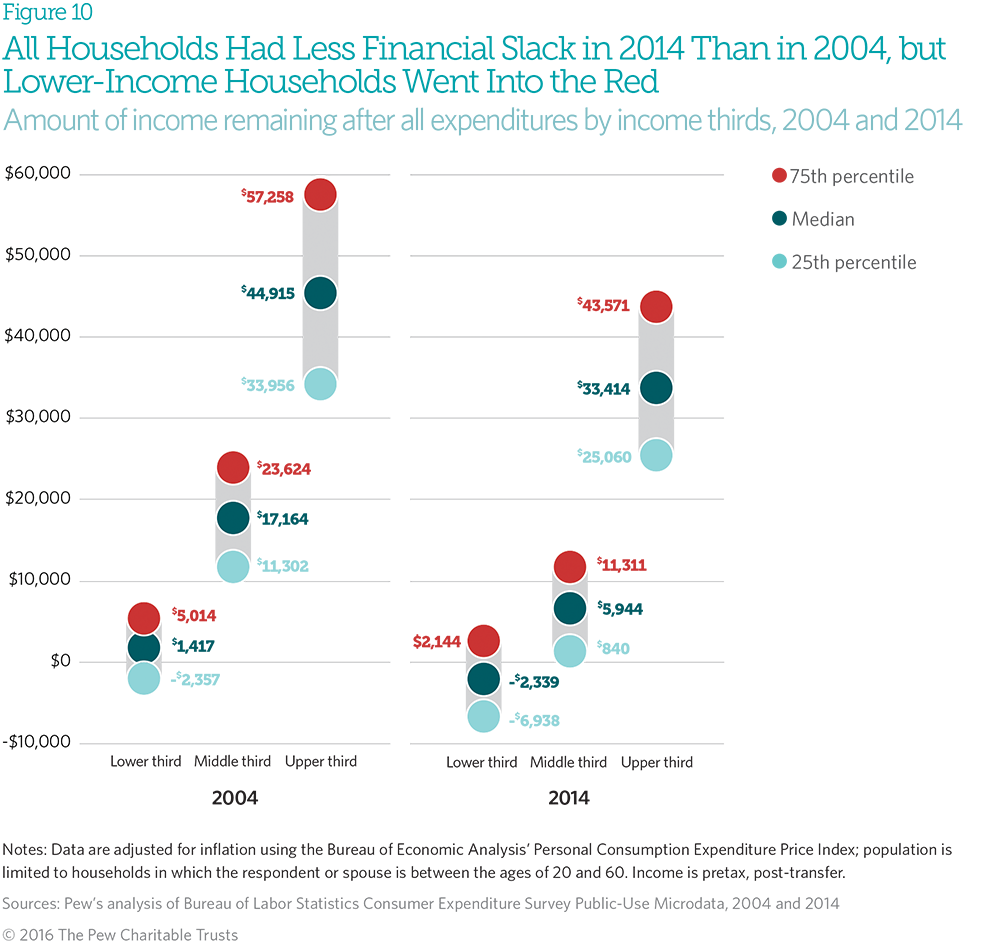
But let's assume that wages, or at least the perception thereof, is indeed rising - is this helping the average American? Well, as we showed earlier this week, the net "after expense" income of average Americans measured in real dollars has declined from $17K in 2004 to $6,000 in 2014 because as wages have declined dramatically, expenses have surged. In fact, according to the recent Pew study, by 2014, median income had fallen by 13 percent from 2004 levels, while expenditures had increased by nearly 14 percent, As such a 2.5%, or 3.5% or even 10% increases in wages will not manage to offset the surging expenditures, mostly on rent.
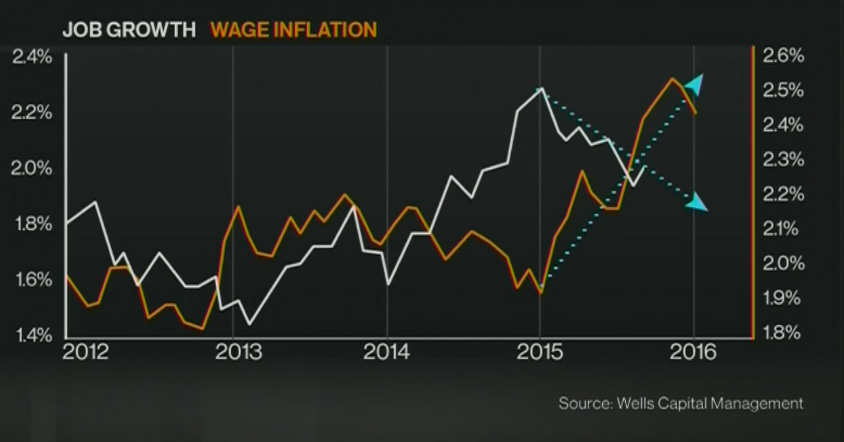
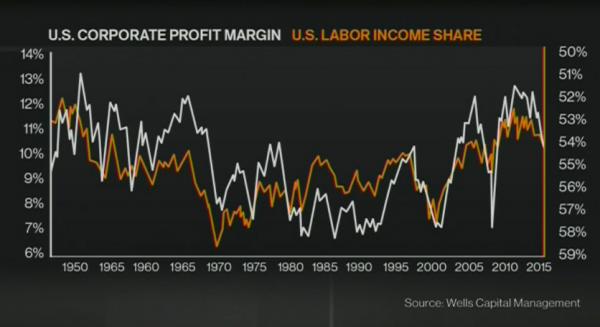
All of this you will never see discussed in a sellside research report, which instead relies on the basic hourly earnings headline numbers. Instead, you will see charts like this from Wells Capital's Jim Paulsen.
And yet, even the analysts who are only looking at the most rudimentary data are now warning that a new problem is emerging for the US economy, a problem which is always present whenever wages are rising, while overall economic growth is stalling (as it is currently according to the Atlanta Fed with a 0.7% Q1 GDP) and corporate profits are about to plunge by the most since the financial crisis: stagflation. In a note earlier today, Deutsche Bank laid out the following ominous warning:
What Deutsche Bank is referring to is the following chart which shows the explicit and inverse correlation between corporate profits and employee wages. What it demonstrates clearly is that if indeed labor income, i.e., wages, are rising, then profit margins have no choice but to fall even more; this means that if the stock market wishes to continue rising even higher it will only achieve this with margin expansion, which however can only be achieved by even more Fed intervention and more stimulative inflation, which then pushes wages even higher generating a self-defeating feedback loop.
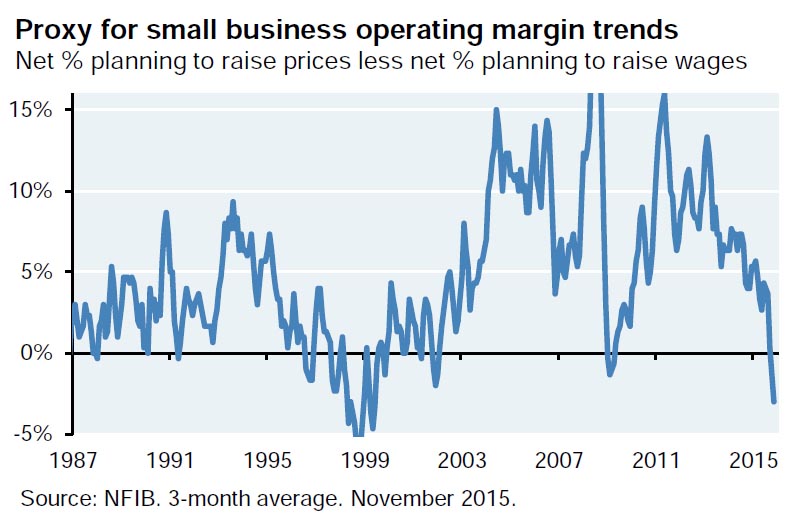
This is something we touched upon early in January when we made an observation on small business operating margins, namely that "If Companies Are Telling The Truth, Profit Margins Are About To Collapse The Most In The 21st Century."
Which brings us to the following Bloomberg TV interview with Wells Fargo's Jim Paulsen in which the otherwise jovial permabull focuses on only one thing: the rising threat of stagflation. This is what he said:
... At this point we would like to interject that while we love the strawman argument that real wages are "growing fast" as much as the next guy, the reality is that this is bullshit as the previously shown chart from Pew has demonstrated: whether Americans are spending for more items, or actual prices are soaring, the consumer's net income as shown below, has plunged.
Anyway, back to Paulsen who then says this:
Can this scenario tip us into a recession Paulsen is asked, his answer: "it's possible. I am concerned that the Fed is so dovish in the face of rising core inflation." Which means that now that the "very serious economists" are talking about it, get ready to hear much more about the "threat of stagflation" for the US economy, a threat which the Fed is powerless to defeat unless it is willing to launch another market crash.
|
|||
Why JPMorgan Believes:Central Banks Can No Longer Save The DayIn recent weeks, JPMorgan has turned decidedly sour on the US equity market: one month ago, on March 3, JPM announced that "for the first time this cycle", it has gone underweight stocks.
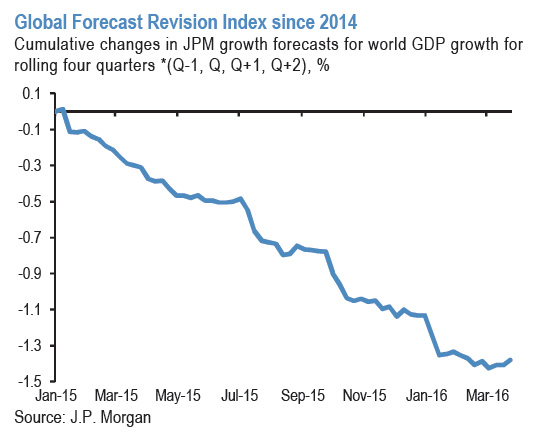
To be sure, the continued bounce since the JPM call has not been exactly reassuring of the forecast's accuracy. However, what is surprising is that when faced with unpalatable price action, sellside researchers usually flip their call quickly. Not in this case, because in a surprisingly candid piece released overnight, JPM's Jan Loeys doubles down, and after asking rhetorically "Can central banks really save the day, or cycle?", his answer is no. In fact, after saying now is the time to sell stocks, JPM's head of global asset allocation is now even far more concerned about the over economy where his biggest concern is that central banks are powerless to stop the "collapsing productivity growth." Loeys begins as follows:
And here is why JPM's explanation why central banks are now powerless to stop the ongoing global contraction:
This is something we noted last night when we noted the increasing prevalence of warnings about an upcoming US stagflation. It is also what is most troubling to JPM.
* * * But perhaps most amusing was the following Freudian slip in the JPM piece:
Then why bring it up... and if you don't, who does |
|||
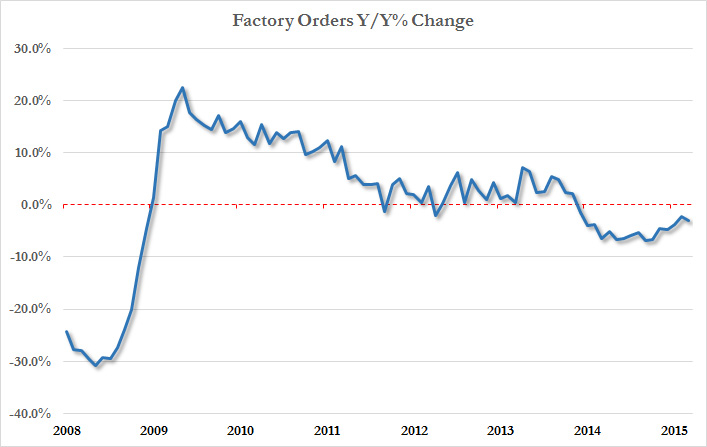
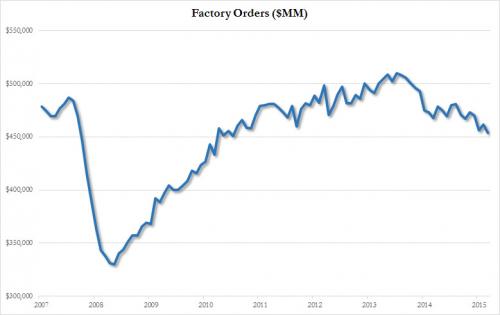
Manufacturing Recession Deepens:Factory Orders Drop To Five Year Low;16 Consecutive DeclinesIn 60 years, the US economy has not suffered a 16-month continuous YoY drop in Factory orders without being in recession. Moments ago the Department of Commerce confirmed that this is precisely what the US economy did, when factory orders not only dropped for the 16th consecutive month Y/Y, after declining 1.7% from last month...
... but at $454 billion for the headline number, this was the lowest print since the summer of 2011.
Market reaction: stocks rebound on the news and are now well in the green
|
|||
| TO TOP | |||
| MACRO News Items of Importance - This Week | |||
GLOBAL MACRO REPORTS & ANALYSIS |
|||
US ECONOMIC REPORTS & ANALYSIS |
|||
| CENTRAL BANKING MONETARY POLICIES, ACTIONS & ACTIVITIES | |||
| Market - WEDNESDAY STUDIES | |||
| STUDIES - MACRO pdf | |||
TECHNICALS & MARKET |
|
||
TECHNICALS & MARKET |
04-06-16 |
||
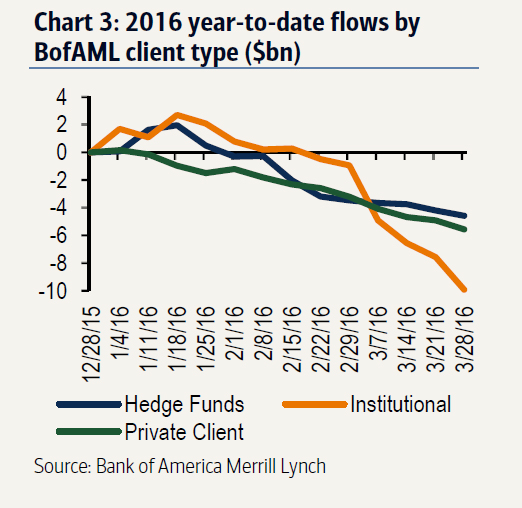
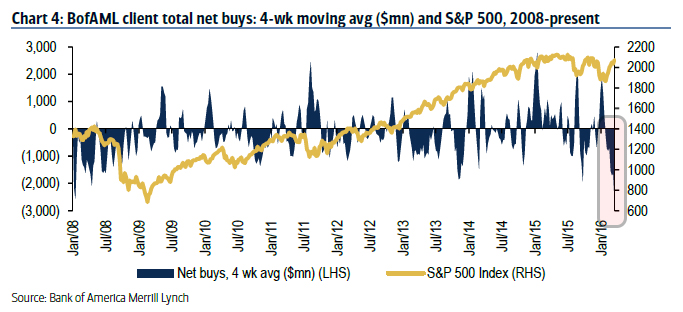
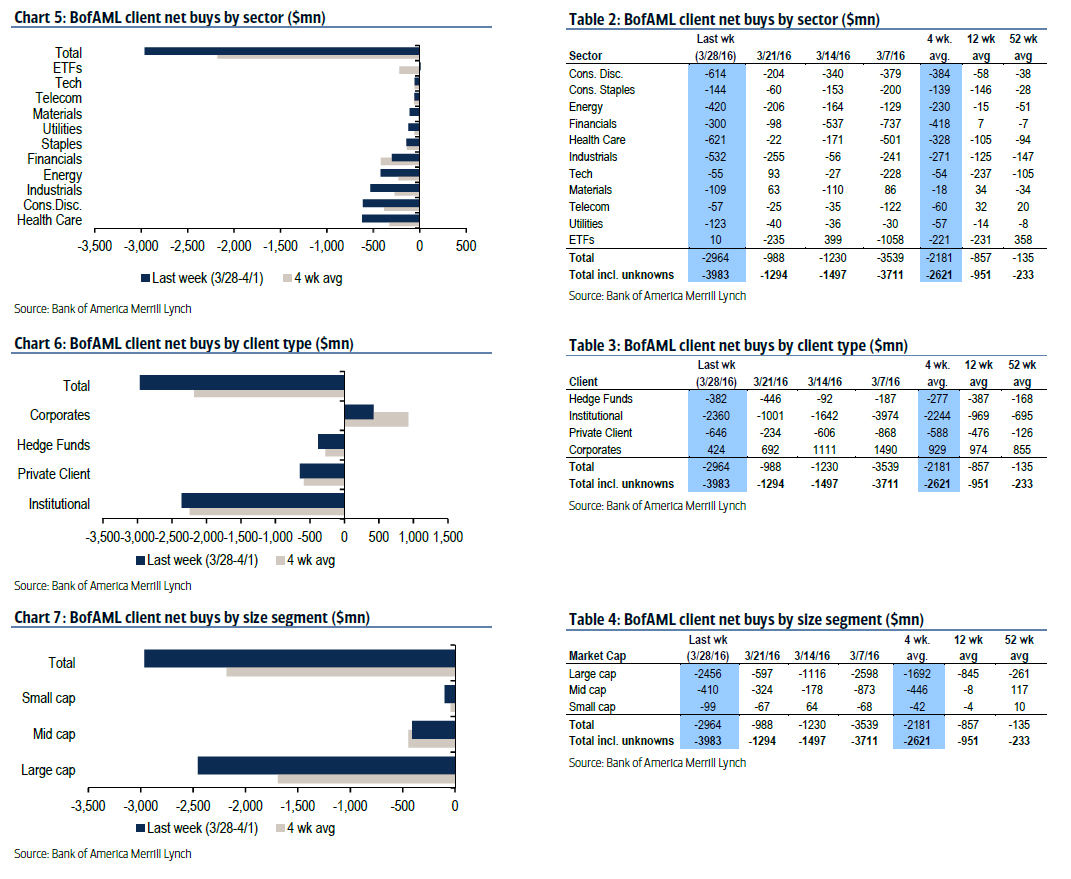
'Everything Is Being Sold'Smart Money Selling Soars,Now In 10th Straight Week"Still No Confidence In The Rally" - that's the title of the latest weekly BofA report looking at the buying and selling by its smart money clients (institutional clients, private clients and hedge funds), which finds that not only were sales by this group of clients last week the largest since September, and the fifth-largest in our data history, but this was the 10th consecutive week of selling as absolutely nobody believed this fakest of fake "rebounds" in recent history.
From BofA:
This can be seen in the chart below, where it becomes obvious that while the last two market dips in August and January were aggressively bought, this time nobody, well, buys it. In fact, the 4 week average selling has been the greatest almost on record.
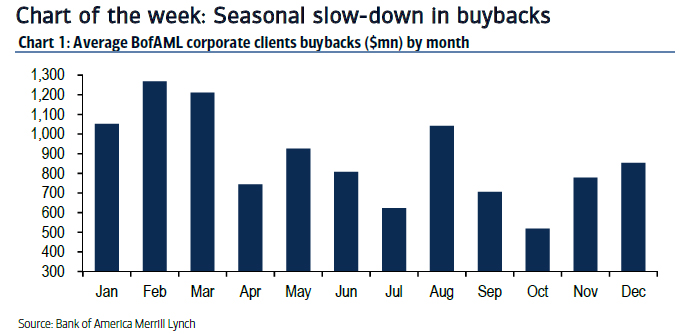
More troubling, buybacks are slowing down fast: "Buybacks by corporate clients decelerated to their lowest levels since the comparable week at the end of 4Q. April has historically been one of the seasonally lightest months for buybacks by our clients after October and July (see chart below)."
And while previously, smart money at least had a preference to one or more sectors which they bought as they dumped everything else, this week that was not the case: "everything is being sold."
The central banks will have to try harder to restore confidence. Wait, what's that, the harder they try to restore confidence that all is well, the less confidence there is? Oh... |
|||
| COMMODITY CORNER - AGRI-COMPLEX | |||
| THESIS - Mondays Posts on Financial Repression & Posts on Thursday as Key Updates Occur | |||
|
2016 | THESIS 2016 |  |
| 2015 - FIDUCIARY FAILURE | 2015 | THESIS 2015 |  |
| 2014 - GLOBALIZATION TRAP | 2014 |  |
|
 |
|||
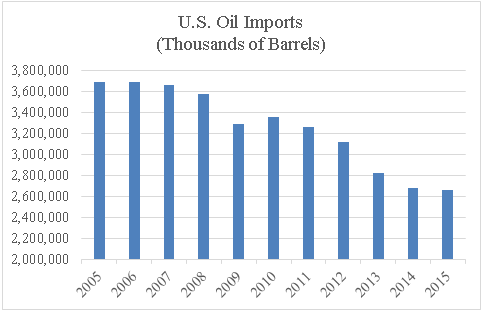
Chris Casey: “COST-PUSH INFLATION ISANOTHER KEYNESIAN CONCEPT THE FEDBELIEVES IN –They’re Wrong!”FRA Co-founder Gordon T. Long is joined by Christopher P. Casey in discussing the decrease in oil price and its potential effect on the global economy.
COST PUSH INFLATION
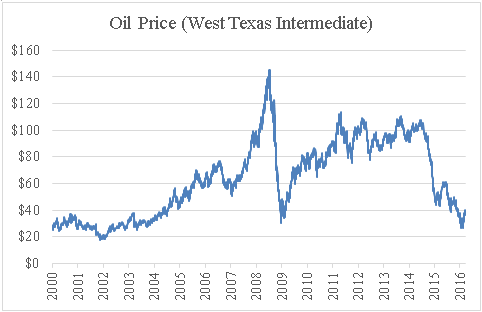
It used to be that minor shifts in the oil price had profound impact on the economy, but that isn’t the case right now. Oil went from about $25 in 2003 to $140 in 2008, back down to $30 in late 2008, and $140 a couple of years ago. But have we ever seen a price level that rose or decreased according to the oil prices over the last fifteen years? The answer is no. The issue is that the Federal Reserve does believe in cost-push inflation, and they do think that deflation could be caused by lower oil prices.
There’s a possibility that this could spike interest rates, or mitigate a downfall in interest rates. STATE OF THE OIL MARKETS
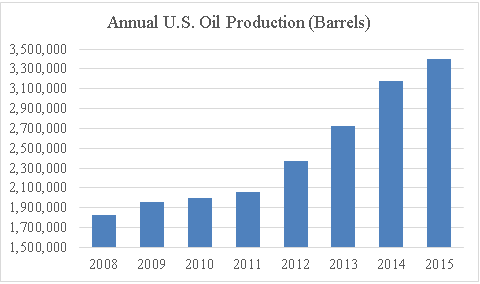
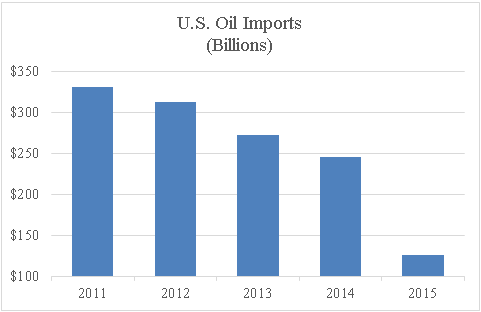
Lower energy prices used to be considered good for the economy, since people have more money to spend. But that’s going toward servicing debt; it’s not actually consumption, it’s going toward debt payments. There are also some real dangers that aren’t being discussed by mainstream media. Oil production has increased about 85% since 2008, but what isn’t mentioned is how oil imports have decreased. It’s down from approximately 12% of total imports to 5% today, not just in Dollar terms but overall volume. T
SAUDIA ARABIA PEG The Riyadh is pegged to the US Dollar at 3.75 Riyadh to the US Dollar, but their economy is under strain and their deficit is staggering. In any fixed exchange rate, the only way to keep it is through manipulation of the currency market by active buying and selling of Riyadh and US Dollars, but that is only making them go bankrupt faster. This could ultimately affect US interest rates as well. OIL SUPPLY & DEMAND
FEDERAL RESERVE’S MISCONCEPTIONS Regarding the nature of growth, history shows that the key is a high level of savings and decreasing government intervention. Another is the idea of deflation being bad; for example, the US experienced experienced two 30-40 year periods where the price level fell by half, but it was also the greatest period of growth in US history. The Federal Reserve also has misconceptions about inflation’s impact on unemployment, and interest rates, which could cause a banking crisis. ADVICE FOR INVESTORS If people believe that the oil market will create a banking crisis in the future, then they need to look at assets outside of the banking system. Gold and silver should absolutely be considered as part of their portfolio since it’s much safer than a number of currencies, as it has alternative value. Farmland is also an excellent inflation hedge and pays a dividend, unlike precious metals.
Abstract by: Annie Zhou: [email protected] Video Editing by: Min Jung Kim <[email protected]
|
|||
|
2013 2014 |
 |
||
2011 2012 2013 2014 |
 |
||
I - POLITICAL |
|||
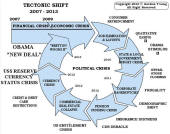
CENTRAL PLANNING - SHIFTING ECONOMIC POWER - STATISM
MACRO MAP - EVOLVING ERA OF CENTRAL PLANNING
|
G | THEME | |
| - - CRISIS OF TRUST - Era of Uncertainty | G | THEME | |
CORRUPTION & MALFEASANCE - MORAL DECAY - DESPERATION - RESENTMENT. |
US | THEME PAGE |  |
| - - SECURITY-SURVEILLANCE COMPLEX - STATISM | G | THEME | |
| - - CATALYSTS - FEAR (POLITICALLY) & GREED (FINANCIALLY) | G | THEME | |
II-ECONOMIC |
|||
| GLOBAL RISK | |||
| - GLOBAL FINANCIAL IMBALANCE - FRAGILITY, COMPLEXITY & INSTABILITY | G | THEME | |
| - - SOCIAL UNREST - INEQUALITY & A BROKEN SOCIAL CONTRACT | US | THEME | |
| - - ECHO BOOM - PERIPHERAL PROBLEM | M | THEME | |
| - -GLOBAL GROWTH & JOBS CRISIS | |||
| - - - PRODUCTIVITY PARADOX - NATURE OF WORK | THEME | MA w/ CHS |
|
| 01-08-16 | THEME | MA w/ CHS |
|
| - - - STANDARD OF LIVING - EMPLOYMENT CRISIS, SUB-PRIME ECONOMY | US | THEME | MA w/ CHS |
III-FINANCIAL |
|||
|
FLOWS - Capital, Liqudity & Credit Flows
|
MATA RISK ON-OFF |
THEME |
w/ R Duncan |
| CRACKUP BOOM - ASSET BUBBLE | 12-31-15 | THEME | |
| SHADOW BANKING - LIQUIDITY / CREDIT ENGINE | M | THEME | |
| GENERAL INTEREST |
|
||
| STRATEGIC INVESTMENT INSIGHTS - Weekend Coverage | |||
 |
|||
|
SII | ||
|
SII | ||
|
SII | ||
|
SII | ||
| TO TOP | |||


Read More - OUR RESEARCH - Articles Below

Tipping Points Life Cycle - Explained
Click on image to enlarge
TO TOP
 |
YOUR SOURCE FOR THE LATEST THINKING & RESEARCH
|
�
TO TOP