|
JOHN RUBINO'SLATEST BOOK |
|||||||||||||||||||||||||||||||||||||||||||||||||||||||||||||||||||||||||||||||||||||||||||||||||||||||||||||||||||||||||||||||||||||||||||||||||||||||||||||||||||||||||||||||||||||||||||||||||||||||||||||||||||||||
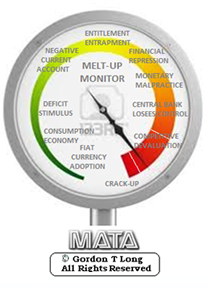
"MELT-UP MONITOR "
Meltup Monitor: FLOWS - The Currency Cartel Carry Cycle - 09 Dec 2013 Meltup Monitor: FLOWS - Liquidity, Credit & Debt - 04 Dec 2013 Meltup Monitor: Euro Pressure Going Critical - 28- Nov 2013 Meltup Monitor: A Regression-to-the-Exponential Mean Required - 25 Nov 2013
|

![]()
"DOW 20,000 "
Lance Roberts Charles Hugh Smith John Rubino Bert Dohman & Ty Andros
|

HELD OVER
Currency Wars
Euro Experiment
Sultans of Swap
Extend & Pretend
Preserve & Protect
Innovation
Showings Below
"Currency Wars "
|


"SULTANS OF SWAP" archives open ACT II ACT III
ALSO Sultans of Swap: Fearing the Gearing! Sultans of Swap: BP Potentially More Devistating than Lehman! |

"EURO EXPERIMENT"
archives open EURO EXPERIMENT : ECB's LTRO Won't Stop Collateral Contagion!
EURO EXPERIMENT: |

![]()
"INNOVATION"
archives open |

"PRESERVE & PROTE CT"
archives open |

Mon. May 5th, 2014
![]()
Follow Our Updates
on TWITTER
https://twitter.com/GordonTLong
AND FOR EVEN MORE TWITTER COVERAGE
STRATEGIC MACRO INVESTMENT INSIGHTS
 2014 THESIS: GLOBALIZATION TRAP
NOW AVAILABLE FREE to Trial Subscribers
185 Pages
What Are Tipping Poinits?
Understanding Abstraction & Synthesis
Global-Macro in Images: Understanding the Conclusions
| MAY | ||||||
| S | M | T | W | T | F | S |
| 1 | 2 | 3 | ||||
| 4 | 5 | 6 | 7 | 8 | 9 | 10 |
| 11 | 12 | 13 | 14 | 15 | 16 | 17 |
| 18 | 19 | 20 | 21 | 22 | 23 | 24 |
| 25 | 26 | 27 | 28 | 29 | 30 | 31 |
KEY TO TIPPING POINTS |
| 1 - Risk Reversal |
| 2 - Japan Debt Deflation Spiral |
| 3- Bond Bubble |
| 4- EU Banking Crisis |
| 5- Sovereign Debt Crisis |
| 6 - China Hard Landing |
| 7 - Chronic Unemployment |
| 8 - Geo-Political Event |
| 9 - Global Governance Failure |
| 10 - Chronic Global Fiscal ImBalances |
| 11 - Shrinking Revenue Growth Rate |
| 12 - Iran Nuclear Threat |
| 13 - Growing Social Unrest |
| 14 - US Banking Crisis II |
| 15 - Residential Real Estate - Phase II |
| 16 - Commercial Real Estate |
| 17 - Credit Contraction II |
| 18- State & Local Government |
| 19 - US Stock Market Valuations |
| 20 - Slowing Retail & Consumer Sales |
| 21 - China - Japan Regional Conflict |
| 22 - Public Sentiment & Confidence |
| 23 - US Reserve Currency |
| 24 - Central & Eastern Europe |
| 25 - Oil Price Pressures |
| 26 - Rising Inflation Pressures & Interest Pressures |
| 27 - Food Price Pressures |
| 28 - Global Output Gap |
| 29 - Corruption |
| 30 - Pension - Entitlement Crisis |
| 31 - Corporate Bankruptcies |
| 32- Finance & Insurance Balance Sheet Write-Offs |
| 33 - Resource Shortage |
| 34 - US Reserve Currency |
| 35- Government Backstop Insurance |
| 36 - US Dollar Weakness |
| 37 - Cyber Attack or Complexity Failure |
| 38 - Terrorist Event |
| 39 - Financial Crisis Programs Expiration |
| 40 - Natural Physical Disaster |
| 41 - Pandemic / Epidemic |
Reading the right books?
No Time?

We have analyzed & included
these in our latest research papers Macro videos!
![]()
OUR MACRO ANALYTIC
CO-HOSTS
John Rubino's Just Released Book

![]()
Charles Hugh Smith's Latest Books

![]()
![]()
Our Macro Watch Partner
Richard Duncan Latest Books

MACRO ANALYTIC
GUESTS
F William Engdahl

![]()

![]()

![]()

![]()

![]()
OTHERS OF NOTE
![]()

![]()

![]()


![]()
Book Review- Five Thumbs Up
for Steve Greenhut's
Plunder!

![]()
|
Scroll TWEETS for LATEST Analysis
Read More - OUR RESEARCH - Articles Below
HOTTEST TIPPING POINTS |
Theme Groupings |
||||||||||||||||
|
|||||||||||||||||
We post throughout the day as we do our Investment Research for: LONGWave - UnderTheLens - Macro |
|||||||||||||||||
"BEST OF THE WEEK "
|
Posting Date |
Labels & Tags | TIPPING POINT or THEME / THESIS or INVESTMENT INSIGHT |
||||||||||||||
|
|||||||||||||||||
EMPLOYMENT - Working Age Americans Without A Job Has Risen By 27 Million Since 2000 The Number Of Working Age Americans Without A Job Has Risen By 27 Million Since 2000 05-04-14 Michael Snyder of The Economic Collapse blog, via ZH Did you know that there are
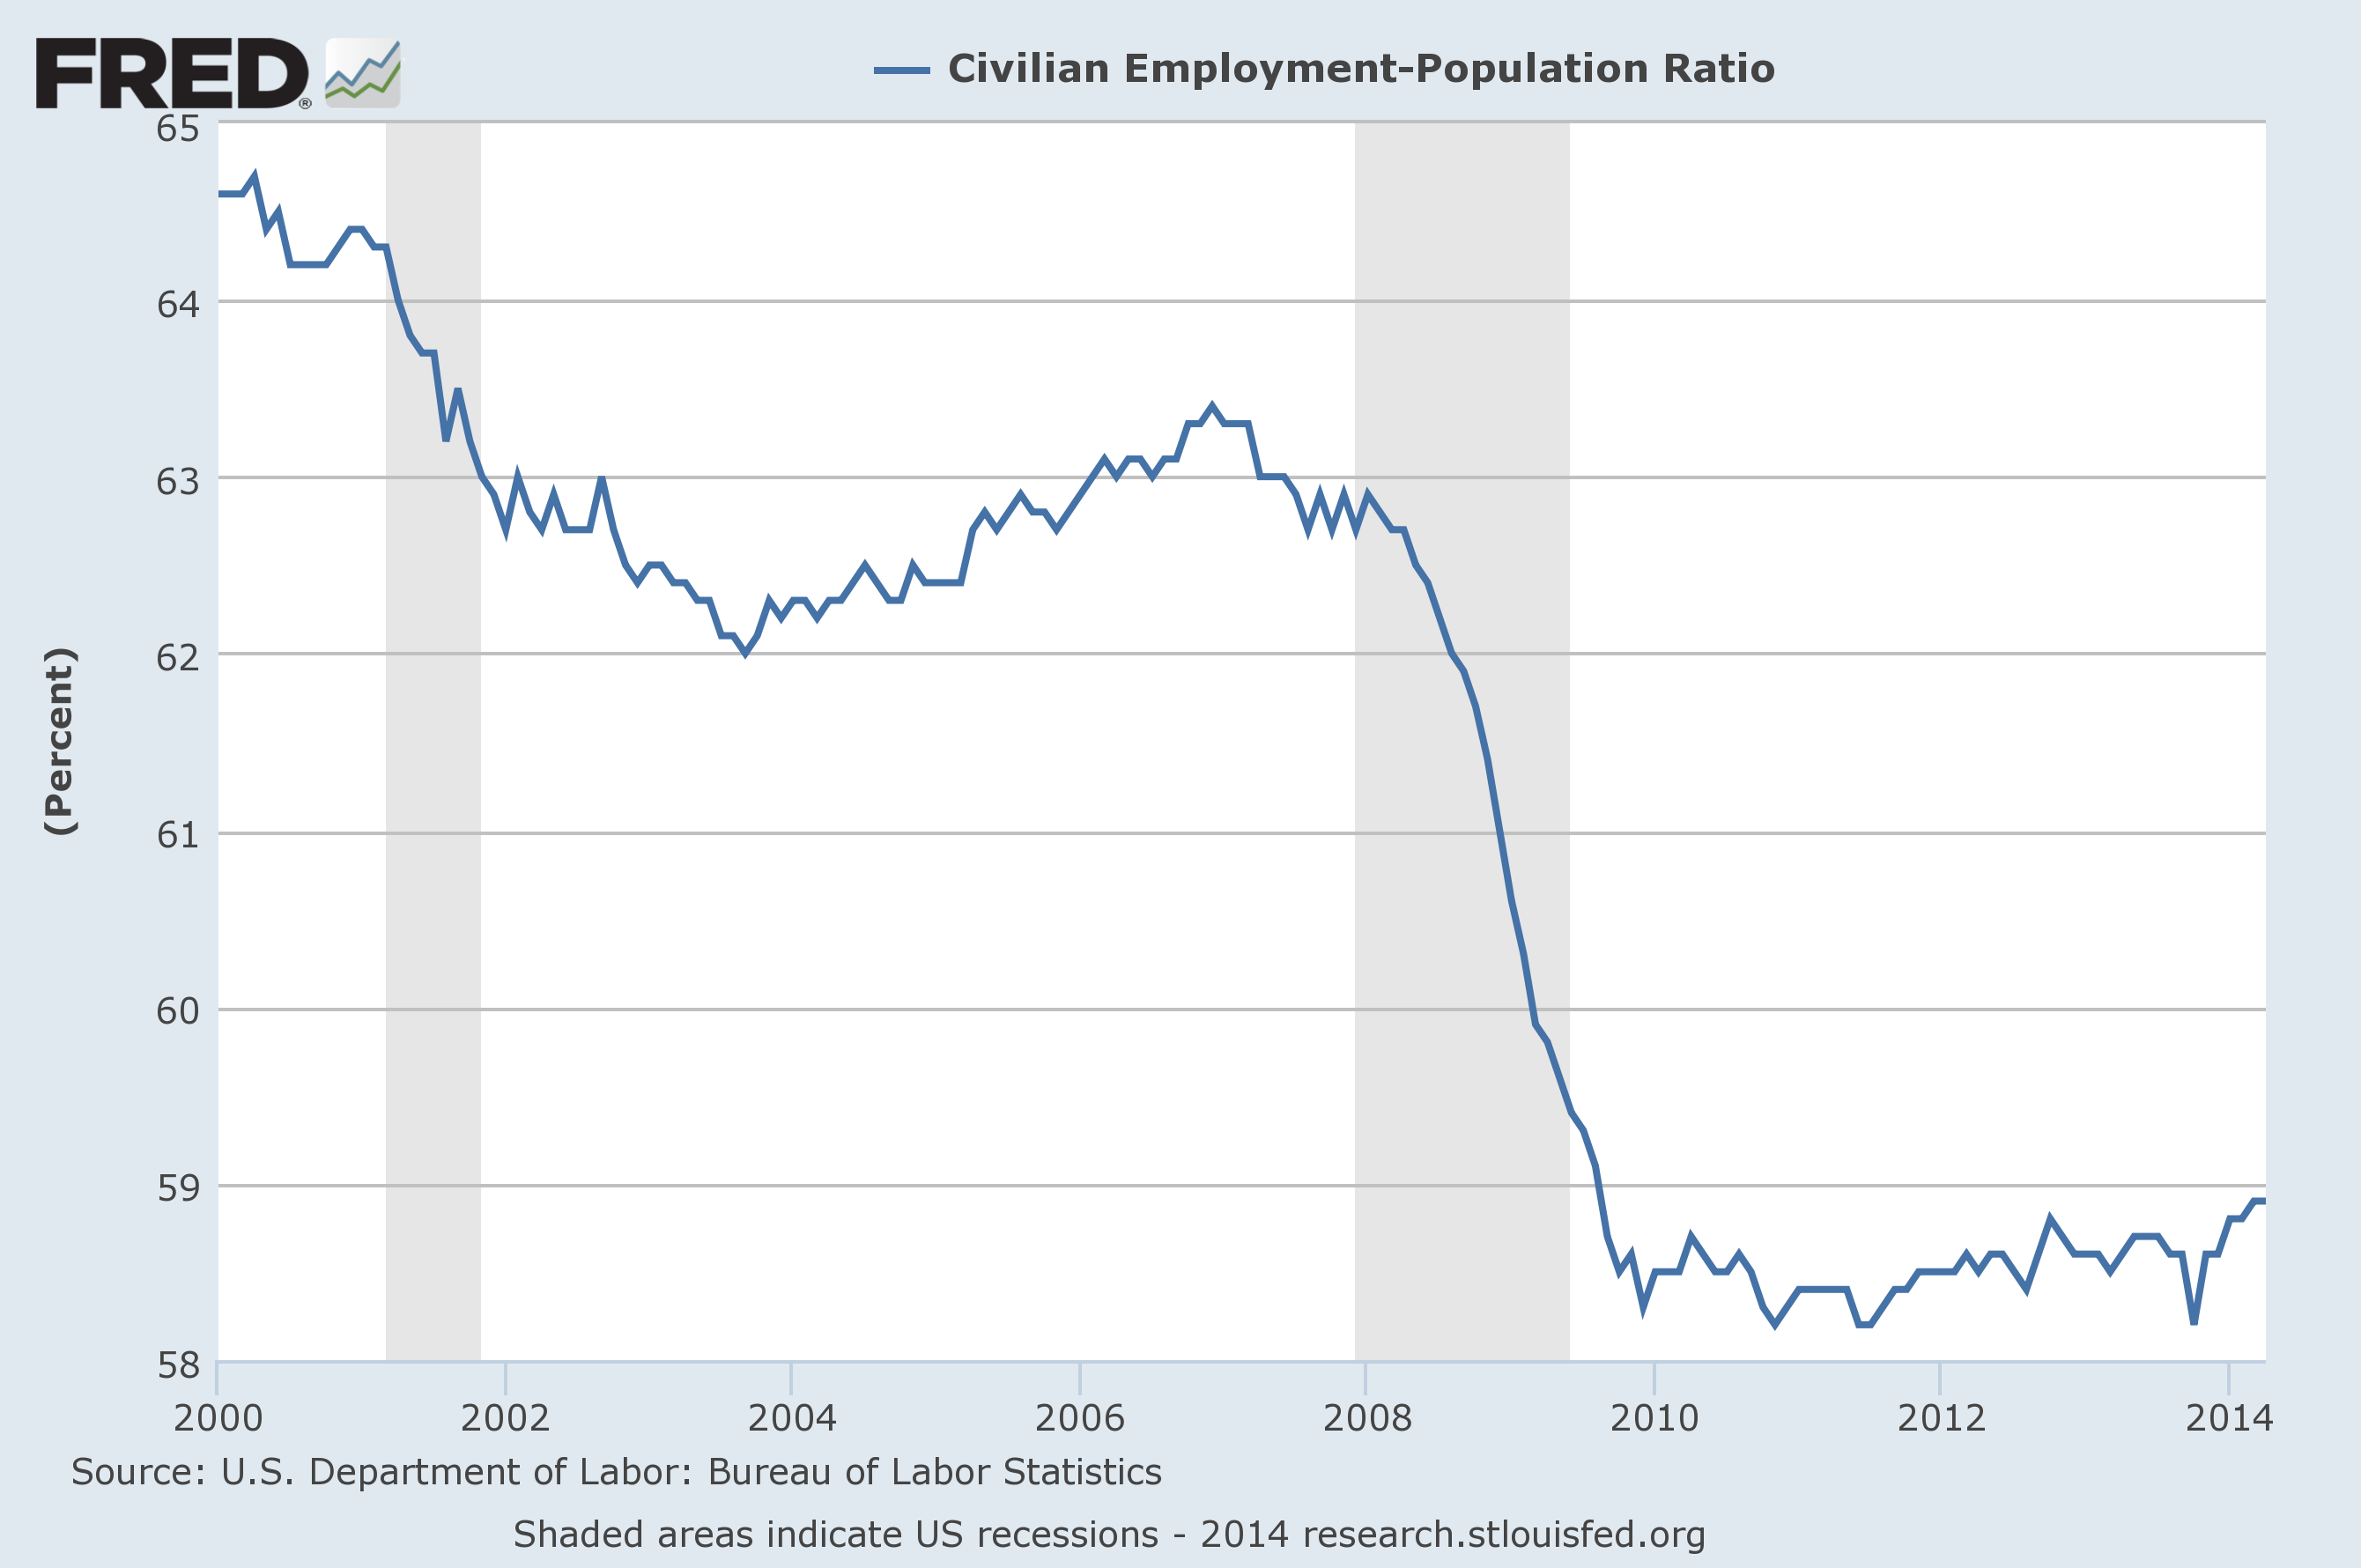
So how in the world can the government claim that the unemployment rate has "dropped" to "6.3 percent"? Well, it all comes down to how you define who is "unemployed". For example, last month the government moved another 988,000 Americans into the "not in the labor force" category. According to the government, at this moment there are 9.75 million Americans that are "unemployed" and there are 92.02 million Americans that are "not in the labor force" for a grand total of 101.77 million working age Americans that do not have a job. Back in April 2000, only 5.48 million Americans were unemployed and only 69.27 million Americans were "not in the labor force" for a grand total of 74.75 million Americans without a job. That means that the number of working age Americans without a job has risen by 27 million since the year 2000. Any way that you want to slice that, it is bad news. Well, what about as a percentage of the population? Has the percentage of working age Americans that have a job been increasing or decreasing? As you can see from the chart posted below, the percentage of working age Americans with a job has been in a long-term downward trend. As the year 2000 began, we were sitting at 64.6 percent. By the time the great financial crisis of 2008 struck, we were hovering around 63 percent. During the last recession, we fell dramatically to under 59 percent and we have stayed there ever since... And the numbers behind this chart also show that employment in America did not increase last month. In March, 58.9 percent of all working age Americans had a job. In April, 58.9 percent of all working age Americans had a job. Things are not getting worse (at least for the moment), but things are also definitely not getting better. The month that Barack Obama entered the White House, we were in the midst of the worst economic downturn since the Great Depression and only 60.6 percent of all working age Americans had a job. Since only 58.9 percent of all working age Americans have a job now, that means that the employment situation in America is still significantly worse than it was the day Barack Obama took office. So don't let anyone fool you with talk of an "employment recovery". It simply is not happening. The official unemployment rate bears so little relation to economic reality at this point that it has essentially become meaningless. Look, how in the world can we have an "unemployment rate" of just "6.3 percent" when 20 percent of all American families do n0t have a single member that is working? Here is how that 20 percent figure was arrived at...
So if one out of every five families is completely unemployed, then why is the official government unemployment rate not up at Great Depression era levels? Could it be that the government is manipulating the numbers to make them look much better than they actually are? Why don't they just go ahead and get it over with? They can just define every American that is not working as "not in the labor force" and then we can have "0.0 percent unemployment". Then we can all have a giant party and celebrate how wonderful the U.S. economy is. And don't be fooled by the "288,000 jobs" that were added to the U.S. economy last month. For workers under the age of 55, the number of jobs actually dropped by a whopping 259,000 If we were using honest numbers, the official unemployment rate would look a lot scarier. John Williams of shadowstats.com has calculated that the unemployment rate should be about 23 percent. I don't think that is too far off. Meanwhile, the quality of the jobs in our economy continues to go down. The House Ways and Means Committee says that seven out of every eight jobs that have been "added" to the economy under Barack Obama have been part-time jobs. But you can't raise a family or plan a career around a part-time job. To be honest, it is very hard for a single person to even survive on a part-time wage in this economic environment. As the quality of our jobs goes down, so do our incomes. The median household income has declined for five years in a row, and the middle class is falling apart. Without middle class incomes, you can't have a middle class. Considering what we have been watching happen, it should be no surprise that the homeownership rate in the United States has dropped to the lowest level in 19 years or that the number of Americans receiving money from the government each month exceeds the number of full-time workers in the private sector by more than 60 million. For many more statistics like this, please see my previous article entitled "17 Facts To Show To Anyone That Believes That The U.S. Economy Is Just Fine". At a gut level, most Americans understand that things are much worse than they used to be. The Pew Research Center recently asked people what "class" they consider themselves to be. The results were shocking. Back in 2008, only 25 percent of all Americans considered themselves to be "lower middle class" or "poor". Earlier this year, an astounding 40 percent of all Americans chose one of those designations. We are in the midst of a long-term economic decline, and no amount of propaganda is going to change that. But based on the "happy numbers" being trumpeted by the mainstream media, the Federal Reserve is slowly bringing their quantitative easing program to an end. When quantitative easing is finally totally cut off, we shall see how the financial markets and the U.S. economy perform without artificial life support. Personally, I don't think that it is going to be pretty! |
7 - Chronic Unemployment | ||||||||||||||||
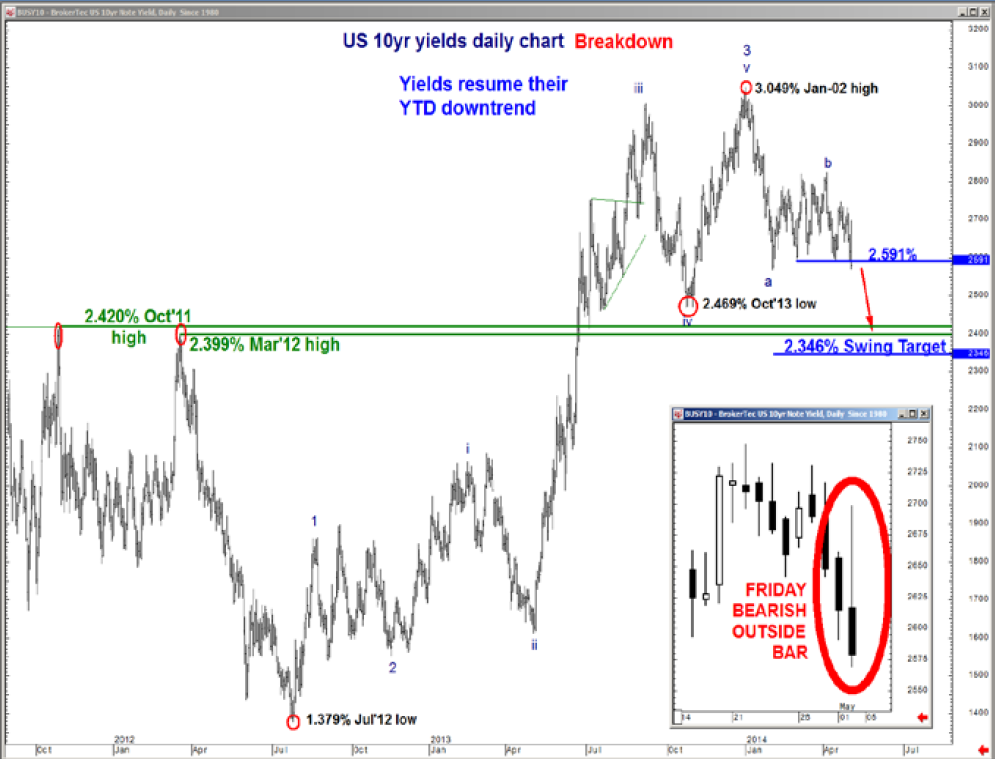
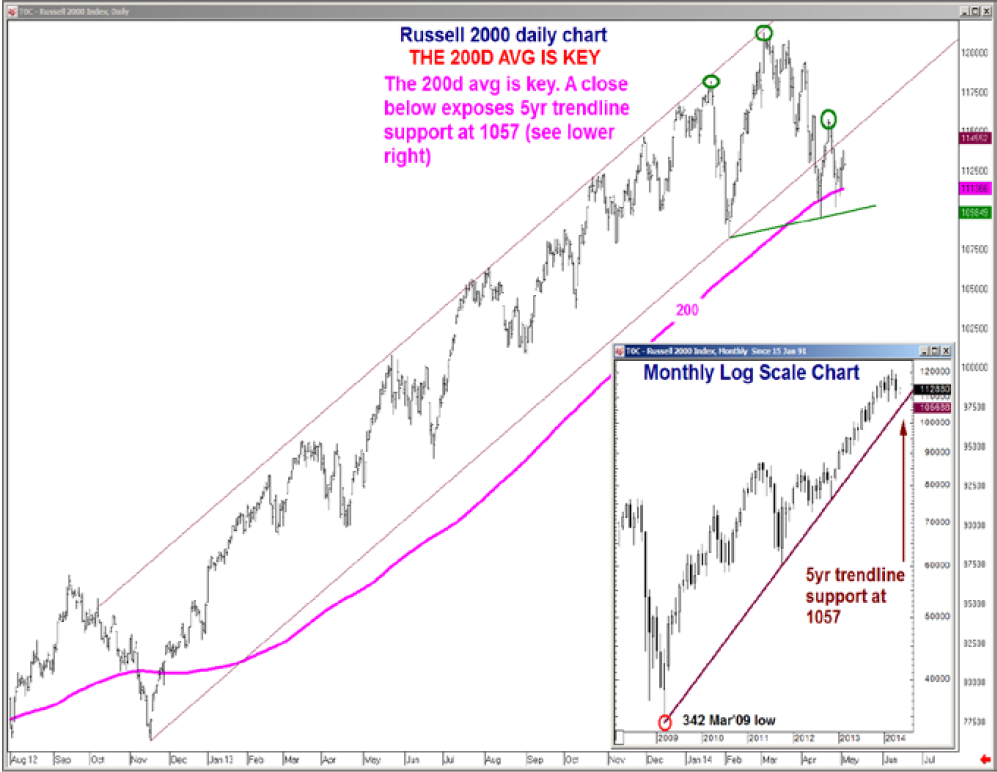
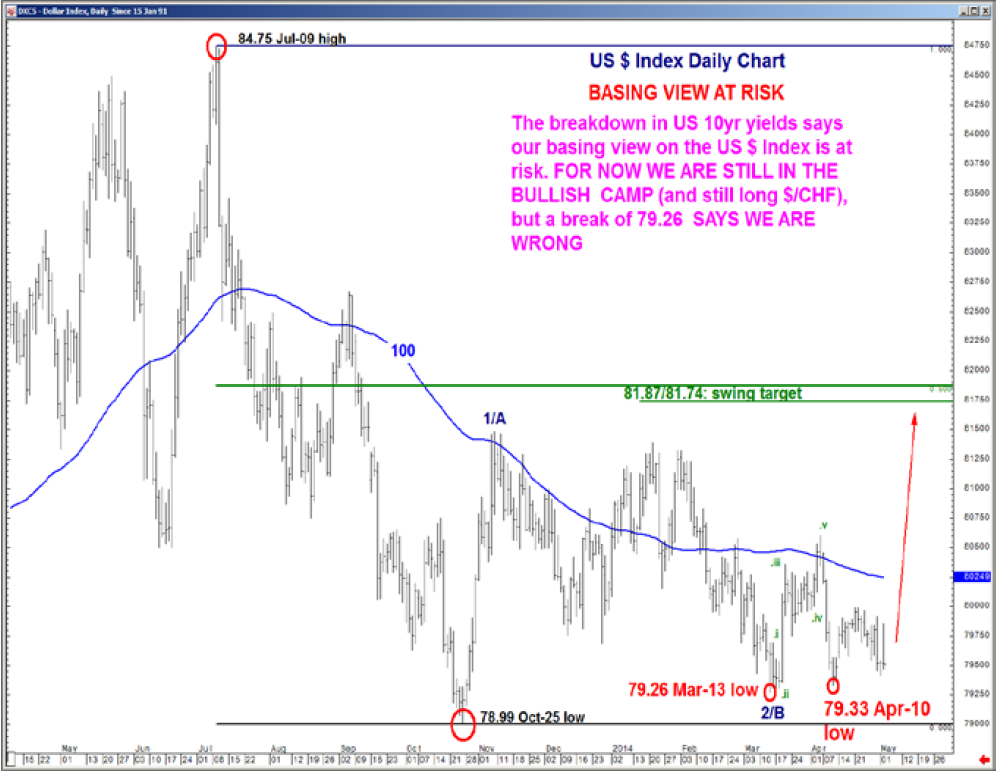
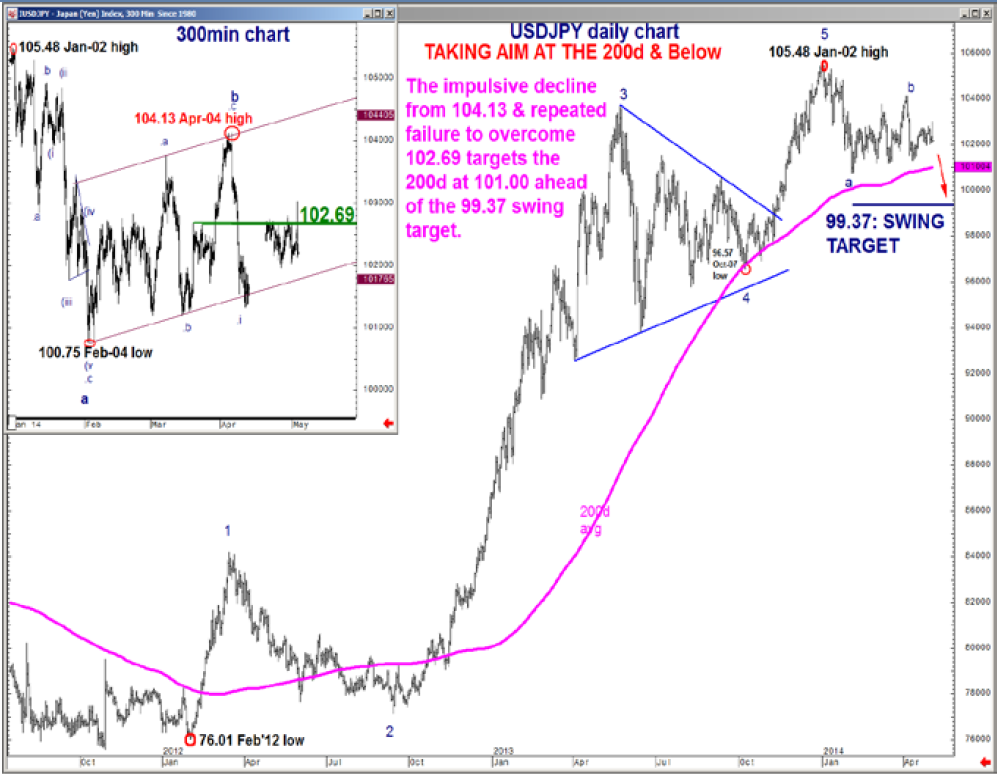
US - 10Y UST and USDJPY Weakness "Watch The Russell" & Don't Fade The Bond Rally, BofA Warns 05-04-14 BofAML's Macneil Curry via ZH 10yr USTs threaten the US $ US 10yr Treasury yields take center stage next week. After 3 months of range trading, they have resumed their year-to-date downtrend. The Friday Bearish Outside Bar (a bearish chart pattern indicating further downside) and closing break of the 2.591% range lows says lower 10yr yields are coming. We target the 2.420%/2.399% multi-year pivot zone and potentially below. DON’T FADE THIS BREAKDOWN. Watch US equities. While the S&P500 is still constructive, small caps and tech remain vulnerable. Indeed, the Russell 2000 is dangerously close to its 200d moving average, a close below which could lead to a bout of risk aversion and be the catalyst for further yield weakness. From an FX perspective, the 10yr yield breakdown threatens our bullish US $ index / bullish $/CHF and bearish €/$ view. HOWEVER, FOR NOW WE ARE STICKING TO OUR GUNS. A break below 79.26 (US $ Index), 0.8699 ($/CHF) and above 1.3967 (€/$) forces us to reassess. In contrast, the yield breakdown increases our n/term bearish conviction on $/¥. Chart of the week: 10yr Treasuries return to trend
The Friday Bearish Outside Bar and close below the 3m range lows say that 10yr yields have returned to a downward trending environment. In the sessions weeks ahead we target the 2.420%/2.399% pivot zone and potentially below. Watch the Russell 2000 and its 200d avg
We are becoming increasingly concerned about small cap and tech stocks. Indeed, the Russell 2000 is dangerously close to its 200d (1113). A closing break below would expose 5yr trendline support (1057) and could lead to a bout of near term risk aversion. This is bullish Treasuries. Bullish US $ index view at risk. 79.26 is KEY The breakdown in US 10yr yields threatens our bullish US $ Index outlook, as well as our long $/Chf position and topping view in €/$. However, for now we are sticking to our call. A US $ Index break of 79.26 (the Mar-13 low) says our view is misplaced and opens significant US $ index downside. $/¥ takes aim at its 200d avg and below
In contrast to our bullish US $ Index view, we remain near term $/¥ bears. Indeed the breakdown in 10yr yields adds to this bearish conviction. In the sessions ahead we look for a test and break of the pivotal 200d (now 101.00), targeting the 99.37 swing target.
|
05-04-14 | DRIVERS PATTERNS |
|||||||||||||||
| MOST CRITICAL TIPPING POINT ARTICLES THIS WEEK - May 4th, 2014 - May 10th, 014 | |||||||||||||||||
| JAPAN - DEBT DEFLATION | 2 | ||||||||||||||||
| JAPAN - DEBT DEFLATION | 2 | ||||||||||||||||
| BOND BUBBLE | 3 | ||||||||||||||||
EU BANKING CRISIS |
4 |
||||||||||||||||
| SOVEREIGN DEBT CRISIS [Euope Crisis Tracker] | 5 | ||||||||||||||||
| CHINA BUBBLE | 6 | ||||||||||||||||
| TO TOP | |||||||||||||||||
| MACRO News Items of Importance - This Week | |||||||||||||||||
GLOBAL MACRO REPORTS & ANALYSIS |
|||||||||||||||||
US ECONOMIC REPORTS & ANALYSIS |
|||||||||||||||||
| CENTRAL BANKING MONETARY POLICIES, ACTIONS & ACTIVITIES | |||||||||||||||||
| Market | |||||||||||||||||
| TECHNICALS & MARKET |
|
||||||||||||||||
| COMMODITY CORNER - HARD ASSETS | PORTFOLIO | ||||||||||||||||
| COMMODITY CORNER - AGRI-COMPLEX | PORTFOLIO | ||||||||||||||||
| SECURITY-SURVEILANCE COMPLEX | PORTFOLIO | ||||||||||||||||
| THESIS | |||||||||||||||||
| 2014 - GLOBALIZATION TRAP | 2014 |  |
|||||||||||||||
 |
|||||||||||||||||
|
2013 2014 |
 |
||||||||||||||||
2011 2012 2013 2014 |
 |
||||||||||||||||
| THEMES | |||||||||||||||||
| FLOWS -FRIDAY FLOWS | THEME |  |
|||||||||||||||
| SHADOW BANKING -LIQUIDITY / CREDIT ENGINE | THEME | ||||||||||||||||
| CRACKUP BOOM - ASSET BUBBLE | THEME | ||||||||||||||||
| ECHO BOOM - PERIPHERAL PROBLEM | THEME | ||||||||||||||||
| PRODUCTIVITY PARADOX -NATURE OF WORK | THEME | ||||||||||||||||
| STANDARD OF LIVING -EMPLOYMENT CRISIS | THEME | ||||||||||||||||
| CORPORATOCRACY -CRONY CAPITALSIM | THEME |  |
|||||||||||||||
CORRUPTION & MALFEASANCE -MORAL DECAY - DESPERATION, SHORTAGES. |
THEME |  |
|||||||||||||||
| SOCIAL UNREST -INEQUALITY & A BROKEN SOCIAL CONTRACT | THEME | ||||||||||||||||
| SECURITY-SURVEILLANCE COMPLEX -STATISM | THEME | ||||||||||||||||
| GLOBAL FINANCIAL IMBALANCE - FRAGILITY, COMPLEXITY & INSTABILITY | THEME | ||||||||||||||||
| CENTRAL PLANINNG -SHIFTING ECONOMIC POWER | THEME | ||||||||||||||||
| CATALYSTS -FEAR & GREED | THEME | ||||||||||||||||
| GENERAL INTEREST |
|
||||||||||||||||
| TO TOP | |||||||||||||||||


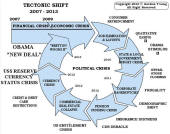
Tipping Points Life Cycle - Explained
Click on image to enlarge
TO TOP
 |
YOUR SOURCE FOR THE LATEST THINKING & RESEARCH
|
�
TO TOP