|
JOHN RUBINO'SLATEST BOOK |
||||||||||||||||||||||||||||||||||||||||||||||||||||||||||||||||||||||||||||||||||||||||||||||||||||||||||||||||||||||||||||||||||||||||||||||||||||||||||||||||||||||||||||||||||||||||||||||||||||||||||||||||||||||||||||||||||||||||||||||||||||||||||||||||||||||||||||||||||||||||||||||||||||||||||||||||||||||||||||||||
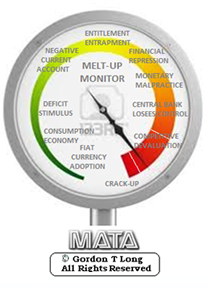
"MELT-UP MONITOR "
Meltup Monitor: FLOWS - The Currency Cartel Carry Cycle - 09 Dec 2013 Meltup Monitor: FLOWS - Liquidity, Credit & Debt - 04 Dec 2013 Meltup Monitor: Euro Pressure Going Critical - 28- Nov 2013 Meltup Monitor: A Regression-to-the-Exponential Mean Required - 25 Nov 2013
|

![]()
"DOW 20,000 "
Lance Roberts Charles Hugh Smith John Rubino Bert Dohman & Ty Andros
|
HELD OVER
Currency Wars
Euro Experiment
Sultans of Swap
Extend & Pretend
Preserve & Protect
Innovation
Showings Below
"Currency Wars "
|

"SULTANS OF SWAP" archives open ACT II ACT III
ALSO Sultans of Swap: Fearing the Gearing! Sultans of Swap: BP Potentially More Devistating than Lehman! |
"EURO EXPERIMENT"
archives open EURO EXPERIMENT : ECB's LTRO Won't Stop Collateral Contagion!
EURO EXPERIMENT: |
![]()
"INNOVATION"
archives open |

"PRESERVE & PROTE CT"
archives open |

RECAP
Weekend Mar. 20th , 2016
Follow Our Updates
on TWITTER
https://twitter.com/GordonTLong
AND FOR EVEN MORE TWITTER COVERAGE
![]()
| MARCH | ||||||
| S | M | T | W | T | F | S |
| 1 | 2 | 3 | 4 | 5 | ||
| 6 | 7 | 8 | 9 | 10 | 11 | 12 |
| 13 | 14 | 15 | 16 | 17 | 18 | 19 |
| 20 | 21 | 22 | 23 | 24 | 25 | 26 |
| 27 | 28 | 29 | 30 | 31 | ||
KEY TO TIPPING POINTS |
| 1- Bond Bubble |
| 2 - Risk Reversal |
| 3 - Geo-Political Event |
| 4 - China Hard Landing |
| 5 - Japan Debt Deflation Spiral |
| 6- EU Banking Crisis |
| 7- Sovereign Debt Crisis |
| 8 - Shrinking Revenue Growth Rate |
| 9 - Chronic Unemployment |
| 10 - US Stock Market Valuations |
| 11 - Global Governance Failure |
| 12 - Chronic Global Fiscal ImBalances |
| 13 - Growing Social Unrest |
| 14 - Residential Real Estate - Phase II |
| 15 - Commercial Real Estate |
| 16 - Credit Contraction II |
| 17- State & Local Government |
| 18 - Slowing Retail & Consumer Sales |
| 19 - US Reserve Currency |
| 20 - US Dollar |
| 21 - Financial Crisis Programs Expiration |
| 22 - US Banking Crisis II |
| 23 - China - Japan Regional Conflict |
| 24 - Corruption |
| 25 - Public Sentiment & Confidence |
| 26 - Food Price Pressures |
| 27 - Global Output Gap |
| 28 - Pension - Entitlement Crisis |
| 29 - Central & Eastern Europe |
| 30 - Terrorist Event |
| 31 - Pandemic / Epidemic |
| 32 - Rising Inflation Pressures & Interest Pressures |
| 33 - Resource Shortage |
| 34 - Cyber Attack or Complexity Failure |
| 35 - Corporate Bankruptcies |
| 36 - Iran Nuclear Threat |
| 37- Finance & Insurance Balance Sheet Write-Offs |
| 38- Government Backstop Insurance |
| 39 - Oil Price Pressures |
| 40 - Natural Physical Disaster |
Reading the right books?
No Time?

We have analyzed & included
these in our latest research papers Macro videos!
![]()
OUR MACRO ANALYTIC
CO-HOSTS
John Rubino's Just Released Book
![]()
Charles Hugh Smith's Latest Books
![]()
![]()
Our Macro Watch Partner
Richard Duncan Latest Books
MACRO ANALYTIC
GUESTS
F William Engdahl

![]()
![]()

![]()

![]()

![]()
OTHERS OF NOTE
![]()
![]()
![]()


![]()
Book Review- Five Thumbs Up
for Steve Greenhut's
Plunder!
![]()
|
Have your own site? Offer free content to your visitors with TRIGGER$ Public Edition!
Sell TRIGGER$ from your site and grow a monthly recurring income!
Contact [email protected] for more information - (free ad space for participating affiliates).
HOTTEST TIPPING POINTS |
Theme Groupings |
||||
We post throughout the day as we do our Investment Research for: LONGWave - UnderTheLens - Macro
|
|||||
|
MOST CRITICAL TIPPING POINT ARTICLES TODAY
|
|
||||
TIPPING POINTS, STUDIES, THESIS, THEMES & SII COVERAGE THIS WEEK PREVIOUSLY POSTED - (BELOW)
|
|||||
| MOST CRITICAL TIPPING POINT ARTICLES THIS WEEK - Mar 13th, 2016 to Mar 19th, 2016 | |||||
| TIPPING POINTS - This Week - Normally a Tuesday Focus | |||||
| BOND BUBBLE | 1 | ||||
| RISK REVERSAL - WOULD BE MARKED BY: Slowing Momentum, Weakening Earnings, Falling Estimates | 2 | ||||
| GEO-POLITICAL EVENT | 3 | ||||
| CHINA BUBBLE | 4 | ||||
| JAPAN - DEBT DEFLATION | 5 | ||||
EU BANKING CRISIS |
6 |
||||
Chronic Unemployment |
9 |
||||
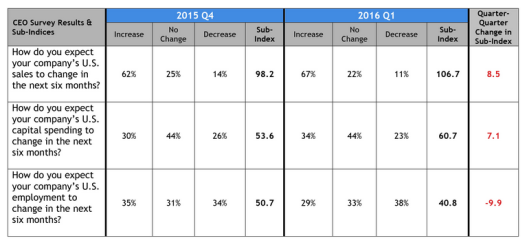
38% of Companies to Reduce Employment in 2016,Only 29% Expect Increase: Five Consequences
Is the part-time hiring binge that has inflated job numbers for at least two years about to come to an end? I think so. More importantly, so do CEOs of large corporations. In December, a quarterly survey of large corporation CEOs showed a minuscule net of 1% (35% to 34%) of corporations expected an increase in hiring. 31% expected no change. The latest quarterly survey shows nearly 10% (29% to 38%) of large corporation CEOs expect to reduce headcount. The remaining 33% expect no change. CEO Economic Survey Details Let’s dive into the Business Roundtable First Quarter 2016 CEO Economic Outlook Survey for more details. Key Survey Results
Mixed Bag?
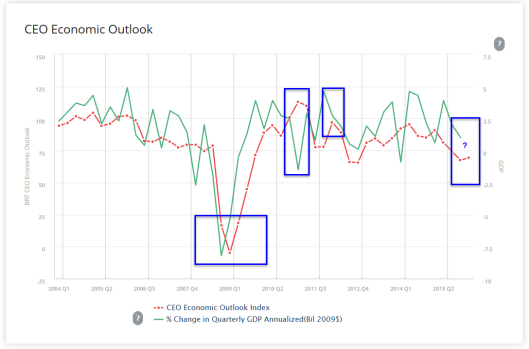
Mixed Bag Not Is that an ominous report or a mixed bag? On the surface one can make a claim either way. The business outlook is up huge as are capital spending expectations. However, CEOs are clueless about where the economy is headed. CEO Outlook
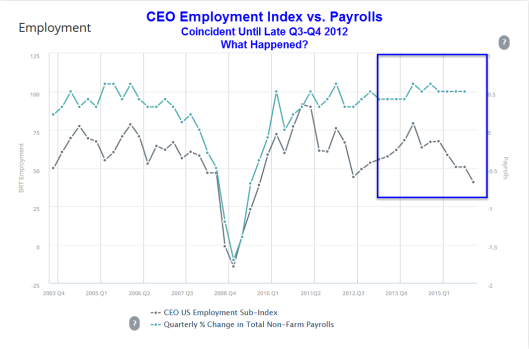
Notice the perpetually lagging nature of the CEO Economic Outlook. GDP is a lagging indicator. The aggregate CEOs’ economic outlook is even more lagging. That’s quite a pathetic under-performance. Jobs are also a lagging indicator. Battle of Lagging Indicators
In the battle of lagging indicators, results show the CEO hiring index was amazingly coincident with nonfarm payrolls from 2003 until late 2012. What happened? Obamacare!
Five Consequences
If you want a bonus sixth consequence, please add rising anger over the “Broken Social Contract“. |
|||||
15 - Commercial Real Estate |
15 |
||||
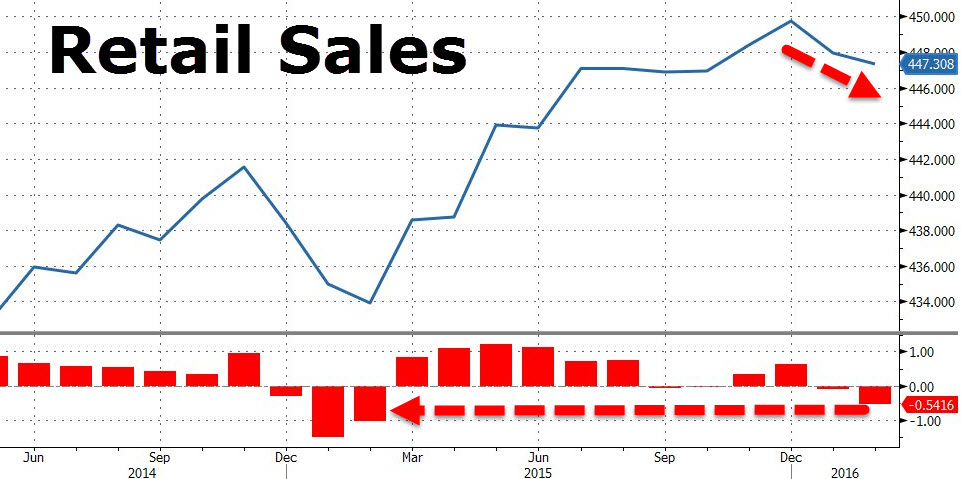
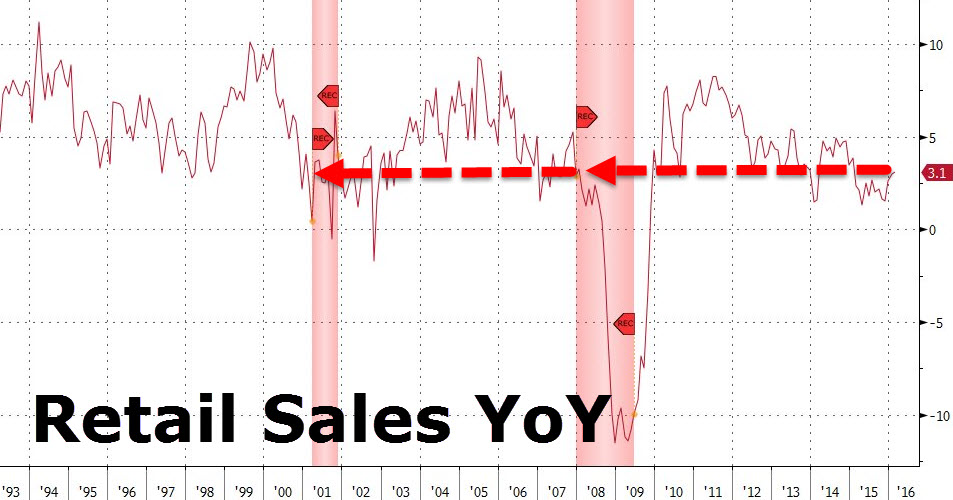
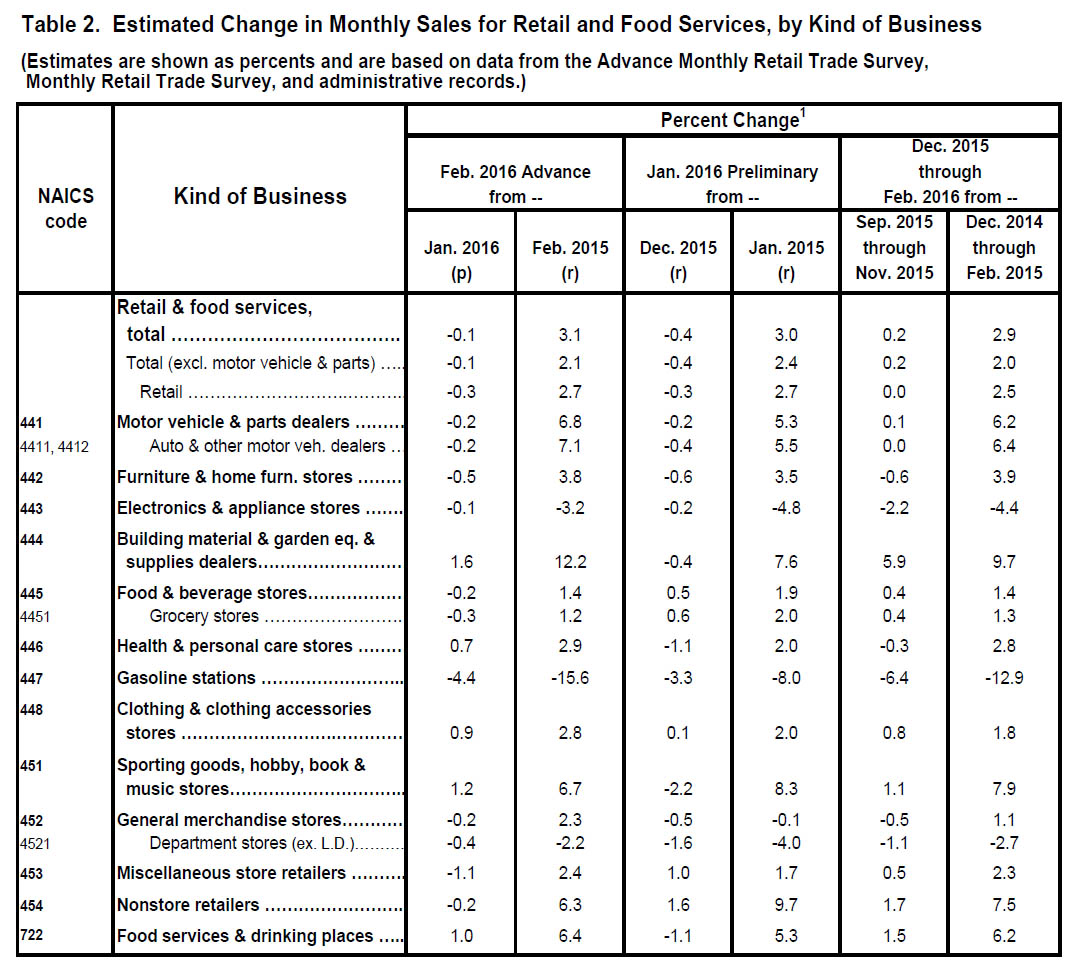
Retail Sales Suffer Biggest 2-Month Drop In A Year After Huge Negative RevisionThanks to dramatic downward revisions (from "resilient" historical data which we pointed out were entirely anomalous at the time and due entirely to seasonal adjustments) retail sales have dropped 0.54% in the last two months - the biggest sequential drop in a year. While the YoY change rose from +3.0% to +3.1%, it remains below historically-recessionary levels and given the revisions suggests Q1 GDP growth markdowns are on their way with sales down MoM for every cohort from gas stations to furniture. Retail Sales down most in a year:
And YoY changes still at weak recessionary levels...
And the breakdown shows sales dropped across the board, with all the key segments, including the all important online sales, posting sequential declines:
|
|||||
| TO TOP | |||||
| MACRO News Items of Importance - This Week | |||||
GLOBAL MACRO REPORTS & ANALYSIS |
|||||
US ECONOMIC REPORTS & ANALYSIS |
|||||
| CENTRAL BANKING MONETARY POLICIES, ACTIONS & ACTIVITIES | |||||
| Market - WEDNESDAY STUDIES | |||||
| STUDIES - MACRO pdf | |||||
TECHNICALS & MARKET |
|
||||
TECHNICALS & MARKET |
03-06-16 |
||||
The Biggest Threat To The S&P In The Next Month: "Only Buyer Keeping This Market Alive" Stops BuyingEven Bloomberg gets it. In a note issued yesterday, the news behemoth reported what our readers had known for years: that "There's Only One Buyer Keeping S&P 500's Bull Market Alive", namely corporate buybacks, the same "buyer" of stocks that the smart money has been selling to for the past 7 weeks. Dispelling any confusion about who the relentless buyer into the "wall of worry" is, this is what Bloomberg wrote:
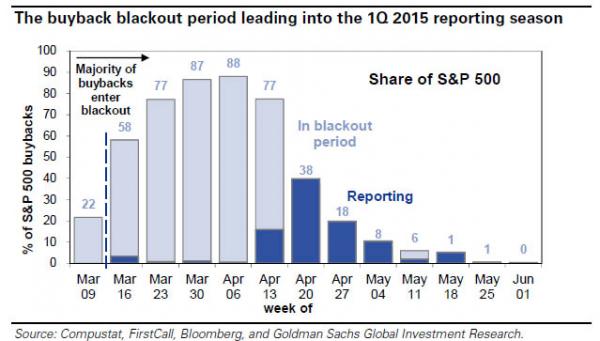
We got the latest confirmation of this earlier today when Bank of America said that "clients don’t believe the rally, continue to sell US stocks" to the only buyer left in town: "buybacks by corporate clients accelerated for the third consecutive week to their highest level in six months, which is also above levels at this time last year. This suggests that overall S&P 500 completed buybacks—which are reported with a lag—have likely picked up significantly as well." This also explains why the ECB was so desperate to unclog, and explicitly backstop with its QE expansion, the suddenly slowing corporate bond market: without a fresh influx of new IG issuance, the buyback pipeline would be indefinitely halted, which in turn would have led to more stock selling without offsetting repurchases, further downside to credit, and so on in a feedback loop that would have required a forceful intervention by central banks. However, while buybacks have been raging for the past three months, there is a very real and imminent danger to the market torpid bear market rally, when the first quarter earnings season begins over the next few days and brings with it the infamous buyback "blackout period." Recall what we said almost exactly one year ago, citing Goldman:
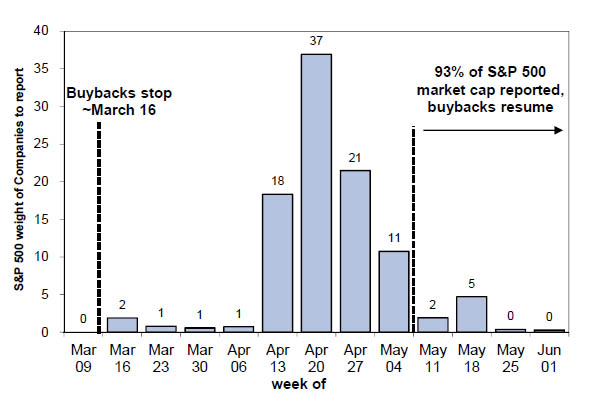
Indeed, over the past 4 quarters, the buyback blackout has without fail led to weakness across risky asset classes. So with the start imminent, how long is the lack of price indescriminate buying expected to persist? At least until the first week of May when the buybacks resume:
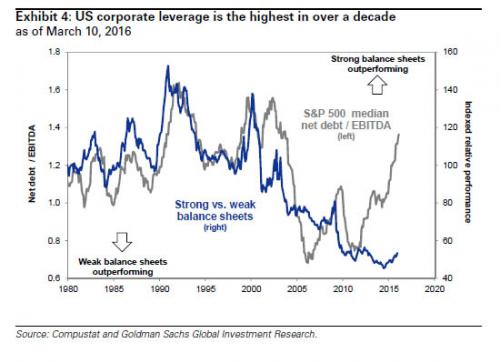
So while everyone's attention is on the Fed, the biggest danger to the S&P500 has little to do with what Janet Yellen may say tomorrow, and everything to do with the marginal buyer of stocks being put into a state of forced hibernation: after all, corporations would want nothing more than to continue the rally without pause, as a surging S&P 500 would make it even easier to issue more debt, which in turn would be used to fund even more buybacks, push their stocks even higher, and lead to even greater "equity-linked" bonuses and compensation. What is curious, however, is that unlike a year ago, when Goldman was pitching its "basket of US stocks focused on returning cash to shareholders via buybacks and dividends", this time Kostin and Co. are far more reserved, and instead urging clients to shun these companies which are largely drowning in debt as per the chart below, showing the highest corporate leverage in over a decade...
... and instead to buy companies with "strong balance sheets" which by definition are those who dedicate far less debt to pushing their stock price higher via such artificial and unsustainable gimmicks such as buybacks. Will this time Goldman be right, or will the trade once again be to buy the more beaten down names over the next month, those whose buybacks are "brutally" put on hold, only to return with a vengeance come May? We'll find out in 6 weeks; in the meantime, beware the S&P 500 Ides of March starting today, and lasting until Q1 earnings season is over.
|
|||||
| COMMODITY CORNER - AGRI-COMPLEX | |||||
| THESIS - Mondays Posts on Financial Repression & Posts on Thursday as Key Updates Occur | |||||
|
2016 | THESIS 2016 |  |
||
| 2015 - FIDUCIARY FAILURE | 2015 | THESIS 2015 |  |
||
| 2014 - GLOBALIZATION TRAP | 2014 |  |
|||
 |
|||||
|
2013 2014 |
 |
||||
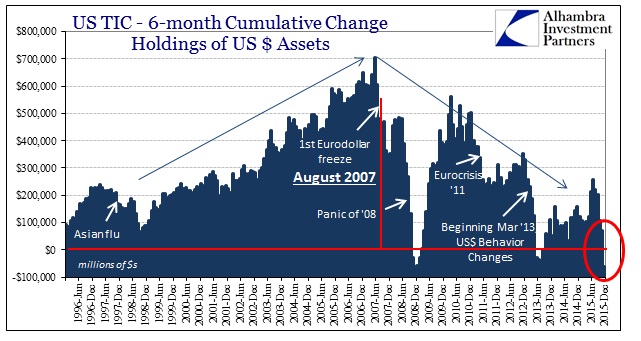
Jeffrey Snider: US$ STRENGTH IS A MANIFESTATION OF A US$ SHORTAGEFRA Co-Founder Gordon T.Long and Jeffrey Snider, Head of Global Investment Research at Alhambra Investment Partners discuss a broad array of Global Macro subjects in this 48 minute video discussion with supporting slides. As Head of Global Investment Research for Alhambra Investment Partners, Jeff spearheads the investment research efforts while providing close contact to Alhambra’s client base. Jeff joined Atlantic Capital Management, Inc., in Buffalo, NY, as an intern while completing studies at Canisius College. After graduating in 1996 with a Bachelor’s degree in Finance, Jeff took over the operations of that firm while adding to the portfolio management and stock research process. In 2000, Jeff moved to West Palm Beach to join Tom Nolan with Atlantic Capital Management of Florida, Inc. During the early part of the 2000′s he began to develop the research capability that ACM is known for. As part of the portfolio management team, Jeff was an integral part in growing ACM and building the comprehensive research/management services, and then turning that investment research into outstanding investment performance. As part of that research effort, Jeff authored and published numerous in-depth investment reports that ran contrary to established opinion. In the nearly year and a half run-up to the panic in 2008, Jeff analyzed and reported on the deteriorating state of the economy and markets. In early 2009, while conventional wisdom focused on near-perpetual gloom, his next series of reports provided insight into the formative ending process of the economic contraction and a comprehensive review of factors that were leading to the market’s resurrection. In 2012, after the merger between ACM and Alhambra Investment Partners, Jeff came on board Alhambra as Head of Global Investment Research. Jeff holds a FINRA Series 65 Investment Advisor License. US TIC REPORT, TREASURY SALES
TIC is a compilation done by the US Treasury based on their access to data on foreign accounts and holdings of Dollar accounts and securities, and estimates the foreign Dollar market. Over the last decade or so, it is clear that the Eurodollar market grew steadily at a rapid rate until about August 2007, at which point it pivots and comes back down. The TIC data shows the tendency of dollar markets to essentially be stable, usually addressed through selling Treasury. However, the private dollar markets offshore are in disarray to the extent that central banks around the world are forced to fill the dollar deficiency with their own holdings. Of especial note is China’s reduction of their US Treasuries and foreign currency reserves, and OPEC countries incurring serious Current Account deficits in an attempt to maintain their pegs with the US dollar. In addition are the emerging markets who borrowed about $7-9T in USD, who now have difficulty paying back debts due to slowing trade and falling currencies. This all leads to the US dollar strengthening, which is the manifestation of the dollar shortage. In recent days, Japan using NIRP will further disrupt the dollar system. “US Dollar Strength is a manifestation of a US Dollar Shortage!” JAPAN: QE FAILURE AND WHAT NIRP MEANS
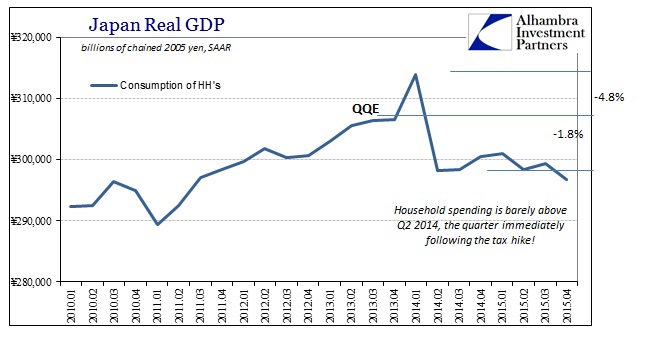
Under QE, Japan obtained a burst of inflation around 2014. Instead of leading to sustained economic activity, household income and spending dropped about 7%, which was also not offset by growth in GDP and demand. The surge in expansion, due to cheaper money, increases supply which then demolishes pricing power. In addition to the reduced value of savings, large companies have also shifted production offshore, thus increasing the effect and emphasizing the failure of QE/QQE to stimulate the economy. NIRP also carries with it the threat of failing like QE, along with numerous other particle effects that cannot be currently measured or predicted, mostly as this type of system has not existed for over a hundred years. This is an indicator of the lack of power central banks have over the economy, but can be put down to overemphasizing the value of monetary policy over fiscal policy in the developed world. The dollar system has been artificially expanded past any control by banks and monetary policy, globally, over the last decade. The only way to stop it is to focus on other fiscal factors that would allow economic potential to be realized again and to refrain from following Keynesian economics once it has been proven to be ineffective. “Japan is a test case in almost clinical conditions for QE and QQE, and it failed on every count.” CHINA: COLLAPSING TRADE AND CREDIT
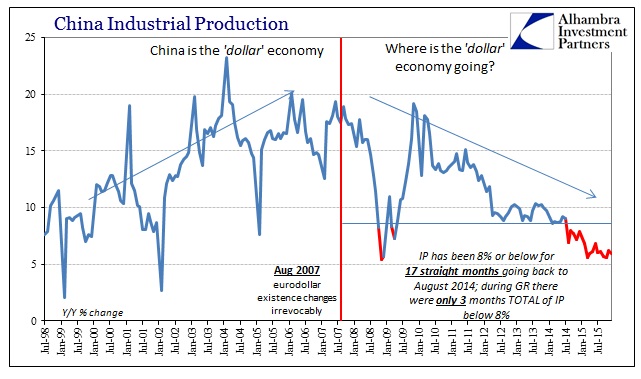
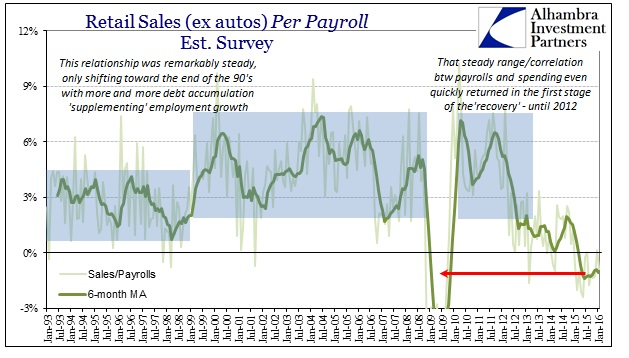
China is both an impediment to growth and a casualty of the rest of the world, but recently more of a reflection of the global dollar economy as they are most sensitive to changes there. The lack of growth over several years forces a fundamental shift toward a Keynesian response of fiscal and monetary stimulation that creates asset buffers at odds with overcapacity. Meanwhile, China still lacks any real method for economic growth and is forced to react to outside influences while juggling the problem of overcapacity with the falling export industry. This then leads to capital flight, which furthers the struggle to grow GDP. China is clearly attempting to manage the Yuan by selling dollars to strengthen it, but will eventually falter like any pegged currency. Many currencies pegged to the US dollar, Eurodollar, and Petro dollar will likely collapse. Keynesian economists believed that 2007 was the beginning of a temporary deviation from sustainable global growth, but was in fact the structural revaluation of higher economics of the financial system. We are likely headed for a systemic reset and reorientation, which will be disruptive with significant risk but can be adapted to. “I think we are headed for a systemic reset.” RETAIL: JANUARY SALES AND CONTINUING TREND
Retail sales have been near recession levels of low, indicating that consumers are under pressure, but inventories are still rising despite manufacturers cutting back. Retail slowing is a fixed trend starting from 2012, amplified in 2014-2015 with the disappearance of the manufacturing industry and loss of export goods. This is likely due to lack of real recovery that slowly eroded US consumers’ ability to continuously expand their activity. The middle class has no savings, so thus the capitalist system that relies on savings to reinvest into productivity. Over the last several years, companies have been spending on buybacks instead of investing in productive capacity. 1900 of the S&P companies spent more on buybacks and dividends than they were earning, thus creating more debt. “Recession is a necessary process, like anything else. It’s creative destruction.” LABOR: FULL EMPLOYMENT – NOT REALLY!
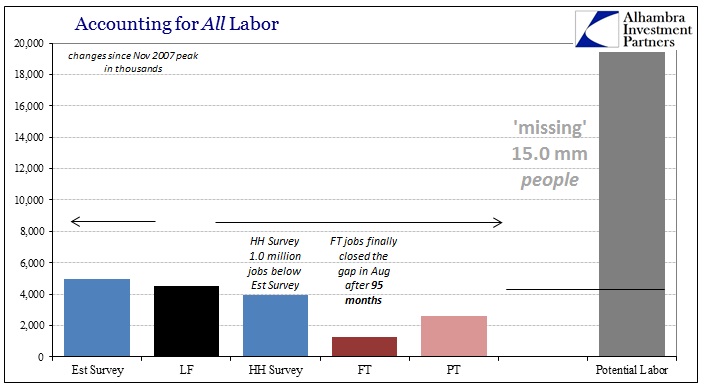
There is a major disconnect between major unemployment statistics and the rest of the economy, where even having a job is not necessarily enough to support the expected standard of living. There are low prospects for growth in the job market, and people sense that there is a need for a restructuring of the system. Job growth is mostly in low income occupations, which results in potential workers entering college with a loan but failing to actually enter the labour force. The current economic state is similar to the suppressed state of the 1930’s and 1940’s, and once the systemic reset is allowed to occur, the economic potential released will be tremendous. Recessions are necessary to allow risk to be properly priced, which in turn creates confidence in investment. The resulting reset should shift away from one centered around banks and the value of credit toward a capitalist system that prioritizes “money is money” over “money is credit”. “Monetary policy is designed for companies to borrow more; it’s just that economists expected they’d borrow more for productive capacity rather than financial capacity.” Abstract by: Annie Zhoua: [email protected] Video Editing by: Minjung Kim: [email protected]
|
|||||
2011 2012 2013 2014 |
 |
||||
| THEMES - Normally a Thursday "Themes" Post & a Friday "Flows" Post | |||||
I - POLITICAL |
|||||
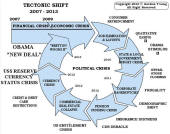
CENTRAL PLANNING - SHIFTING ECONOMIC POWER - STATISM
MACRO MAP - EVOLVING ERA OF CENTRAL PLANNING
|
G | THEME | |||
| - - CRISIS OF TRUST - Era of Uncertainty | G | THEME | |||
CORRUPTION & MALFEASANCE - MORAL DECAY - DESPERATION - RESENTMENT. |
US | THEME PAGE |  |
||
| - - SECURITY-SURVEILLANCE COMPLEX - STATISM | G | THEME | |||
| - - CATALYSTS - FEAR (POLITICALLY) & GREED (FINANCIALLY) | G | THEME | |||
II-ECONOMIC |
|||||
| GLOBAL RISK | |||||
| - GLOBAL FINANCIAL IMBALANCE - FRAGILITY, COMPLEXITY & INSTABILITY | G | THEME | |||
| - - SOCIAL UNREST - INEQUALITY & A BROKEN SOCIAL CONTRACT | US | THEME | |||
| - - ECHO BOOM - PERIPHERAL PROBLEM | M | THEME | |||
| - -GLOBAL GROWTH & JOBS CRISIS | |||||
| - - - PRODUCTIVITY PARADOX - NATURE OF WORK | THEME | MA w/ CHS |
|||
| 01-08-16 | THEME | MA w/ CHS |
|||
| - - - STANDARD OF LIVING - EMPLOYMENT CRISIS, SUB-PRIME ECONOMY | US | THEME | MA w/ CHS |
||
III-FINANCIAL |
|||||
|
FLOWS - Capital, Liqudity & Credit Flows
|
MATA RISK ON-OFF |
THEME |
w/ R Duncan |
||
|
|||||
| CRACKUP BOOM - ASSET BUBBLE | 12-31-15 | THEME | |||
| SHADOW BANKING - LIQUIDITY / CREDIT ENGINE | M | THEME | |||
| GENERAL INTEREST |
|
||||
| STRATEGIC INVESTMENT INSIGHTS - Weekend Coverage | |||||
 |
|||||
|
SII | ||||
|
SII | ||||
|
SII | ||||
|
SII | ||||
Collapsing Contango Means Tankers Full Of Oil Such As This One, Will Soon Have To Unload Their Cargo“As we’ve seen both Brent and WTI climb above $40 we have also seen the contango collapse. If we rally too high the contango will collapse further and the storage economics reduce -- that could trigger storage in tanks to be reduced,” increasing supply and putting pressure back on crude prices.
|
03-19-16 | SII | |||
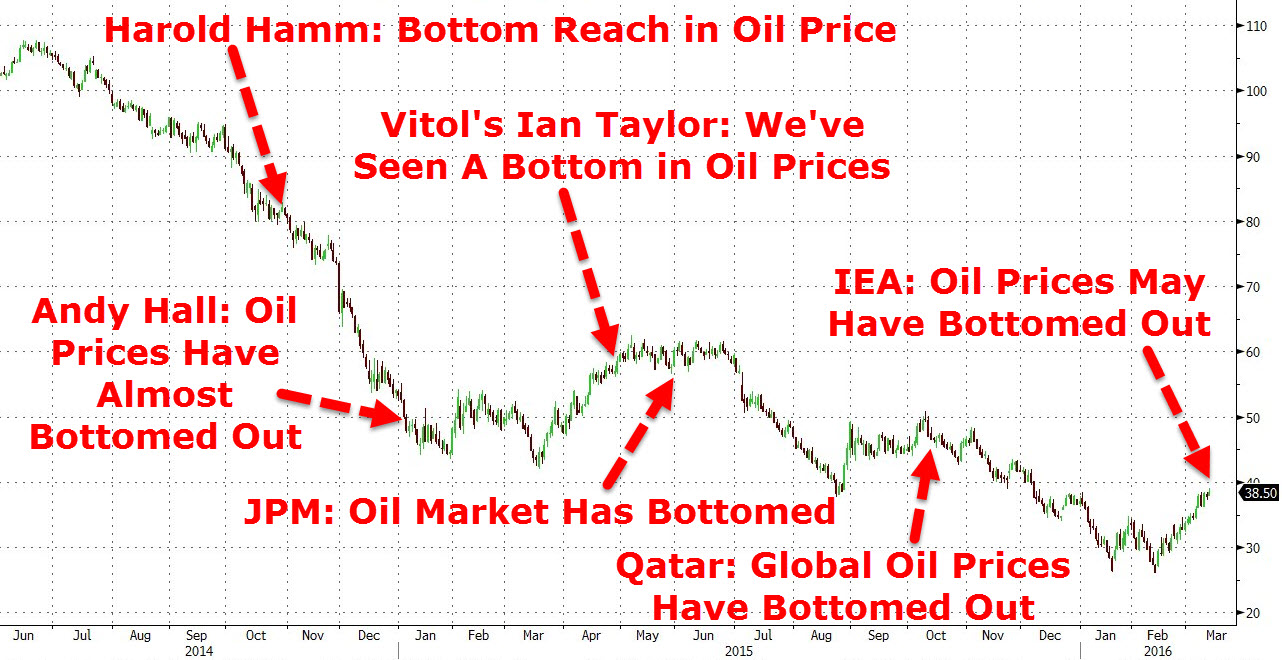
If at first you don't succeed, keep trying to call the bottom in oil prices. As Bloomberg writes, catching a falling knife is hard, especially when it’s covered in oil. The International Energy Agency today said oil prices may have bottomed out. Several people have tried to call the oil’s floor since prices started falling in the summer of 2014. So far nobody has been right.
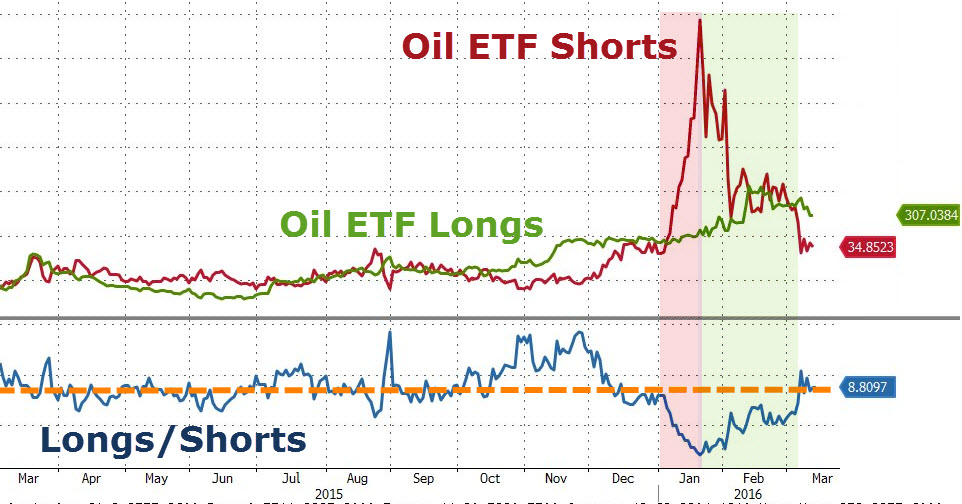
Of course it's different this time, this really is the bottom. Except, with ETF shorts having collapsed to "norms" the buyers of last resort will have their work cut out maintaining the dream with no one left to squeeze...
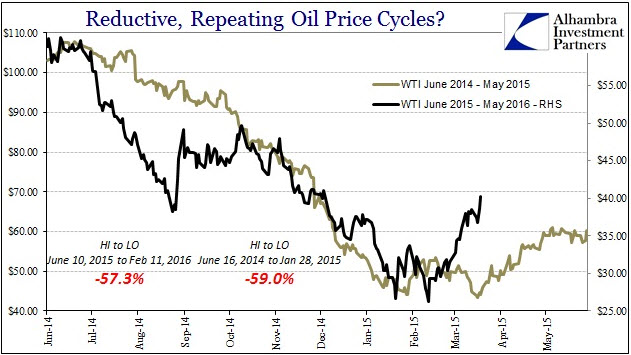
Submitted by Jeffrey Snider via Alhambra Investment Partners, From June 2014 until late January 2015, oil prices (WTI) fell about 60%. From June 2015 until late January 2016, oil prices (WTI) fell about 60%.
The exact track each annual trading history took to achieve those results is different (2014-15 much more straight ahead and persistent; 2015-16 jagged and irregular), but you can’t deny the repetition in both the amount of time and the ultimate scale of the collapse. To my personal view, such self-similarity (fractal) is funding and “dollar.” The rebound after the latest “dollar” run is so far more quick and intense, but it remains to be seen whether that will make any difference. Oil Prices Should Fall - Possibly HardOil prices should fall, possibly hard, in coming weeks. That is because fundamentals do not support the present price. Prices should fall to around $30 once the empty nature of an OPEC-plus-Russia production freeze is understood. A return to the grim reality of
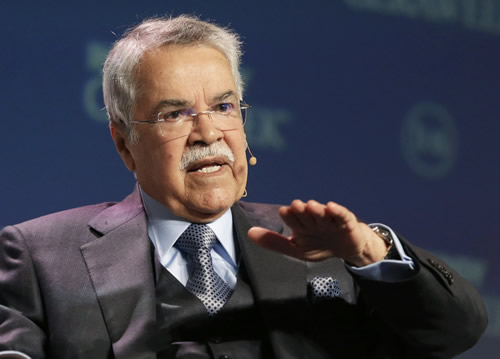
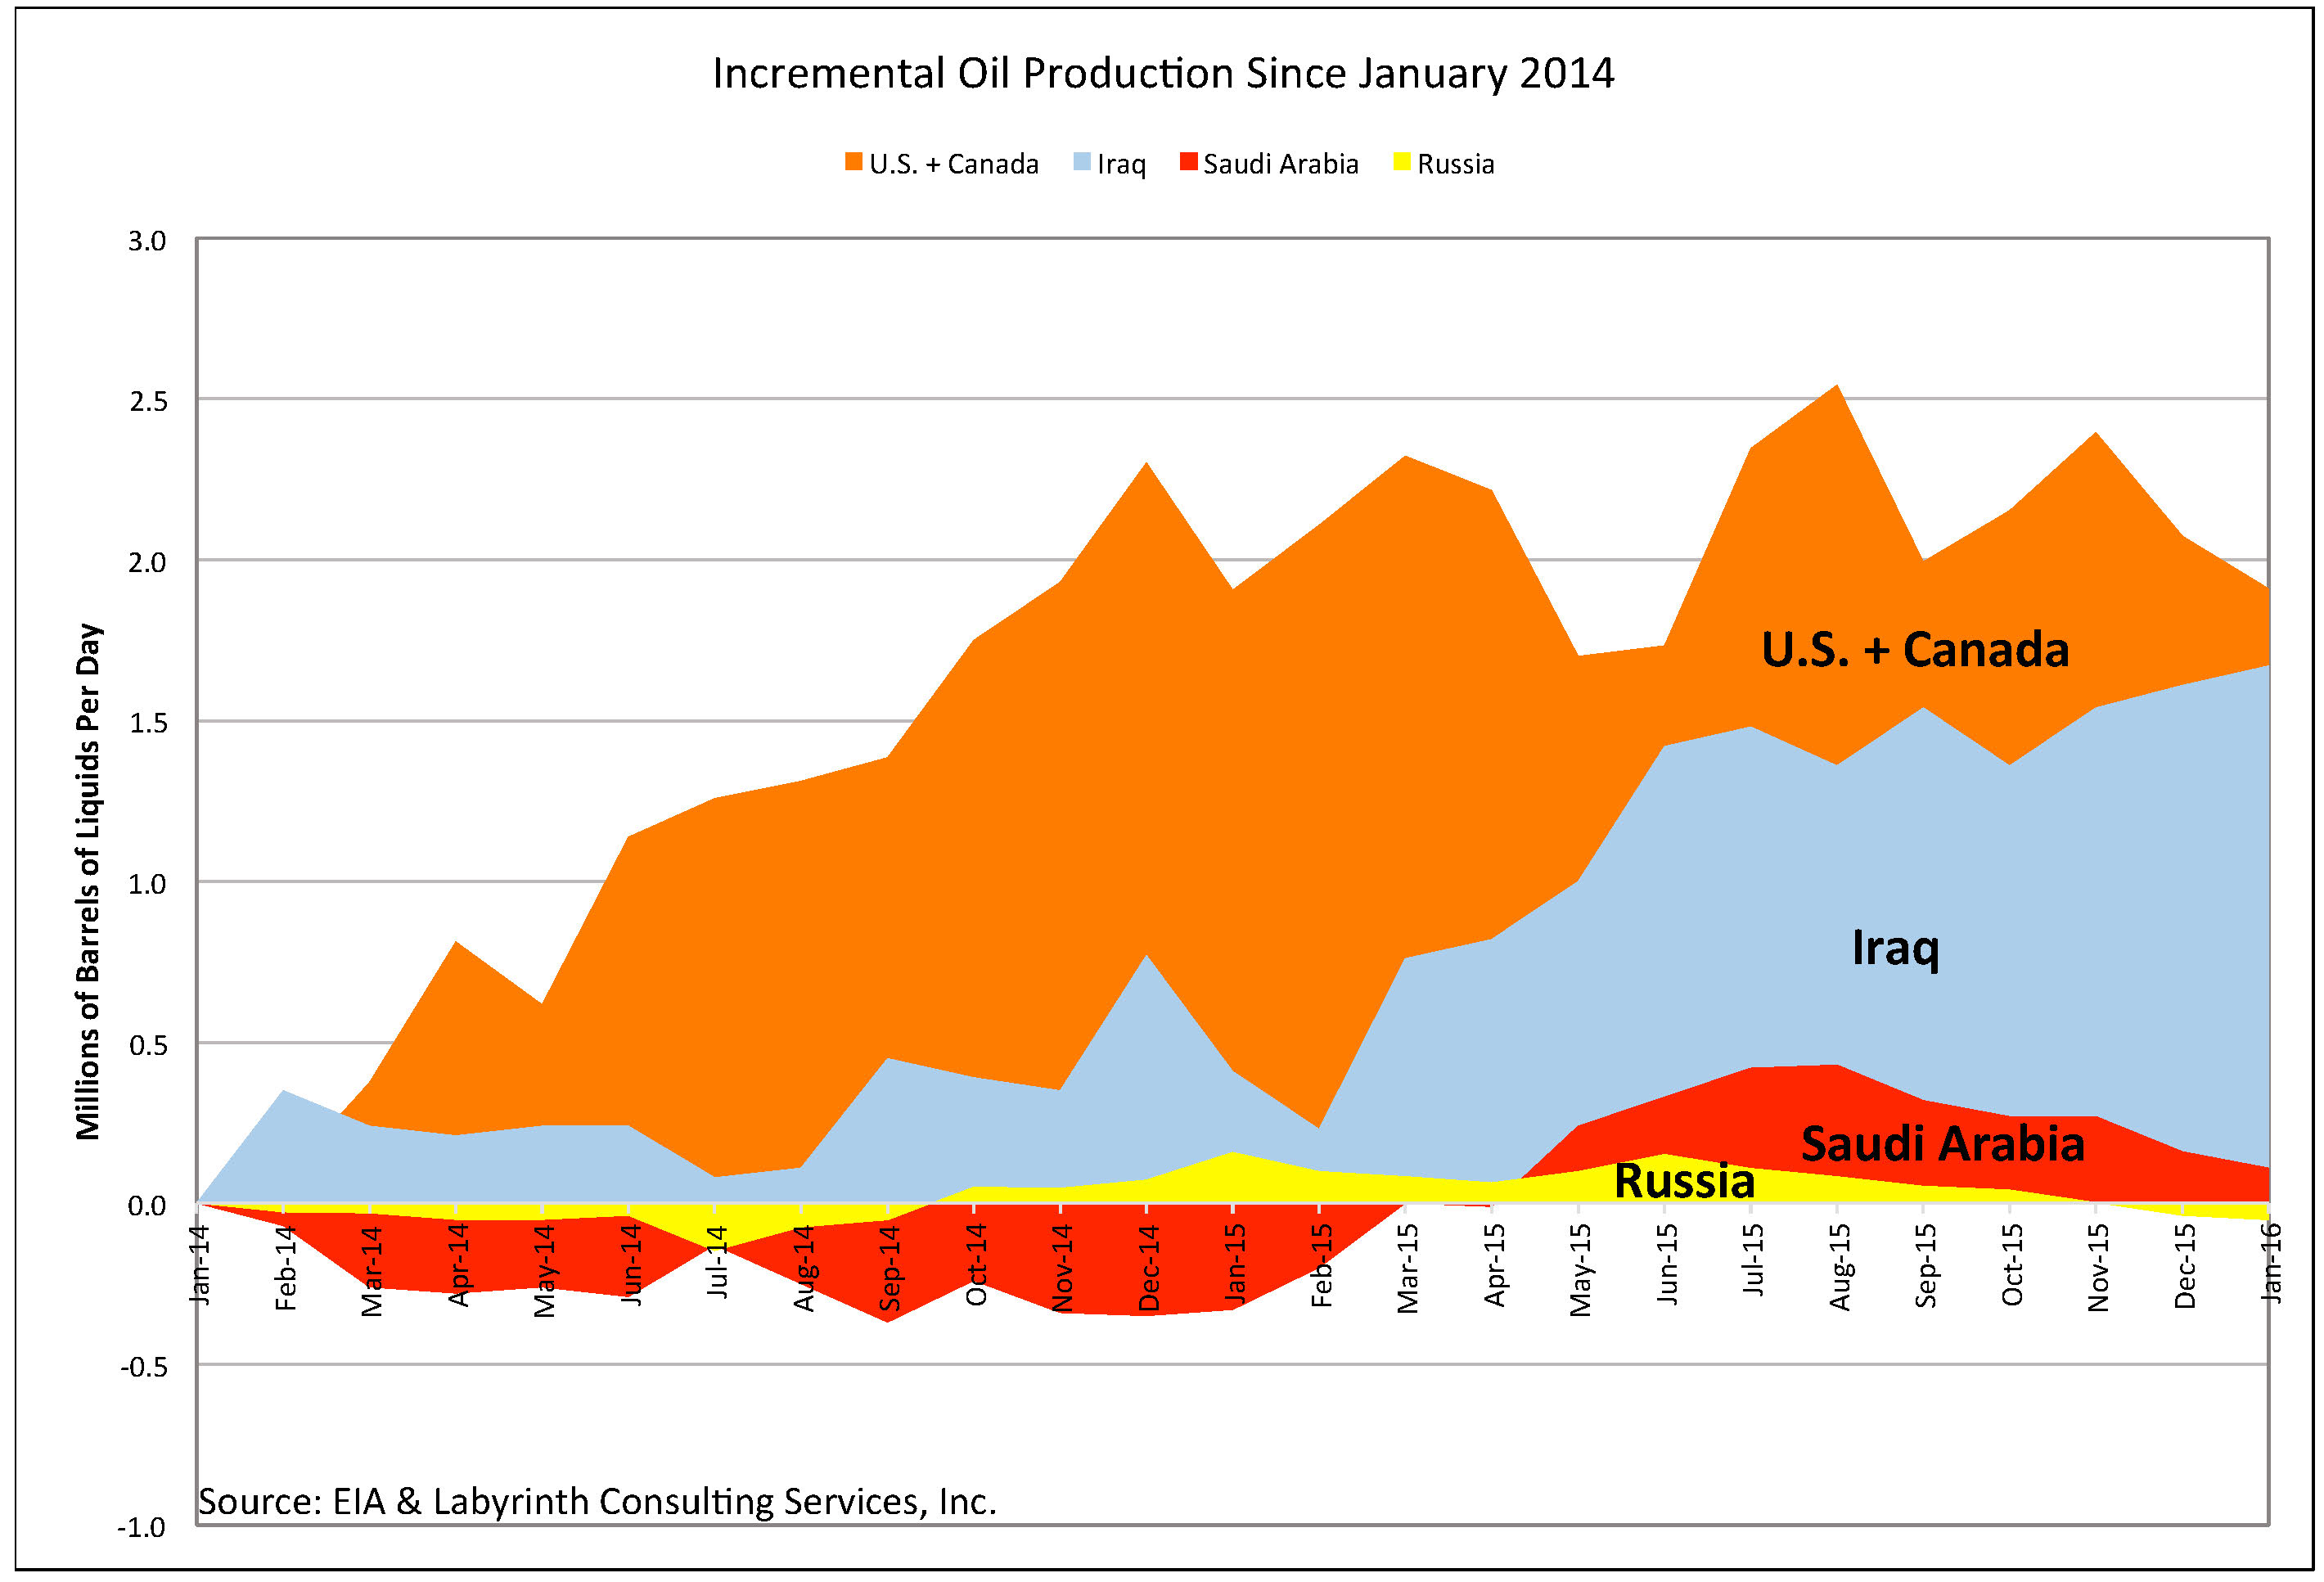
Saudi Arabia’s Minister of Petroleum & Mineral Resources Ali Al-Naimi speaks at the annual IHS CERAWeek global energy conference Tuesday, Feb. 23, 2016, in Houston. (AP Photo/Pat Sullivan) A Production Freeze Will Not Reduce The Supply Surplus An OPEC-plus-Russia production cut would be a great step toward re-establishing oil-market balance. I believe that will happen later in 2016 but is not on the table today. In late February, Saudi oil minister Ali Al-Naimi stated categorically, “There is no sense in wasting our time in seeking production cuts. That will not happen.” Instead, Russia and Saudi Arabia have apparently agreed to a production freeze. This is meaningless theater but it helped lift oil prices 37% from just more than $26 in mid-February to almost $36 per barrel last week. That is a lot of added revenue for Saudi Arabia and Russia but it will do nothing to balance the over-supplied world oil market. The problem is that neither Saudi Arabia nor Russia has greatly increased production since the oil-price collapse began in 2014 (Figure 1). A freeze by those countries, therefore, will only ensure that the supply surplus will not get worse because of them. It is, moreover, doubtful that Saudi Arabia or Russia have the spare capacity to increase production much beyond present levels making the proposal of a freeze cynical rather than helpful.
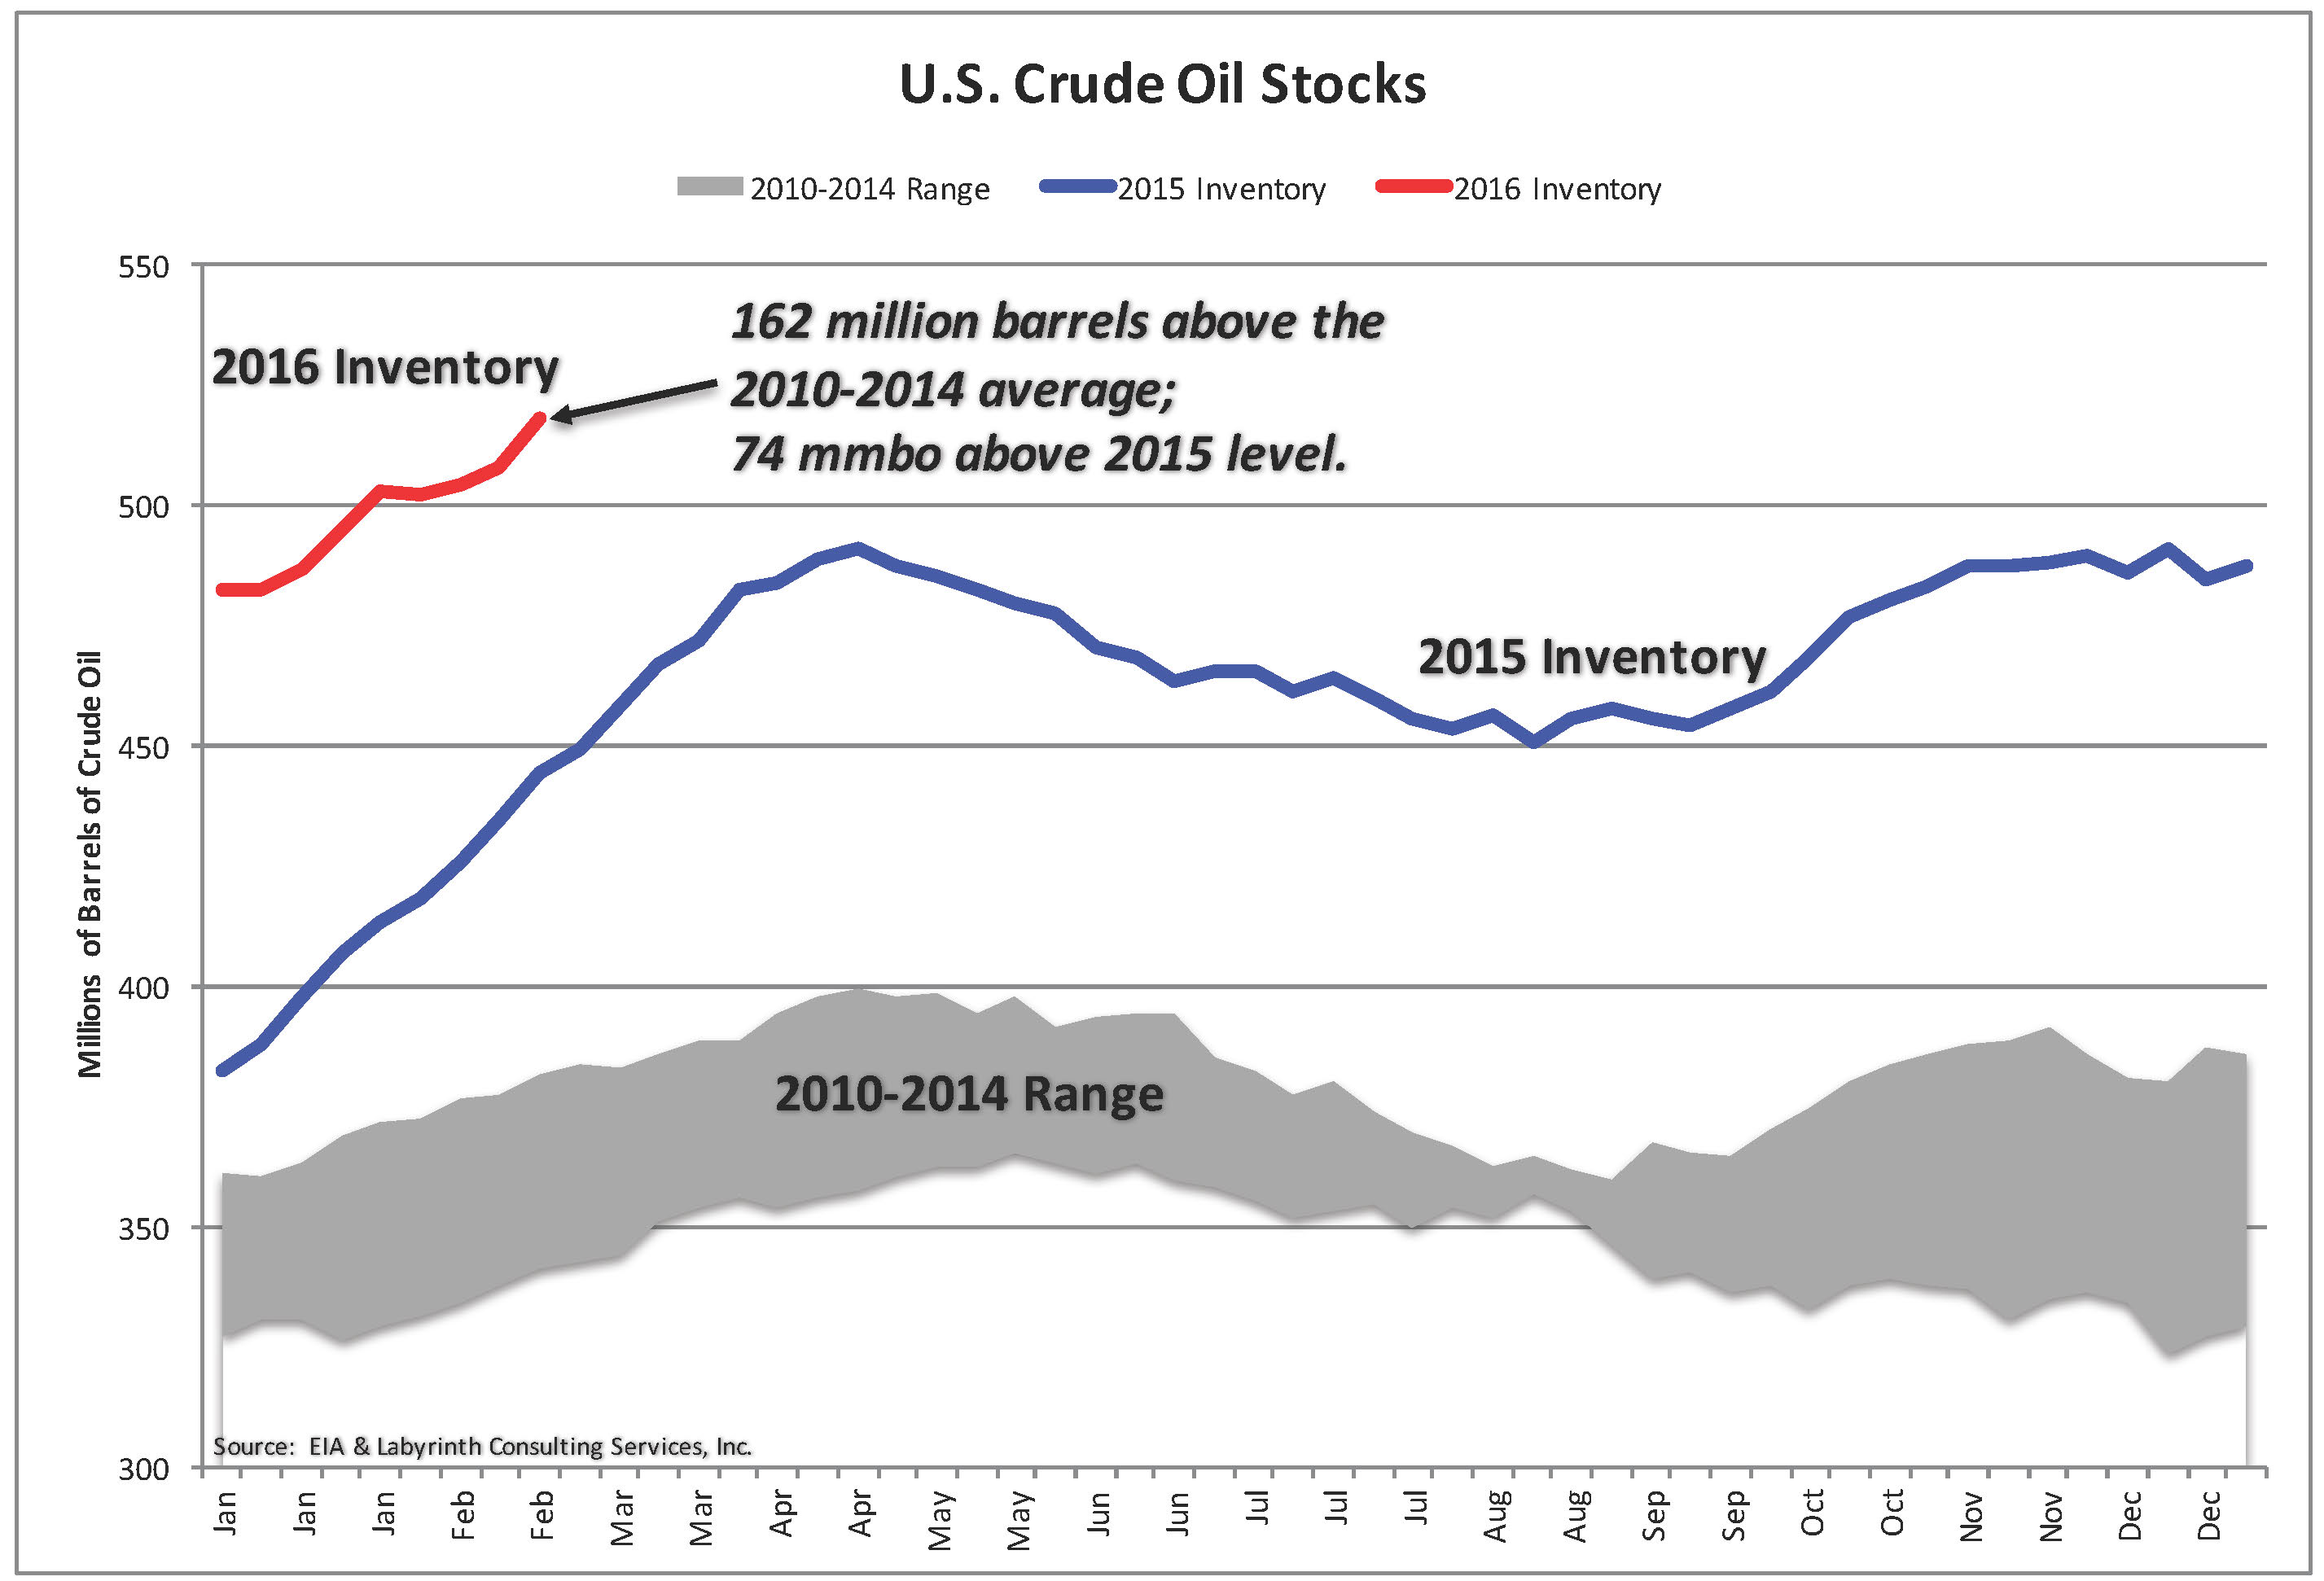
Figure 1. Incremental liquids production since January 2014 by the United States plus Canada, Iraq, Saudi Arabia and Russia. Source: EIA & Labyrinth Consulting Services, Inc. (click image to enlarge) Saudi Arabia and Russia are two of the world’s largest oil-producing countries. Yet in January 2016, Saudi liquids output was only ~110,000 bpd more than in January 2014 and Russia was actually producing ~50,000 bpd less than in January 2014. The present world production surplus is more than 2 mmbpd. By contrast, the U.S. plus Canada are producing ~1.9 mmbpd more than in January 2014 and Iraq’s crude oil production has increased ~1.7 mmbpd. Also, Iran has potential to increase its production by as much as ~1 mmbpd during 2016. Yet, none of these countries have agreed to the production freeze. Iran, in fact, called the idea “ridiculous.” Growing Storage Means Lower Oil Prices U.S. crude oil stocks increased by a remarkable 10.4 mmb in the week ending February 26, the largest addition since early April 2015. That brought inventories to an astonishing 162 mmb more than the 2010-2014 average and 74 mmb above the bloated levels of 2015 (Figure 2). Figure 2. U.S. crude oil stocks. Source: EIA and Labyrinth Consulting Services, Inc. (click image to enlarge) The correlation between U.S. crude oil stocks and world oil prices is strong. Tank farms at Cushing, Oklahoma (PADD 2) and storage facilities in the Gulf Coast region (PADD 3) account for almost 70% of total U.S. storage and are critical in WTI price formation. When storage exceeds about 80% of capacity, oil prices generally fall hard. Current Cushing storage is at 91% of capacity, the Gulf Coast is at 87% and combined, they are at a whopping 88% of capacity (Figure 3).
Figure 3. Cushing and Gulf Coast crude oil storage. Source: EIA and Labyrinth Consulting Services, Inc. (click image to enlarge) Prices have fallen hard in step with growing storage throughout 2015 and early 2016. Since talk of a production freeze first surfaced, however, intoxicated investors have ignored storage builds and traders are testing new thresholds before they fall again. The truth is that prices will not increase sustainably until storage volumes fall, and that cannot happen until U.S. production declines by about 1 mmbpd. Despite extreme reductions in rig count and catastrophic financial losses by E&P companies, production decline has been painfully slow. The latest data from EIA indicates that February 2016 production will fall approximately 100,000 bpd compared to January That is an improvement over the average 60,000 bpd monthly decline since the April 2015 peak. It is not enough, however, to make a difference in storage and storage controls price. EIA and IEA will publish updates this week on the world oil market balance and I doubt that the news will be very good. IEA indicated last month that the world over-supply had increased almost 750,000 bpd in the 4th quarter of 2015 compared with the previous quarter. EIA data corroborated those findings and showed that the surplus in January 2016 had increased 650,000 bpd from December 2015. Oil Prices and The Value of the Dollar Why, then, have oil prices increased?
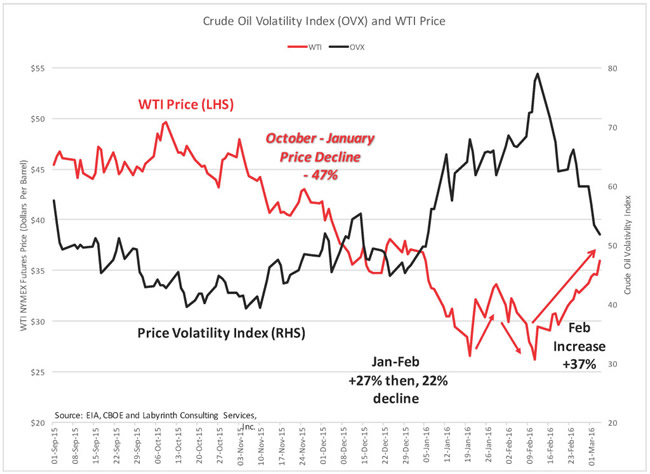
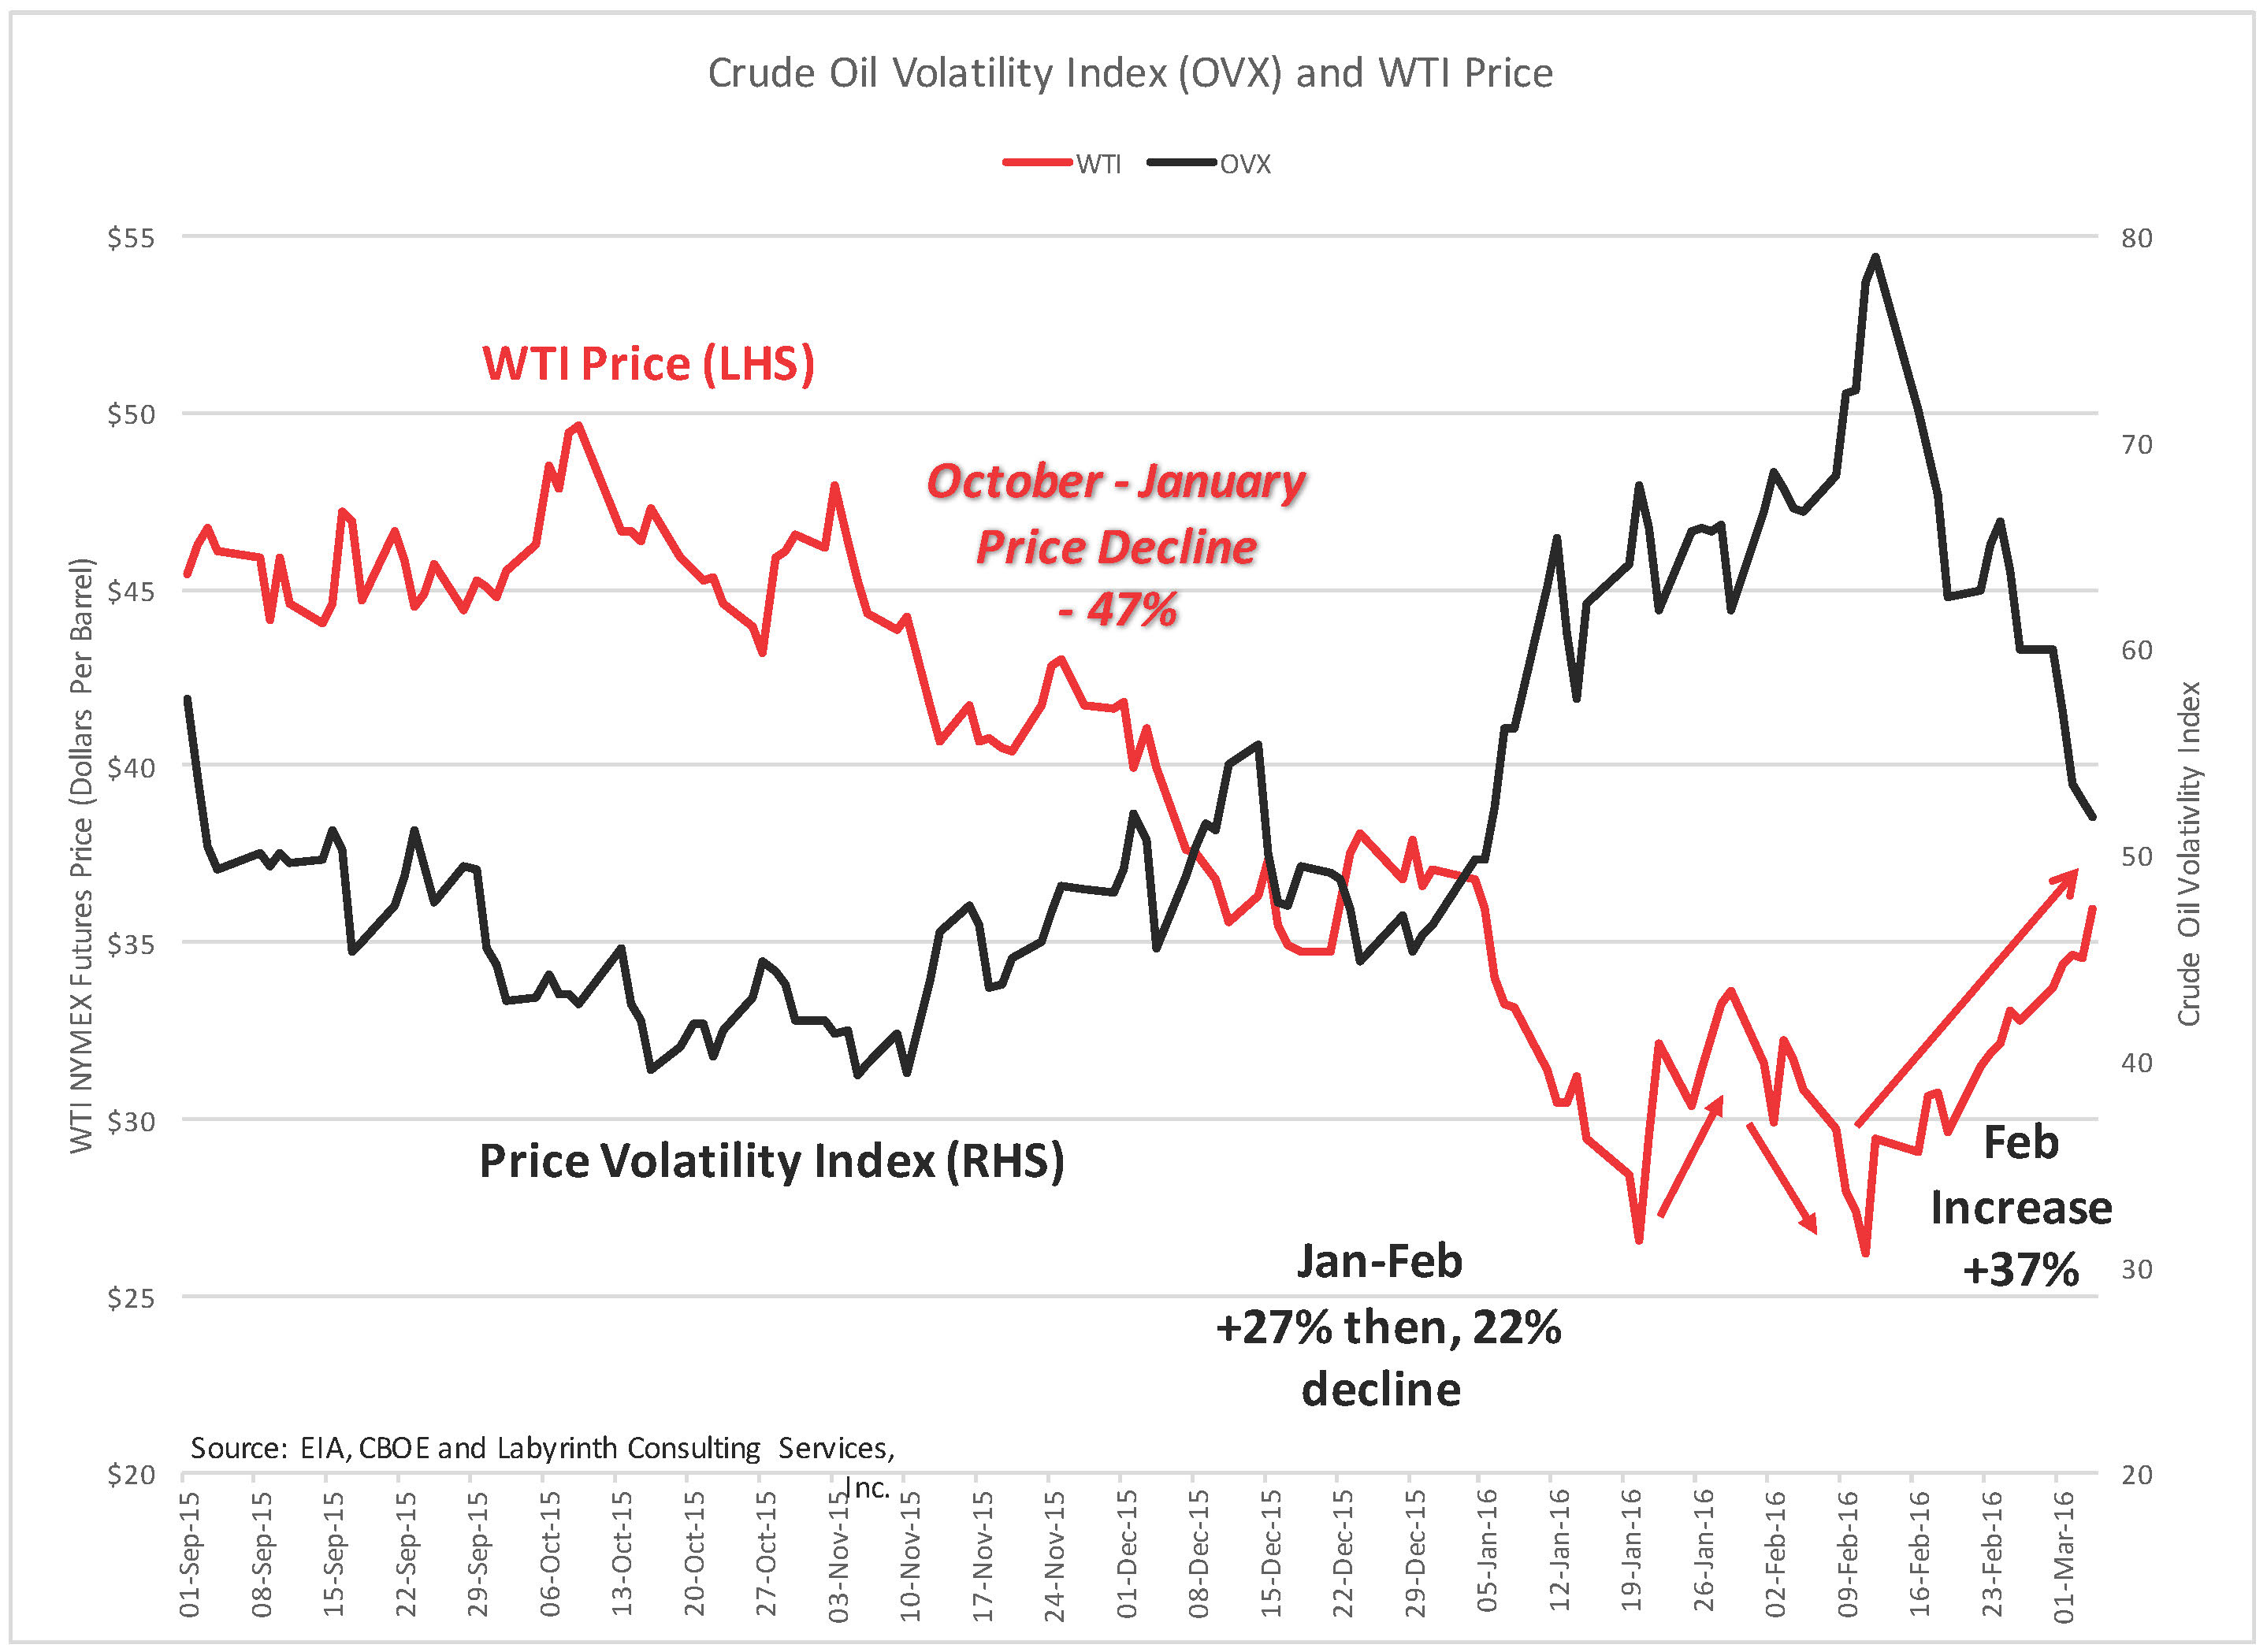
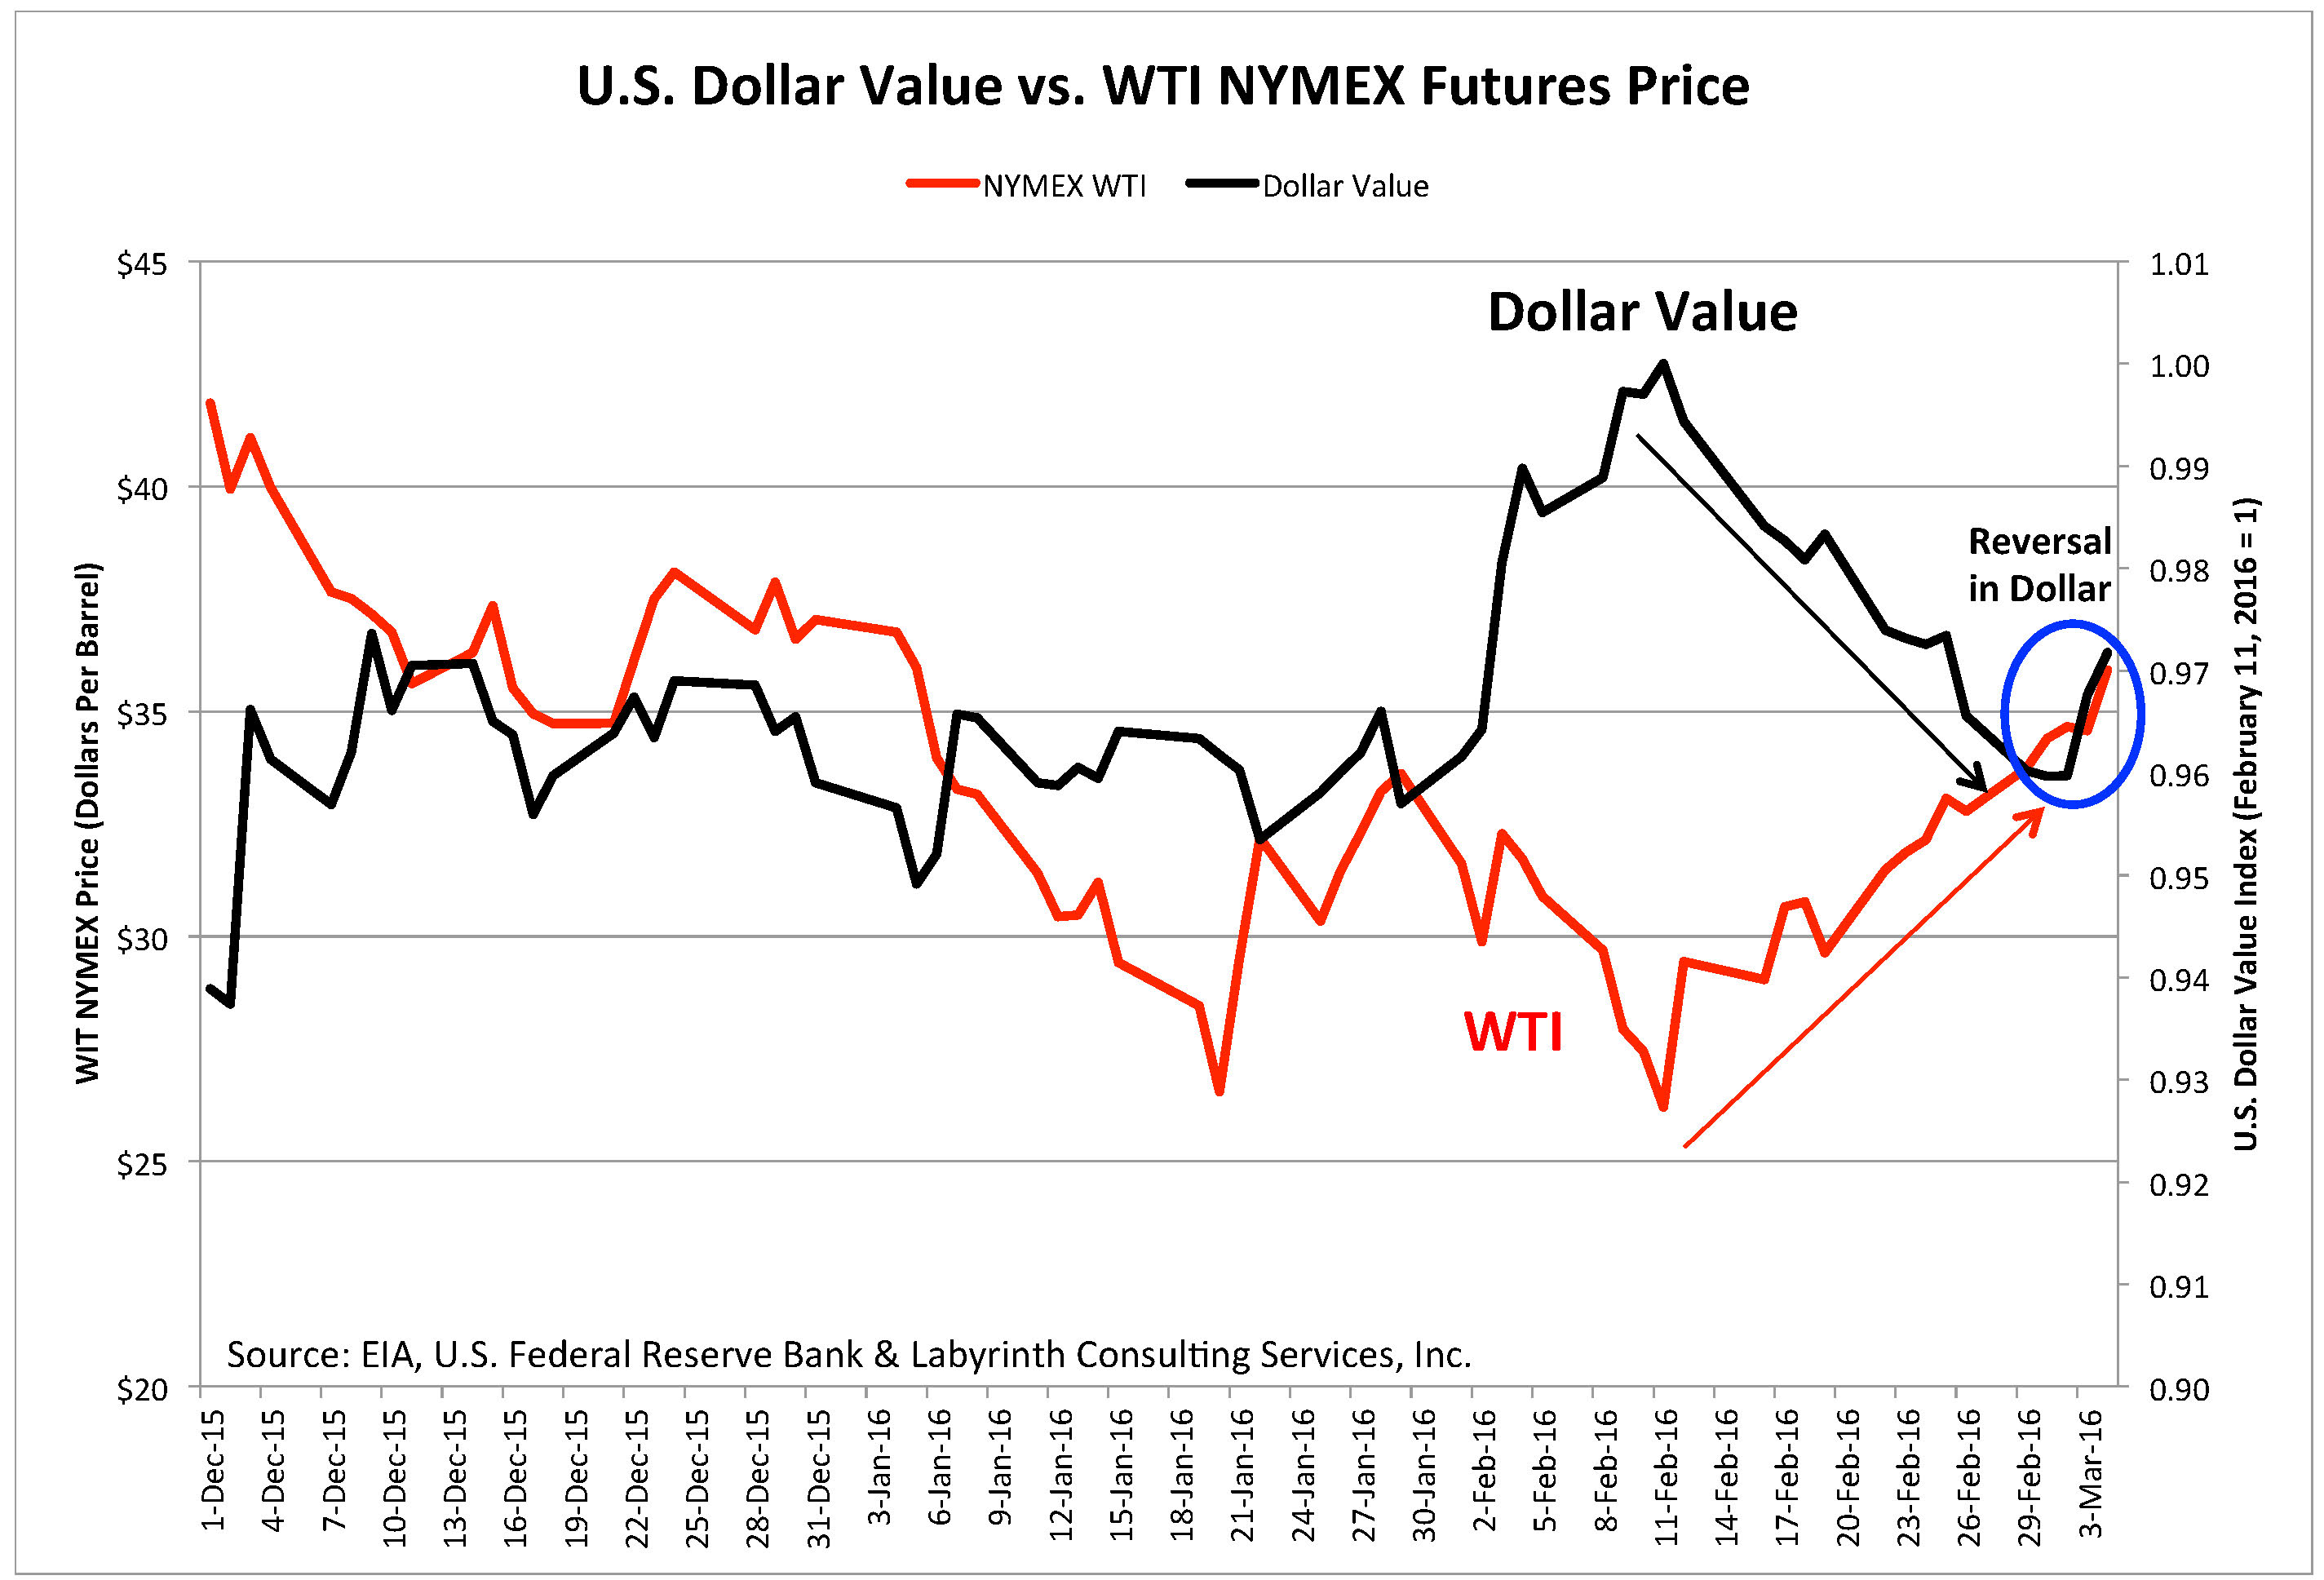
Figure 5. Crude oil volatility index (OVX) and WTI price. Source: EIA, CBOE and Labyrinth Consulting Services, Inc. (click image to enlarge) The OVX reflects how investors feel about where oil prices are going. It is sometimes called the “fear index.” That suggests that investors are feeling pretty good and less fearful about the oil markets than in the last quarter of 2015 when oil prices fell 47%. Since mid-February, prices have increased 37%. But there is more to it than just hope and that may be found in
Figure 6. U.S. Dollar value vs. WTI NYMEX futures price. Source: EIA, U.S. Federal Reserve Bank and Labyrinth Consulting Services, Inc. (click to enlarge) Now, that trend has reversed. The U.S. jobs report last week was positive so continued strength of the dollar is reasonable for awhile. Assuming the usual correlation, that means that oil prices should fall. Oil Prices Should Fall Hard It is a sign of how bad things have gotten in oil markets that we feel optimistic about $35 oil prices. It should also be a warning that the over-supply that got us here has not gone away. Oil storage volumes continue to grow and that is the surest indication that production has not declined enough yet to make a difference. It is impossible to imagine oil prices rising much beyond present levels until storage starts to fall. In fact, it is difficult to understand $35 per barrel prices based on any measure of oil-market fundamentals. The OPEC-plus-Russia production freeze is a cynical joke designed to increase their short-term revenues without doing anything about production levels. An output cut would make a difference but a freeze on current Saudi and Russian production levels means nothing. It apparently made some investors feel better but it didn’t do anything for me. Iran got this one right by calling it ridiculous. No terrible economic news has surfaced in recent weeks but that does not change the profound weakness of a global economy that is burdened with debt and weak demand. The announcement last week by the People’s Bank of China that it sees room for more quantitative easing may have comforted stock markets but it only added to my anxiety about reduced oil consumption and future downward shocks in oil prices. I hope that oil prices increase but cannot find any substantive reason why they should do anything but fall. As market balance reality re-emerges in investor consciousness and the false euphoria of a production freeze recedes, prices should correct to around $30. A little bad economic or political news could send prices much lower. |
|||||
| TO TOP | |||||


Read More - OUR RESEARCH - Articles Below

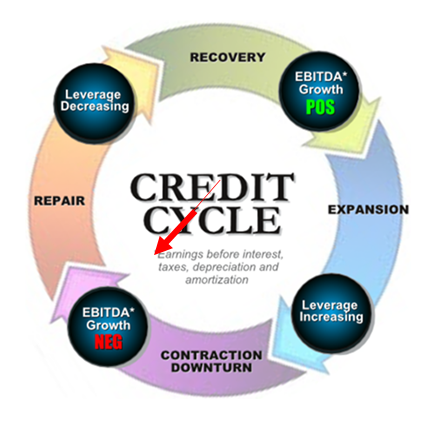
Tipping Points Life Cycle - Explained
Click on image to enlarge
TO TOP
 |
YOUR SOURCE FOR THE LATEST THINKING & RESEARCH
|
�
TO TOP