|
JOHN RUBINO'SLATEST BOOK |
||||||||||||||||||||||||||||||||||||||||||||||||||||||||||||||||||||||||||||||||||||||||||||||||||||||||||||||||||||||||||||||||||||||||||||||||||||||||||||||||||||||||||||||||||||||||||||||||||||||||||||||||||||||||||||||||||||||||||||
"MELT-UP MONITOR "
Meltup Monitor: FLOWS - The Currency Cartel Carry Cycle - 09 Dec 2013 Meltup Monitor: FLOWS - Liquidity, Credit & Debt - 04 Dec 2013 Meltup Monitor: Euro Pressure Going Critical - 28- Nov 2013 Meltup Monitor: A Regression-to-the-Exponential Mean Required - 25 Nov 2013
|


![]()
"DOW 20,000 "
Lance Roberts Charles Hugh Smith John Rubino Bert Dohman & Ty Andros
|

HELD OVER
Currency Wars
Euro Experiment
Sultans of Swap
Extend & Pretend
Preserve & Protect
Innovation
Showings Below
"Currency Wars "
|


"SULTANS OF SWAP" archives open ACT II ACT III
ALSO Sultans of Swap: Fearing the Gearing! Sultans of Swap: BP Potentially More Devistating than Lehman! |

"EURO EXPERIMENT"
archives open EURO EXPERIMENT : ECB's LTRO Won't Stop Collateral Contagion!
EURO EXPERIMENT: |

![]()
"INNOVATION"
archives open |

"PRESERVE & PROTE CT"
archives open |

Fri. Mar. 14th, 2014
![]()
Follow Our Updates
on TWITTER
https://twitter.com/GordonTLong
AND FOR EVEN MORE TWITTER COVERAGE
STRATEGIC MACRO INVESTMENT INSIGHTS
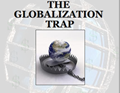 2014 THESIS: GLOBALIZATION TRAP
NOW AVAILABLE FREE to Trial Subscribers
185 Pages
What Are Tipping Poinits?
Understanding Abstraction & Synthesis
Global-Macro in Images: Understanding the Conclusions
| MARCH | ||||||
| S | M | T | W | T | F | S |
| 1 | ||||||
| 2 | 3 | 4 | 5 | 6 | 7 | 8 |
| 9 | 10 | 11 | 12 | 13 | 14 | 15 |
| 16 | 17 | 18 | 19 | 20 | 21 | 22 |
| 23 | 24 | 25 | 26 | 27 | 28 | 29 |
| 30 | 31 | |||||
KEY TO TIPPING POINTS |
| 1 - Risk Reversal |
| 2 - Japan Debt Deflation Spiral |
| 3- Bond Bubble |
| 4- EU Banking Crisis |
| 5- Sovereign Debt Crisis |
| 6 - China Hard Landing |
| 7 - Chronic Unemployment |
| 8 - Geo-Political Event |
| 9 - Global Governance Failure |
| 10 - Chronic Global Fiscal ImBalances |
| 11 - Shrinking Revenue Growth Rate |
| 12 - Iran Nuclear Threat |
| 13 - Growing Social Unrest |
| 14 - US Banking Crisis II |
| 15 - Residential Real Estate - Phase II |
| 16 - Commercial Real Estate |
| 17 - Credit Contraction II |
| 18- State & Local Government |
| 19 - US Stock Market Valuations |
| 20 - Slowing Retail & Consumer Sales |
| 21 - China - Japan Regional Conflict |
| 22 - Public Sentiment & Confidence |
| 23 - US Reserve Currency |
| 24 - Central & Eastern Europe |
| 25 - Oil Price Pressures |
| 26 - Rising Inflation Pressures & Interest Pressures |
| 27 - Food Price Pressures |
| 28 - Global Output Gap |
| 29 - Corruption |
| 30 - Pension - Entitlement Crisis |
| 31 - Corporate Bankruptcies |
| 32- Finance & Insurance Balance Sheet Write-Offs |
| 33 - Resource Shortage |
| 34 - US Reserve Currency |
| 35- Government Backstop Insurance |
| 36 - US Dollar Weakness |
| 37 - Cyber Attack or Complexity Failure |
| 38 - Terrorist Event |
| 39 - Financial Crisis Programs Expiration |
| 40 - Natural Physical Disaster |
| 41 - Pandemic / Epidemic |
Reading the right books?
No Time?

We have analyzed & included
these in our latest research papers Macro videos!
![]()
OUR MACRO ANALYTIC
CO-HOSTS
John Rubino's Just Released Book

![]()
Charles Hugh Smith's Latest Books

![]()
![]()
Our Macro Watch Partner
Richard Duncan Latest Books

MACRO ANALYTIC
GUESTS
F William Engdahl

![]()
![]()

![]()

![]()

![]()
OTHERS OF NOTE
![]()
![]()

![]()


![]()
Book Review- Five Thumbs Up
for Steve Greenhut's
Plunder!

![]()
|
Scroll TWEETS for latest Analysis
Read More - OUR RESEARCH - Articles Below
FLOWS: Liquidity, Credit and Debt
We post throughout the day as we do our Investment Research for: LONGWave - UnderTheLens - Macro |
||||||
"BEST OF THE WEEK "
|
Posting Date |
Labels & Tags | TIPPING POINT or 2013 THESIS THEME | |||
HOTTEST TIPPING POINTS |
Theme Groupings |
|||||
|
||||||
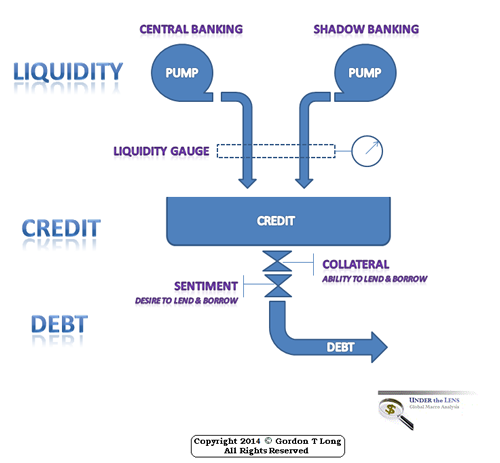
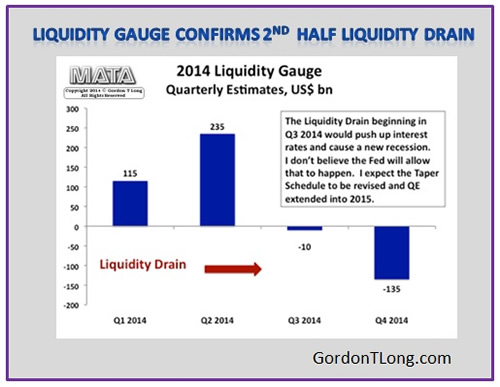
FLOWS - Liqudity, Credit & Debt The Liquidity Gauge Explains Why QE Won’t End in 2014
A liquidity gauge for the United States is relatively easy to construct. When the government borrows dollars to fund its budget deficit, it absorbs liquidity. When the Fed creates dollars through Quantitative Easing, it injects liquidity into the financial markets. During 2013, the government absorbed $680 billion to fund its budget deficit, while the Fed injected just over $1 trillion through QE. The difference between what the government absorbed and what the Fed injected was $320 billion of excess liquidity. That is not the full story, however. The Fed was not the only central bank creating fiat money and buying dollar assets last year. In order to prevent their currencies from appreciating, many central banks around the world created their own money and used it to buy the dollars entering their economies as a result of their trade surpluses with the United States. Once they had acquired the dollars, they invested them in US dollar assets to earn a return. This, then, was a second source of liquidity. It can be measured by the increase in foreign exchange reserves. In 2013, foreign exchange reserves increased by approximately $700 billion. Roughly 70% of those reserves were US dollars. This second source of liquidity thus added another $500 billion or so to US liquidity, bringing total liquidity to $1.5 trillion and excess liquidity to $820 billion. When total liquidity (i.e. Quantitative Easing combined with the amount of dollars accumulated as foreign exchange reserves) is larger than the budget deficit, there is excess liquidity and asset prices tend to rise. But when total liquidity is less than the budget deficit, there is a liquidity drain and asset prices tend to fall. The $820 billion of excess liquidity in 2013 was the most ever recorded. That explains why the stock market rose nearly 30% and why home prices rebound by 13%. This liquidity gauge also explains past booms in asset prices. Although QE only began in late 2008, central banks outside the US have been accumulating large amounts of dollars as foreign exchange reserves since the 1980s. The previous two peaks in excess liquidity occurred in 2000 at the time of the NASDAQ bubble and in 2006 at the time of the property bubble. The excess liquidity caused those bubbles.
The liquidity gauge becomes a useful tool for investors when it is used to forecast future levels of liquidity. That is also relatively easy to do. The Congressional Budget Office publishes it projections for the budget deficit and the Fed has provided a tentative taper schedule that provides estimates of how much fiat money it will create each month during 2014. All that is missing is the amount of dollars that will be accumulated as foreign exchange reserves. Here, estimates of the US current account deficit can serves as a proxy. Since 1970, the amount of dollars accumulated as foreign exchange reserves has been similar to the size of the US current account deficit during most years. Plugging in estimates for the budget deficit, the Fed’s taper schedule and estimates for the current account deficit on a quarter by quarter basis for 2014 suggests that liquidity will remain excessive during the first half of the year, but that a liquidity drain will begin in the third quarter and become significantly worse in the fourth quarter. If this analysis is correct, asset prices are likely to fall during the second half – unless the Fed provides more Quantitative Easing than it is currently signaling.
Given that the Fed has been driving the economic recovery by inflating the price of stocks and property, it is unlikely to allow falling asset prices to drag the economy back down any time soon. To prevent that from happening, it looks as though the Fed will have to extend QE into 2015 and perhaps significantly beyond.
|
03-14-14 | THEMES | FLOWS |
|||
| MOST CRITICAL TIPPING POINT ARTICLES THIS WEEK - March 9th - March 15th, 2014 | ||||||
| RISK REVERSAL | 1 | |||||
| JAPAN - DEBT DEFLATION | 2 | |||||
| BOND BUBBLE | 3 | |||||
EU BANKING CRISIS |
4 |
|||||
| SOVEREIGN DEBT CRISIS [Euope Crisis Tracker] | 5 | |||||
| CHINA BUBBLE | 6 | |||||
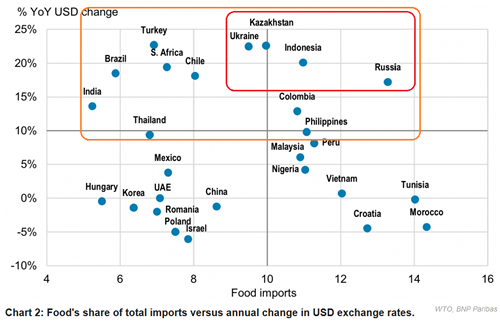
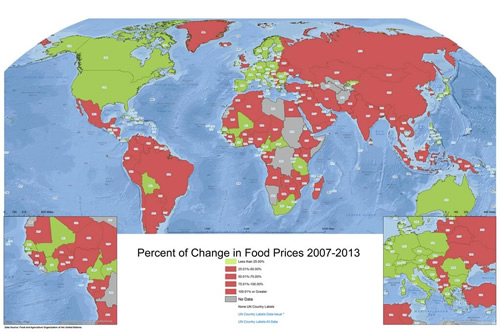
UKRAINE - Disruptive Choke Points The Ukrainean Breadbasket Has Food Price Pressures
Things Could Potentially Get Worse
There is a Correlation Between Food Price Inflation & Social Unrest
|
03-11-14 | UKRAINE | 8 - Geo-Political Event | |||
GLOBAL-GEO-POLITICAL-GROUP-UKRAINE - Russia Under Attack Financially Kerry's calculated refusal to negotiate in Sochi puts Russia under attack financially.
It also puits added pressure on Ukraine Banking & their EU Lenders POSSIBLE RUSSIAN / CHINESE COUNTER STRATEGY EXCERPTED FROM: Deluded Currency Cultists Believe The Dollar Is Invincible The cultism surrounding the U.S. economy and the U.S. dollar is truly mind boggling, and by “cultism” I mean a blind faith in the fiat currency mechanism that goes beyond all logic, reason and evidence. In recent weeks it has become more visible as global financiers play both sides of the Ukrainian conflict, luring Americans into a frenzy of false patriotism and an anti-Russo-sports-team-mentality. My personal distaste for Vladimir Putin revolves around my understanding that he is just as much a puppet of the International Monetary Fund and international banks as Barack Obama, but many Americans hate him simply because the mainstream media has designated him the next villain in the fantasy tale of U.S. foreign policy. Open threats from Russia that they will dump U.S. treasury bond holdings and the dollar’s world reserve status if NATO interferes in the Ukraine have been met with wildly naive chest beating from dollar cultists. I am beginning to see the talking points everywhere. “Let them dump the dollar, Russia’s holdings are minimal!” Or, “Let them throw out Treasuries, they’ll just be shooting themselves in the foot!” are the battle cries heard across the web. I wish I could convey how insane this viewpoint is, especially in light of the fact that many alternative economic analysts, including myself, have been predicting just such a scenario for years. Despite the childish boastings of the dollar devout, there is an extraordinarily good possibility that the life of the greenback will be snuffed out in the near term. Here are the facts…
|
03-13-14 | GLOBAL GEO-POLITICAL UKRAINE |
8 - Geo-Political Event | |||
RETAIL CRE - Unfolding Implosion Consumer Discretionary Sector Has Seen Largest Cuts to Earnings Estimates since December 31
The estimated earnings growth rate for Q1 2014 of 0 .5% is below the estimate of 4.4% at the start of the quarter (December 31). Nine of the ten sectors have recorded a decline in expected earnings growth during this time frame, led by the Consumer Discretionary, Materials, Consumer Staples, and Information Technology sectors. The only sector that has seen an increase in projected earnings growth over this period is the Utilities sector. LARGEST DECLINE: The Consumer Discretionary sector has witnessed the largest decline in expected earnings growth (to 4.6% from 12.8%) since the beginning of the quarter . Companies that have seen the largest cuts to estimates during this time include
SECOND LARGEST: The Materials sector has witnessed the second large st dip in expected earnings growth (to 1.5% from 9.1%) since the start of the quarter. Companies in the Metals & Mining industry have seen major reductions to EPS estimates during this time, inclu ding Allegheny Technologies (to -$0.08 from $0.03), Cliffs Natural Resources (to $0.10 from $0.39), and Newmont Mining (to $0.19 from $0.48). THIRD LARGEST: The Consumer Staples sector has seen the third larg est drop in expected earnings growth (to 1.6% from 6.9%) since the beginning of the quarter. Companies that have seen significant reductions in EPS estimates during this time include
EPS Guidance: High Percentage (84%) of Negative Guidance At this stage of the quarter, 103 companies in the index have issued EPS guidance for the fourth quart er. Of these 103 companies, 86 have issued negative EPS guidance and 17 have issued positive EPS guidance. Thus, the percentage of companies issuing negative EPS guidance to date for the fourth quarter is 84% (86 out of 103). This percentage is well above the 5-year average of 63%. If the final percentage is 84%, it will mark the third consecuti ve quarter in which 80% or more of the companies that issued EPS guidance for the quarter issued neg ative EPS guidance.
|
03-12-14 | RETAIL CRE | 20 - Slowing Retail & Consumer Sales | |||
RETAIL CRE - Unfolding Implosion 20 Stunning Facts On The US Retail Apocalypse 03-10-14 Michael Snyder of The Economic Collapse blog, via ZH If the U.S. economy is getting better, then why are major retail chains closing thousands of stores? If we truly are in an "economic recovery", then why do sales figures continue to go down for large retailers all over the country? Without a doubt, the rise of Internet retailing giants such as Amazon.com have had a huge impact. Today, there are millions of Americans that actually prefer to shop online. Personally, when I published my novel I made it solely available on Amazon. But Internet shopping alone does not account for the great retail apocalypse that we are witnessing. In fact, some retail experts estimate that the Internet has accounted for only about 20 percent of the decline that we are seeing. Most of the rest of it can be accounted for by the slow, steady death of the middle class U.S. consumer. Median household income has declined for five years in a row, but all of our bills just keep going up. That means that the amount of disposable income that average Americans have continues to shrink, and that is really bad news for retailers. And sadly, this is just the beginning. Retail experts are projecting that the pace of store closings will actually accelerate over the course of the next decade. So as you read this list below, please take note that things will soon get even worse. The following are 20 facts about the great U.S. retail apocalypse that will blow your mind... #1 As you read this article, approximately a billion square feet of retail space is sitting vacant in the United States. #2 Last week, Radio Shack announced that it was going to close more than a thousand stores. #3 Last week, Staples announced that it was going to close 225 stores. #4 Same-store sales at Office Depot have declined for 13 quarters in a row. #5 J.C. Penney has been dying for years, and it recently announced plans to close 33 more stores. #6 J.C. Penney lost 586 million dollars during the second quarter of 2013 alone. #7 Sears has closed about 300 stores since 2010, and CNN is reporting that Sears is "expected to shutter another 500 Sears and Kmart locations soon". #8 Overall, sales numbers have declined at Sears for 27 quarters in a row. #9 Target has announced that it is going to eliminate 475 jobs and not fill 700 positions that are currently empty. #10 It is being projected that Aéropostale will close about 175 stores over the next couple of years. #11 Macy's has announced that it is going to be closing five stores and eliminating 2,500 jobs. #12 The Children’s Place has announced that it will be closing down 125 of its "weakest" storesby 2016. #13 Best Buy recently shut down about 50 stores up in Canada. #14 Video rental giant Blockbuster has completely shut down all of their stores. #15 It is being projected that sales at U.S. supermarkets will decline by 1.7 percent this year even as the overall population continues to grow. #16 McDonald's has reported that sales at established U.S. locations were down 3.3 percent in January. #17 A home appliance chain known as "American TV" in the Midwest is going to be shutting down all 11 stores. #18 Even Wal-Mart is struggling right now. Just check out what one very prominent Wal-Mart executive recently admitted...
#19 In a recent CNBC article entitled "Time to close Wal-Mart stores? Analysts think so", it was recommended that Wal-Mart should close approximately 100 "underperforming" supercenters in rural locations across America. #20 Retail consultant Howard Davidowitz is projecting that up to half of all shopping malls in America may shut down within the next 15 to 20 years...
So is there any hope that things will turn around? Well, if the U.S. economy started producing large numbers of good paying middle class jobs there would definitely be cause for optimism. Unfortunately, that is just not happening. On Friday, we were told that the U.S. economy added 175,000 jobs during the month of February. That sounds pretty good until you realize that it takes almost that many jobs each month just to keep up with population growth. And according to CNS News, the number of unemployed Americans actually grew faster than the number of employed Americans in February...
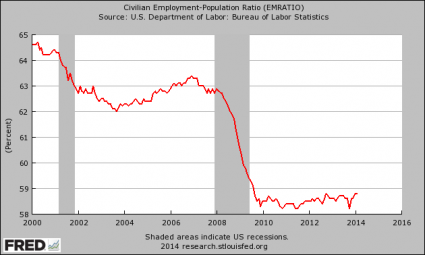
Meanwhile, the labor force participation rate continues to sit at a 35 year low, and a staggering 70 percent of all Americans not in the labor force are below the age of 55. That is outrageous. And things look particularly depressing when you look at the labor force participation rate for men by themselves. In 1950, the labor force participation rate for men was sitting at about 87 percent. Today, it has dropped beneath 70 percent to a brand new all-time record low. The truth is that there simply are not enough jobs for everyone anymore. The chart posted below shows how the percentage of working age Americans that actually have a job has changed since the turn of the millennium. As you can see, the employment-population ratio declined precipitously during the last recession, and it has stayed below 59 percent since late 2009...
If we were going to have a "recovery", we should have had one by now. Since there are not enough jobs, what is happening is that more highly educated workers are taking the jobs that were once occupied by less educated workers and bumping them out of the labor force entirely. The following is an excerpt from a recent Bloomberg article...
Due to the fact that there are not enough middle class jobs to go around, the middle class has been steadily shrinking. In 2008, 53 percent of all Americans considered themselves to be "middle class". Today, only44 percent of all Americans consider themselves to be "middle class". That is a pretty significant shift in just six years, don't you think? For much more on this, please see my previous article entitled "28 Signs That The Middle Class Is Heading Toward Extinction". Despite what the politicians and the mainstream media are telling you, the truth is that something is fundamentally wrong with our economy. On a gut level, most people realize this. According to one recent survey, only 35 percent of all Americans say that they are better off financially than they were a year ago. And according to a recent NBC News/Wall Street Journal poll, only 28 percent of all Americans believe that this country is moving in the right direction. The frightening thing is that this is about as good as things are going to get. The next great wave of the economic collapse is approaching, and when it strikes the plight of the middle class is going to get a whole lot worse.
|
03-11-14 | RETAIL CRE | 20 - Slowing Retail & Consumer Sales | |||
| TO TOP | ||||||
| MACRO News Items of Importance - This Week | ||||||
GLOBAL MACRO REPORTS & ANALYSIS |
||||||
US ECONOMIC REPORTS & ANALYSIS |
||||||
| CENTRAL BANKING MONETARY POLICIES, ACTIONS & ACTIVITIES | ||||||
| Market | ||||||
| TECHNICALS & MARKET |
|
|||||
Q1 VALUATIONS - Markets in a "Topping Process" Is the S&P 500 Overvalued? 03-07-14 Excerpted & Annotated from Fastset During the past week (on March 6), the value of the S&P 500 index closed at yet another all-time high. The forward 12-month P/E ratio for the S&P 500 now stands at 15.4, based on yesterday’s closing price (1877.03) and forward 12-month EPS estimate ($121.8 6). Given the record high values driving the “P” in the P/E ratio, how does this 15.4 P/E ratio compare to historical averages? The current forward 12-month P/E ratio is above both the 5-year average (13.2) and the 10-year average (13.8). The P/E ratio has been above the 5-year ave rage for more than a year (since January 2013), while it has been above the 10-year average for the past six months. With the forward P/E ratio well above the 5-year and 10-year averages, one could argue th at the index may now be overvalued. On the other hand, the current forward 12-month P/E ratio is still below the 15-year average (16.0). During the first two years of this time frame (1999 – 2001), the forward 12-month P/E ratio was consistently above 20.0, peaking at around 25.0 at various points in time. With the forward P/E ratio still below the 15-year average and not close to the high er P/E ratios recorded in the early years of this period, one could argue that the index may still be undervalued. It is interesting to note that the forward 12-month P/E ratio would be even higher if analysts were no t projecting record-level EPS for the next four quart ers. At this time, the Q4 2013 quarter has the reco rd for the highest bottom-up EPS at $28.78. However, s tarting in Q2 2014, industry analysts are projectin g EPS for each of the next four quarters to exceed th is record amount. In aggregate, they are calling fo r 11.3% growth in EPS over the next four quarters (Q2 14 – Q115), compared to the previous four quarters (Q213 – Q114)
|
03-12-14 | Q1 VALUATIONS | ||||
RUSSELL - 42% above 200 WMA. Historically a Top. Expect pain after April 15th and before June Witching
|
03-11-14 | RISK | ||||
STRATEGIC MACRO INVESTMENT INSIGHTS TRIGGER$ ANALYSIS |
03-10-14 | GOLD | ||||
| COMMODITY CORNER - HARD ASSETS | PORTFOLIO | |||||
| COMMODITY CORNER - AGRI-COMPLEX | PORTFOLIO | |||||
| SECURITY-SURVEILANCE COMPLEX | PORTFOLIO | |||||
| THESIS | ||||||
| 2014 - GLOBALIZATION TRAP | 2014 |  |
||||
 |
||||||
|
2013 2014 |
 |
|||||
2011 2012 2013 2014 |
 |
|||||
| THEMES | ||||||
| FLOWS -FRIDAY FLOWS | THEME |  |
||||
| SHADOW BANKING -LIQUIDITY / CREDIT ENGINE | THEME | |||||
| CRACKUP BOOM - ASSET BUBBLE | THEME | |||||
| ECHO BOOM - PERIPHERAL PROBLEM | THEME | |||||
| PRODUCTIVITY PARADOX -NATURE OF WORK | THEME | |||||
| STANDARD OF LIVING -EMPLOYMENT CRISIS | THEME | |||||
STANDARD_OF LIVING - US Decline Is Showing Everywhere 55 Things About America You May Not Know 03-11-14 Michael Snyder of The American Dream blog, via ZH Is America the greatest nation on the planet? Before you answer that question, you might want to check out the statistics that I have shared in this article first. The reality is that the United States is in a deep state of decline, and it is getting harder to deny that fact with each passing day. Mentally, emotionally, physically, spiritually and financially we are a train wreck. Many that are “patriotic” attempt to put a happy face on our growing problems, but the truly patriotic thing to do is to admit just how bad things have gotten so that we can start finding solutions. If you truly love this country, then you should know that this nation needs a huge wake up call. We have abandoned the values and the principles that early Americans held so dear, and as a result our society is a giant mess. The following are 55 things about America that you may not know… #1 We are supposed to have a government “of the people, by the people, for the people”, but only 25 percent of all Americans know how long U.S. Senators are elected for (6 years), and only 20 percent of all Americans know how many U.S. senators there are. #2 Americans spend more on health care per capita than anyone else in the world by far, and yet we only rank 35th in life expectancy. #3 Only one state in the entire country has an obesity rate of under 20 percent. 11 stateshave an obesity rate of over 30 percent. #4 Of all the major industrialized nations, America is the most obese. Mexico is #2. #5 Back in 1962, only 13 percent of all Americans were obese, but it is being projected that42 percent of all Americans could be obese by the year 2030. #6 According to a new report from the U.S. Department of Agriculture, 31 percent of all food in the United States gets wasted. In case you were wondering, that amounts to approximately 133 billion pounds of food a year. #7 America has the highest incarceration rate and the largest total prison population in the entire world by a wide margin. #8 In America, we even put 81-year-old women in prison for feeding the birds. #9 According to a Newsweek survey taken a few years ago, 29 percent of all Americans could not even name the vice president. #10 Americans spend more time sitting in traffic than anyone else in the world. #11 60 percent of Americans report feeling “angry or irritable”. Two years ago that number was at 50 percent. #12 36 percent of Americans admit that they have yelled at a customer service agent during the past year. #13 Only 30 percent of all Americans can tell you in what year the 9/11 attacks happened. #14 There are more “deaths by reptile” in America than anywhere else in the world. #15 Right now, 29 percent of all Americans under the age of 35 are living with their parents. #16 Average SAT scores have been falling for years, and the level of education that our kids are receiving in most of our public schools is a total joke. #17 According to a study conducted by the Mayo Clinic, nearly 70 percent of all Americans are on at least one prescription drug. An astounding 20 percent of all Americans are on at least five prescription drugs. #18 Americans spend more than 280 billion dollars on prescription drugs each year. #19 According to the Centers for Disease Control and Prevention, doctors in the United States write more than 250 million prescriptions for antidepressants each year. #20 Children in the United States are three times more likely to be prescribed antidepressants than children in Europe are. #21 In the United States today, prescription painkillers kill more Americans than heroin and cocaine combined. #22 America has the highest rate of illegal drug use on the entire planet. #23 According to the federal government, the number of heroin addicts in the United Stateshas more than doubled since 2002. #24 It is hard to believe, but 56 percent of all Americans now have “subprime credit”. #25 America exports more weapons to other countries than anyone else in the world. #26 The United States has the most complicated tax system on the entire planet. #27 Corruption is rampant throughout our society. In fact, America leads the world in money given to fake charities. #28 America leads the world in soft drink consumption by a wide margin. Today, the average American drinks more than 600 sodas a year. #29 In 2008, 53 percent of all Americans considered themselves to be “middle class”. In 2014, only 44 percent of all Americans consider themselves to be “middle class”. #30 70 percent of Americans do not “feel engaged or inspired at their jobs”. #31 40 percent of all workers in the United States actually make less than what a full-time minimum wage worker made back in 1968 after you account for inflation. #32 Back in the 1970s, about one out of every 50 Americans was on food stamps. Today, about one out of every 6 Americans is on food stamps. #33 The marriage rate in the United States has fallen to an all-time low. Right now it is sitting at a yearly rate of 6.8 marriages per 1000 people. #34 In the United States today, more than half of all couples “move in together” before they get married. #35 America has the highest divorce rate in the world by a good margin. #36 America has the highest percentage of one person households on the entire planet. #37 100 years ago, 4.52 were living in the average U.S. household, but now the average U.S. household only consists of 2.59 people. #38 According to the Pew Research Center, only 51 percent of all American adults are currently married. Back in 1960, 72 percent of all adults in the United States were married. #39 For women under the age of 30 in the United States, more than half of all babies are being born out of wedlock. #40 At this point, approximately one out of every three children in the United States lives in a home without a father. #41 In 1970, the average woman had her first child when she was 21.4 years old. Now the average woman has her first child when she is 25.6 years old. #42 America has the highest teen pregnancy rate in the world by a very wide margin. #43 Approximately one out of every four teen girls in the United States has at least one sexually transmitted disease. #44 America has the highest STD infection rate in the entire industrialized world. #45 According to the latest figures released by the U.S. Centers for Disease Control, there are 20 million new sexually-transmitted infections in the United States every single year, and Americans in the 15 to 24-year-old age range account for approximately 50 percent of those new sexually-transmitted infections. #46 As I wrote about recently, there are 747,408 registered sex offenders in the U.S. according to the National Center for Missing & Exploited Children. #47 America produces more pornography than any other nation in the world. #48 America has the most lawyers per capita in the entire world. #49 If you choose to be a “Constitutionalist” in America today, you may get labeled as a potential terrorist by the U.S. government. #50 America has the largest national debt in the history of the world. Back in 1980, the U.S. national debt was less than one trillion dollars. Today, it is over 17 trillion dollars. #51 According to the Congressional Budget Office, interest payments on the national debt will nearly quadruple over the next ten years. #52 Americans spend more money on elections than anyone else does in the world by a very wide margin. #53 65 percent of Americans are dissatisfied “with the U.S. system of government and its effectiveness”. That is the highest level of dissatisfaction that Gallup has ever recorded. #54 Only 8 percent of Americans believe that Congress is doing a “good” or “excellent” job. #55 70 percent of Americans do not have confidence that the federal government will “make progress on the important problems and issues facing the country in 2014.” |
03-13-14 | THEMES | STANDARD OF LIVING |
|||
| CORPORATOCRACY -CRONY CAPITALSIM | THEME |  |
||||
CORRUPTION & MALFEASANCE -MORAL DECAY - DESPERATION, SHORTAGES. |
THEME |  |
||||
| SOCIAL UNREST -INEQUALITY & A BROKEN SOCIAL CONTRACT | THEME | |||||
| SECURITY-SURVEILLANCE COMPLEX -STATISM | THEME | |||||
| GLOBAL FINANCIAL IMBALANCE - FRAGILITY, COMPLEXITY & INSTABILITY | THEME | |||||
| CENTRAL PLANINNG -SHIFTING ECONOMIC POWER | THEME | |||||
| CATALYSTS -FEAR & GREED | THEME | |||||
| GENERAL INTEREST |
|
|||||
| TO TOP | ||||||

 Central bank forward guidance and communication are all fine and good, but it is liquidity that moves the markets. When liquidity is plentiful asset prices tend to rise and when it is scarce asset prices tend to fall. What investors require, therefore, is a simple way to measure and forecast liquidity, a liquidity gauge.
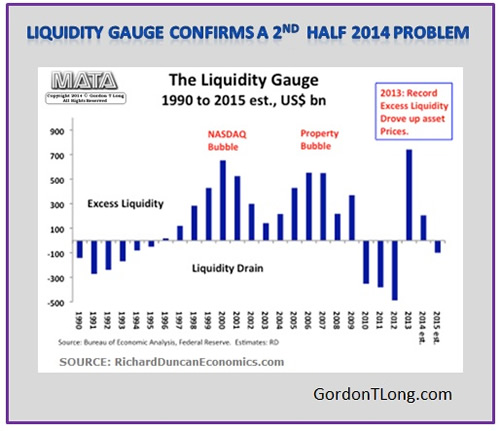


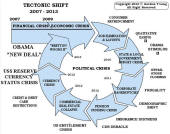
Tipping Points Life Cycle - Explained
Click on image to enlarge
TO TOP
 |
YOUR SOURCE FOR THE LATEST THINKING & RESEARCH
|
�
TO TOP