|
JOHN RUBINO'SLATEST BOOK |
||||||||||||||||||||||||||||||||||||||||||||||||||||||||||||||||||||||||||||||||||||||||||||||||||||||||||||||||||||||||||||||||||||||||||||||||||||||||||||||||||||||||||||||||||||||||||||||||||||||||||||||||||||||||||||||

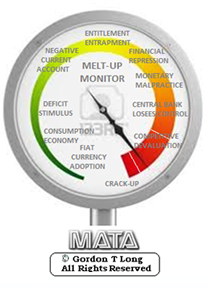
"MELT-UP MONITOR "
Meltup Monitor: FLOWS - The Currency Cartel Carry Cycle - 09 Dec 2013 Meltup Monitor: FLOWS - Liquidity, Credit & Debt - 04 Dec 2013 Meltup Monitor: Euro Pressure Going Critical - 28- Nov 2013 Meltup Monitor: A Regression-to-the-Exponential Mean Required - 25 Nov 2013
|

![]()
"DOW 20,000 "
Lance Roberts Charles Hugh Smith John Rubino Bert Dohman & Ty Andros
|

HELD OVER
Currency Wars
Euro Experiment
Sultans of Swap
Extend & Pretend
Preserve & Protect
Innovation
Showings Below
"Currency Wars "
|


"SULTANS OF SWAP" archives open ACT II ACT III
ALSO Sultans of Swap: Fearing the Gearing! Sultans of Swap: BP Potentially More Devistating than Lehman! |

"EURO EXPERIMENT"
archives open EURO EXPERIMENT : ECB's LTRO Won't Stop Collateral Contagion!
EURO EXPERIMENT: |

![]()
"INNOVATION"
archives open |

"PRESERVE & PROTE CT"
archives open |

RECAP
Weekend Sept 27th, 2015
Follow Our Updates
onTWITTER
https://twitter.com/GordonTLong
AND FOR EVEN MORE TWITTER COVERAGE
ANNUAL THESIS PAPERS
FREE (With Password)
THESIS 2010-Extended & Pretend
THESIS 2011-Currency Wars
THESIS 2012-Financial Repression
THESIS 2013-Statism
THESIS 2014-Globalization Trap
THESIS 2015-Fiduciary Failure
NEWS DEVELOPMENT UPDATES:
FINANCIAL REPRESSION
FIDUCIARY FAILURE
WHAT WE ARE RESEARCHING
2015 THEMES
SUB-PRIME ECONOMY
PENSION POVERITY
WAR ON CASH
ECHO BOOM
PRODUCTIVITY PARADOX
FLOWS - LIQUIDITY, CREDIT & DEBT
GLOBAL GOVERNANCE
- COMING NWO
WHAT WE ARE WATCHING
(A) Active, (C) Closed
MATA
Q3 '15- Chinese Market Crash
(A)
Q3 '15-
GMTP
Q3 '15- Greek Negotiations
(A)
Q3 '15- Puerto Rico Bond Default
MMC
OUR STRATEGIC INVESTMENT INSIGHTS (SII)
NEGATIVE-US RETAIL
NEGATIVE-ENERGY SECTOR
NEGATIVE-YEN
NEGATIVE-EURYEN
NEGATIVE-MONOLINES
POSITIVE-US DOLLAR
ARCHIVES
| SEPTEMBER | ||||||
| S | M | T | W | T | F | S |
| 1 | 2 | 3 | 4 | 5 | ||
| 6 | 7 | 8 | 9 | 10 | 11 | 12 |
| 13 | 14 | 15 | 16 | 17 | 18 | 19 |
| 20 | 21 | 22 | 23 | 24 | 25 | 26 |
| 27 | 28 | 29 | 30 | |||
KEY TO TIPPING POINTS |
| 1- Bond Bubble |
| 2 - Risk Reversal |
| 3 - Geo-Political Event |
| 4 - China Hard Landing |
| 5 - Japan Debt Deflation Spiral |
| 6- EU Banking Crisis |
| 7- Sovereign Debt Crisis |
| 8 - Shrinking Revenue Growth Rate |
| 9 - Chronic Unemployment |
| 10 - US Stock Market Valuations |
| 11 - Global Governance Failure |
| 12 - Chronic Global Fiscal ImBalances |
| 13 - Growing Social Unrest |
| 14 - Residential Real Estate - Phase II |
| 15 - Commercial Real Estate |
| 16 - Credit Contraction II |
| 17- State & Local Government |
| 18 - Slowing Retail & Consumer Sales |
| 19 - US Reserve Currency |
| 20 - US Dollar Weakness |
| 21 - Financial Crisis Programs Expiration |
| 22 - US Banking Crisis II |
| 23 - China - Japan Regional Conflict |
| 24 - Corruption |
| 25 - Public Sentiment & Confidence |
| 26 - Food Price Pressures |
| 27 - Global Output Gap |
| 28 - Pension - Entitlement Crisis |
| 29 - Central & Eastern Europe |
| 30 - Terrorist Event |
| 31 - Pandemic / Epidemic |
| 32 - Rising Inflation Pressures & Interest Pressures |
| 33 - Resource Shortage |
| 34 - Cyber Attack or Complexity Failure |
| 35 - Corporate Bankruptcies |
| 36 - Iran Nuclear Threat |
| 37- Finance & Insurance Balance Sheet Write-Offs |
| 38- Government Backstop Insurance |
| 39 - Oil Price Pressures |
| 40 - Natural Physical Disaster |
Reading the right books?
No Time?
We have analyzed & included
these in our latest research papers Macro videos!
OUR MACRO ANALYTIC
CO-HOSTS
John Rubino's Just Released Book
Charles Hugh Smith's Latest Books


Our Macro Watch Partner
Richard Duncan Latest Books
MACRO ANALYTIC
GUESTS
F William Engdahl


OTHERS OF NOTE
Book Review- Five Thumbs Up
for Steve Greenhut's Plunder!


![]()
TODAY'S TIPPING POINTS
|
Have your own site? Offer free content to your visitors with TRIGGER$ Public Edition!
Sell TRIGGER$ from your site and grow a monthly recurring income!
Contact [email protected] for more information - (free ad space for participating affiliates).
HOTTEST TIPPING POINTS |
Theme Groupings |
||
We post throughout the day as we do our Investment Research for: LONGWave - UnderTheLens - Macro
|
|||
|
MOST CRITICAL TIPPING POINT ARTICLES TODAY
|
|
||
| MOST CRITICAL TIPPING POINT ARTICLES THIS WEEK -Sept 20th, 2015 - Sept. 26th, 2015 | |||
GLOBAL GROWTH |
8 - Shrinking Revenue Growth Rate |
||
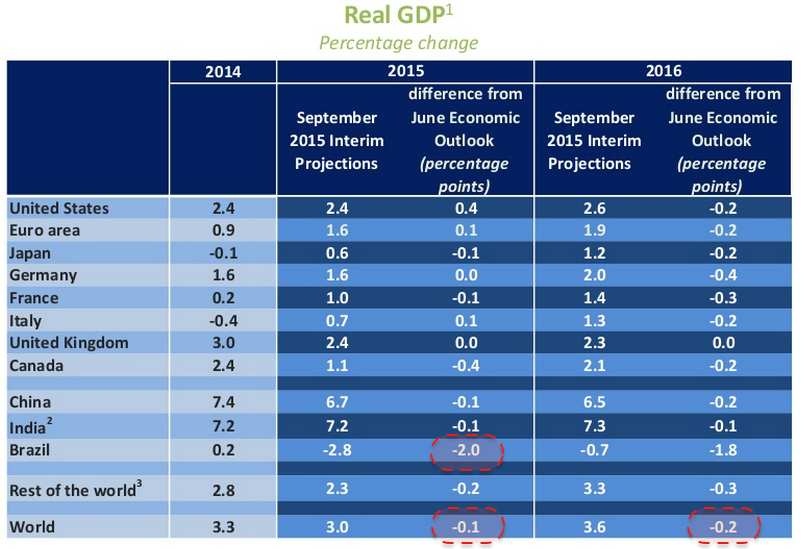
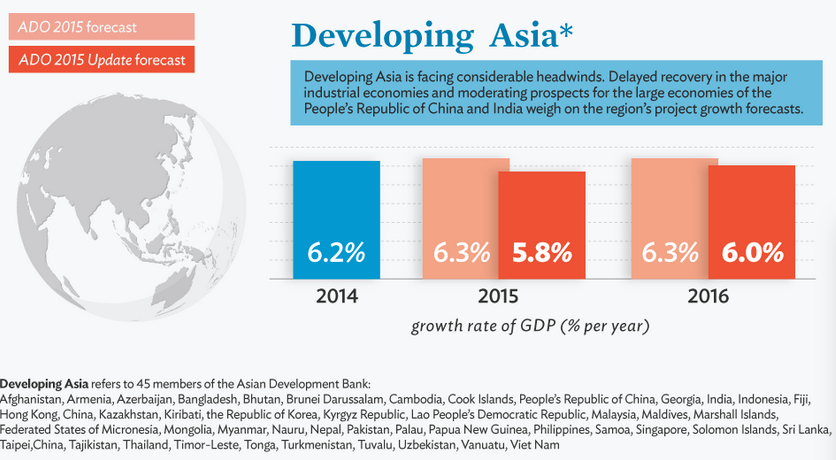
Submitted by Tyler Durden on 09/22/2015 22:13 ADB Joins OECD, WTO In Dismal Assessment Of Global GrowthExactly a week ago, we highlighted a WSJ piece which quoted WTO chief economist Robert Koopman as saying the following about the outlook for global growth: “We have seen this burst of globalization, and now we’re at a point of consolidation, maybe retrenchment. It’s almost like the timing belt on the global growth engine is a bit off or the cylinders are not firing as they should.” Explaining further, The Journal noted that “for the third year in a row, the rate of growth in global trade is set to trail the already sluggish expansion of the world economy.” In no uncertain terms: global growth and trade are grinding to a halt, something we’ve been keen to drive home this year using a variety of data points not the least of which are freight rates which, as Goldman noted back in May are likely to remain depressed until 2020, dead cat bounces in the Baltic Dry notwithstanding (for more on this, see here). All of the above was confirmed last Wednesday by the OECD which cut their forecast for global growth to 3% in 2015 and 3.6% in 2016.
Of course one of the main problems is decreased demand from China, where sharply decelerating economic growth threatens to plunge the entire emerging world into crisis as the country’s previously insatiable appetite for raw materials suddenly disappeared leaving countries like Brazil out in the cold. Also hard hit is emerging Asia, where the turmoil in China combined with the threat of an imminent Fed hike has created conditions that may ultimately usher in the return of the 1997/98 Asian Currency Crisis (indeed, Malaysia’s central bank governor Zeti Akhtar Aziz has been at pains to reassure the market that the country isn’t set to return to capital controls to shore up the plunging ringgit). Against this backdrop it shouldn’t come as a surprise that the ADB slashed its growth outlook for the region on Tuesday citing a laundry list of factors, most of which are outlined above. Here’s more:
As that pretty much speaks for itself, we'll close with what we said last week in the wake of the OECD's most recent report:
|
|||
| TO TOP | |||
| MACRO News Items of Importance - This Week | |||
GLOBAL MACRO REPORTS & ANALYSIS |
|||
US ECONOMIC REPORTS & ANALYSIS |
|||
| CENTRAL BANKING MONETARY POLICIES, ACTIONS & ACTIVITIES | |||
| Market | |||
| TECHNICALS & MARKET |
|
||
| COMMODITY CORNER - AGRI-COMPLEX | PORTFOLIO | ||
| SECURITY-SURVEILANCE COMPLEX | PORTFOLIO | ||
| THESIS - Mondays Posts on Financial Repression & Posts on Thursday as Key Updates Occur | |||
| 2015 - FIDUCIARY FAILURE | 2015 | THESIS 2015 |  |
| 2014 - GLOBALIZATION TRAP | 2014 |  |
|
 |
|||
|
2013 2014 |
 |
||
2011 2012 2013 2014 |
 |
||
| THEMES - Normally a Thursday Themes Post & a Friday Flows Post | |||
I - POLITICAL |
|||
| CENTRAL PLANNING - SHIFTING ECONOMIC POWER - STATISM | THEME | ||
- - CORRUPTION & MALFEASANCE - MORAL DECAY - DESPERATION, SHORTAGES. |
THEME |  |
|
| - - SECURITY-SURVEILLANCE COMPLEX - STATISM | M | THEME | |
| - - CATALYSTS - FEAR (POLITICALLY) & GREED (FINANCIALLY) | G | THEME | |
II-ECONOMIC |
|||
| GLOBAL RISK | |||
| - GLOBAL FINANCIAL IMBALANCE - FRAGILITY, COMPLEXITY & INSTABILITY | G | THEME | |
| - - SOCIAL UNREST - INEQUALITY & A BROKEN SOCIAL CONTRACT | US | THEME | |
| - - ECHO BOOM - PERIPHERAL PROBLEM | M | THEME | |
| - -GLOBAL GROWTH & JOBS CRISIS | |||
| - - - PRODUCTIVITY PARADOX - NATURE OF WORK | THEME | MACRO w/ CHS |
|
| - - - STANDARD OF LIVING - EMPLOYMENT CRISIS, SUB-PRIME ECONOMY | US | THEME | MACRO w/ CHS |
III-FINANCIAL |
|||
| FLOWS -FRIDAY FLOWS | MATA RISK ON-OFF |
THEME |  |
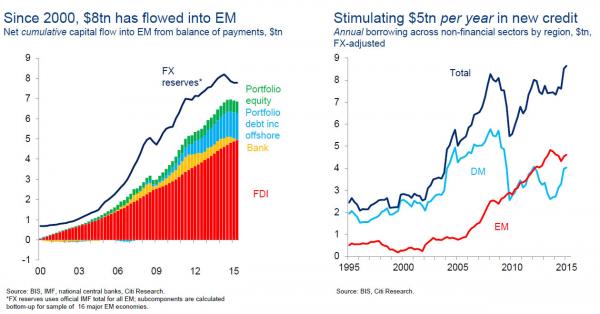
FLOWS - Liquidity, Credit and Debt
|
|||
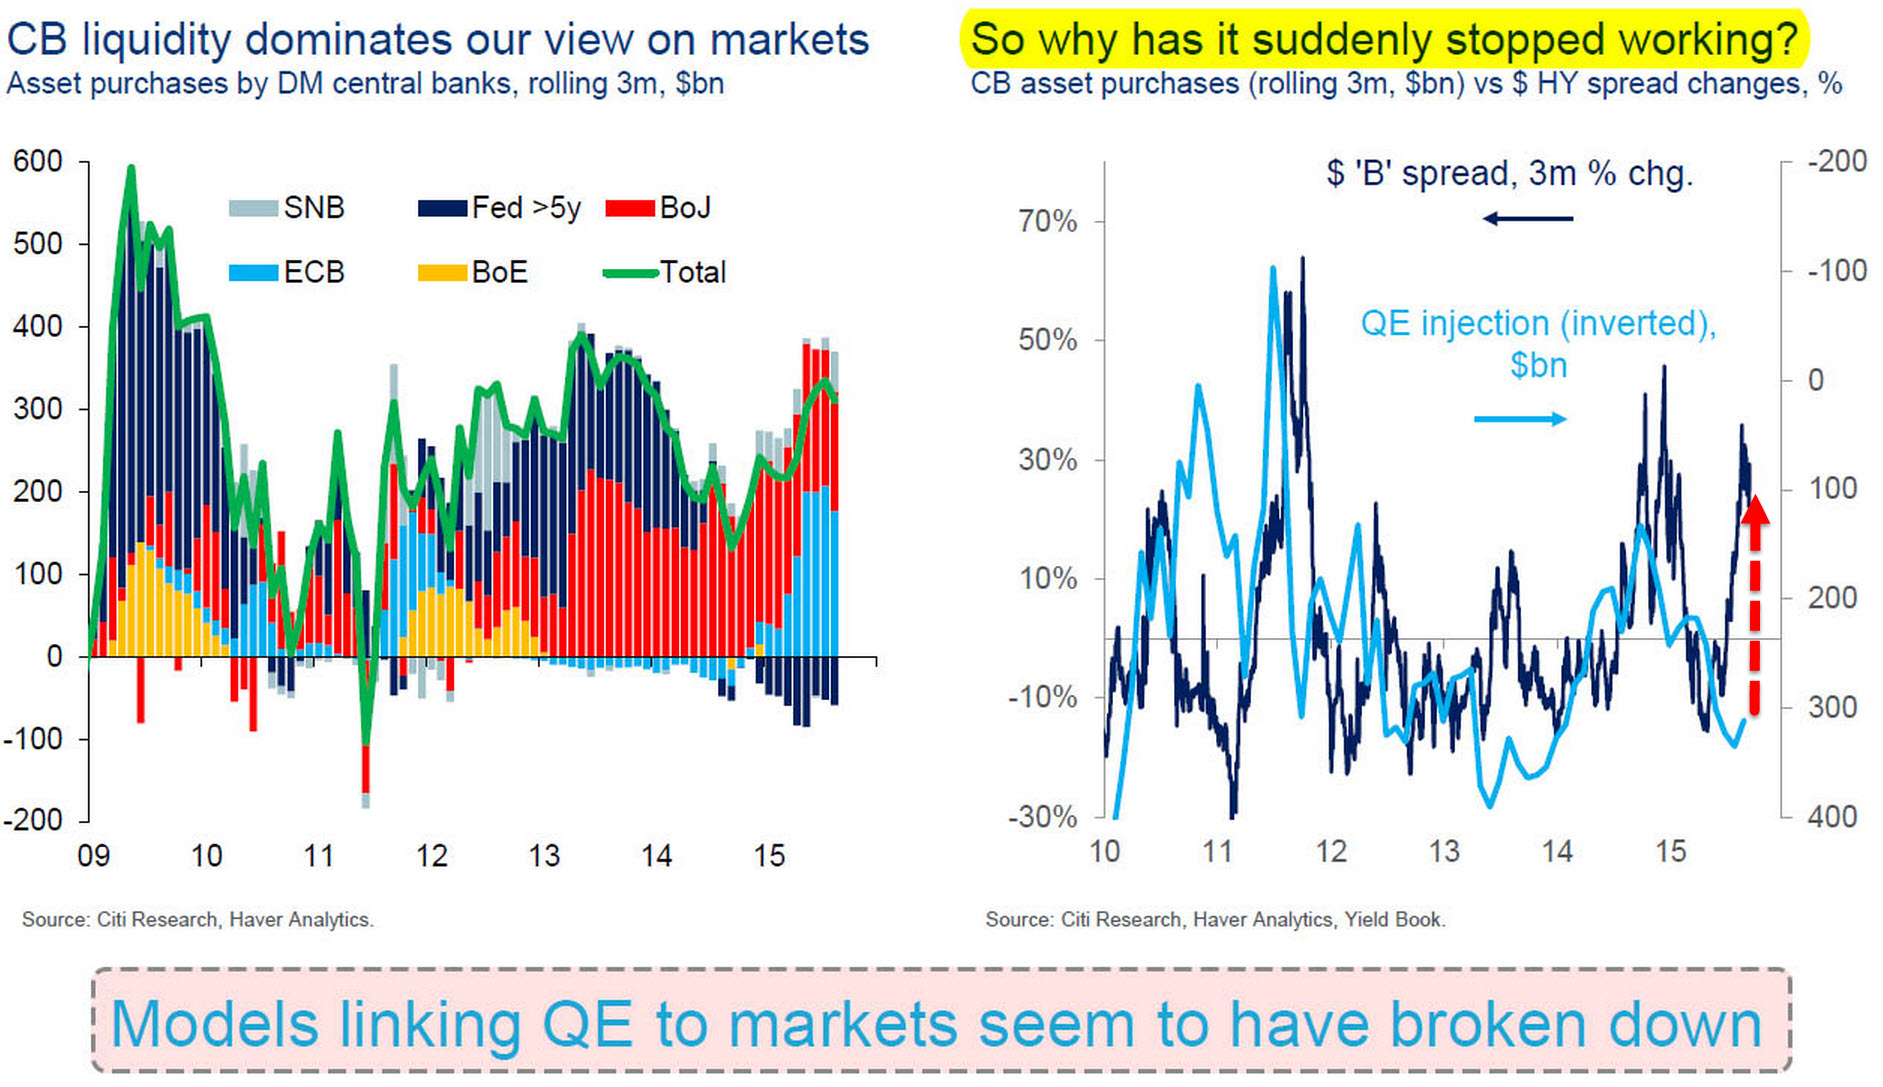
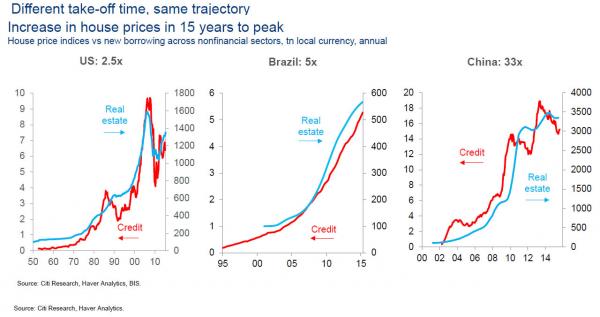
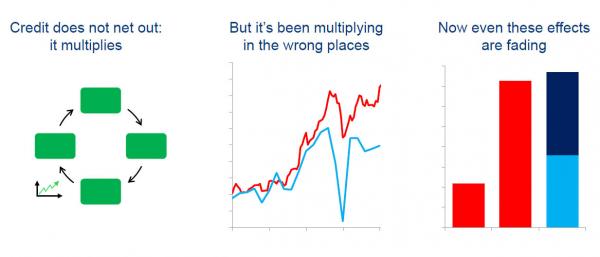
FLOWS - Liquidity, Credit and Debt Submitted by Tyler Durden on 09/23/2015 14:39 "Why Has It Suddenly Stopped Working": The Chart Every Trader Is Losing Sleep OverIn a must-read report which we will deconstruct shortly, Citi's Matt King (who, as a reminder, is the person whose "Are the Brokers Broken" report issued in the first week of September 2008 was, according to many, one of the catalysts for Lehman's failure simply by explaining to a largely clueless Wall Street just how broken the US financial system had become in late 2008) hits it out of the park with just one chart from his latest presentation, the chart which every market bull - whether they know it or not - is losing sleep over: has the only thing that has worked in the past 7 years, namely the central bank QE transmission channel, broken down. Or, as Citi's Matt King notes in what may be the only chart which traders should be obsessing over, "why has it suddenly stopped working", by which he means the market's favorable reaction to central bank liquidity injections. His question: "have central banks lost their touch" and points out that while in the past QE injections have always resulted in improving risk asset prices (in this case represented by junk bond returns), this time is different.
The answer will determine whether the next move in the market is 20% higher or lower.
|
|||
Submitted by Tyler Durden on 09/23/2015 18:27
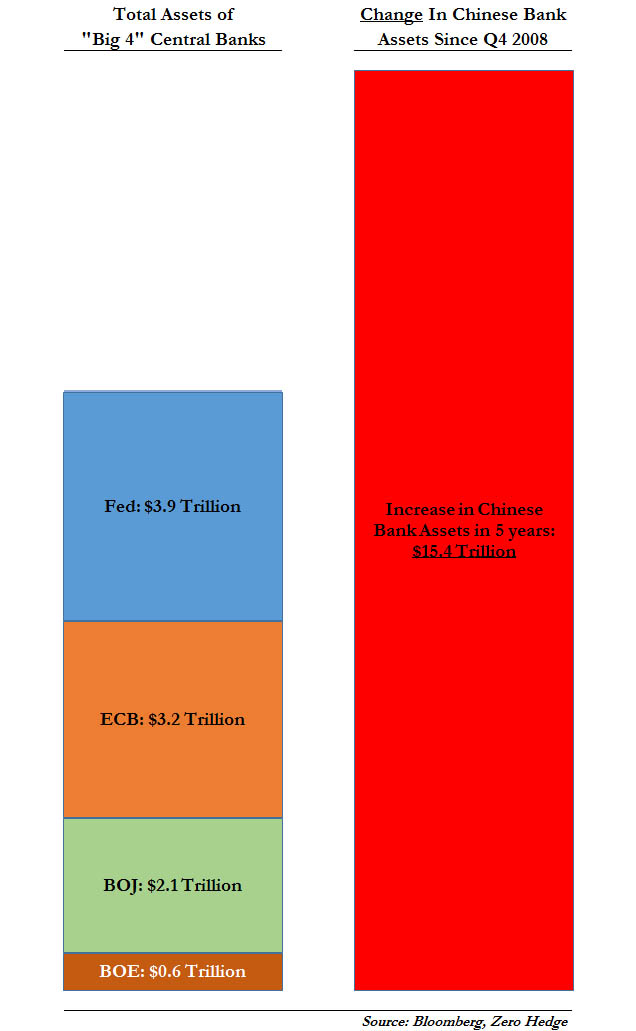
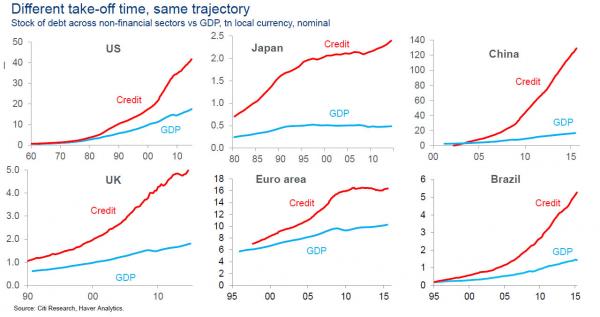
Your Complete Guide To A World In Which The Fed Is No Longer In ControlBack in December 2013 we pointed out something that virtually nobody had noted or discussed: when it comes to "credit" creation, China's $15 trillion in freshly-created bank loans since the financial crisis - ostensibly the global credit buffer that allowed China to not get dragged down by the western recession - dwarfed the credit contribution by DM central banks.
This is how we simplified what was happening at the time:
This dramatic divergence in credit creation continued for about a year, then gradually Chinese new loans topped out primarily due to regulation slamming shut debt creation in the shadow banking space, and since credit accumulation resulted in parallel build up in central bank reserves, the current period of debt creation going into reverse has led to not only China's currency devaluation but what we first warned was Reverse QE, and has since picked up the more conventional moniker "Quantitative Tightening." But while China's credit topping process was inevitable, a far more sinister development has emerged: as weshowed earlier, while DM central banks - excluding the Fed for the time being - have continued to pump liquidity at full blast into the global, fungibly-connected, financial system, there has been virtually no impact on risk assets...
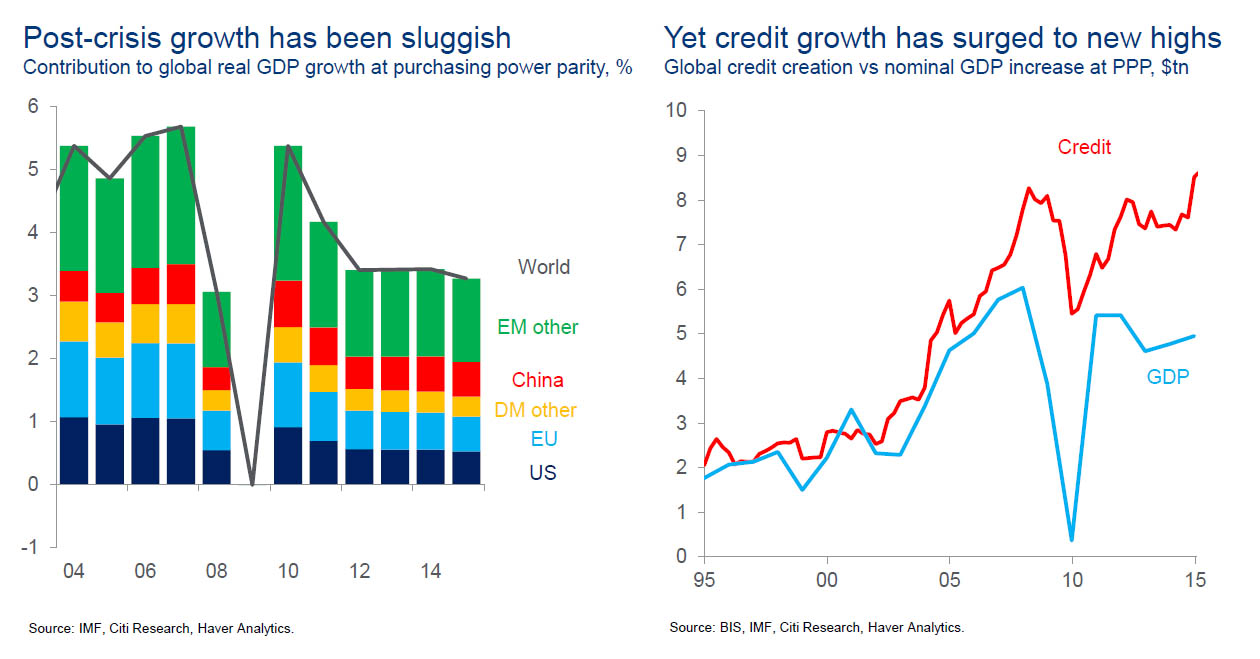
... especially in the US where the S&P is now down not only relative to the end of QE3, but is down 5% Y/Y - the biggest annual drop since 2008. This cross-flow dynamic is precisely what David Tepper was trying to explain to CNBC two weeks ago when the famous hedge fund manager declared the "Tepper Top" and went quite bearish on the stock market. This dynamic is also the topic of a must-read report by Citi's Matt King titled quite simply: "Has the world reached its credit limit?" and which seeks to answer a just as important question: "Why EM weakness is having such a large impact", a question which we hinted at 2 years ago, and which is now the dominant topic within the financial community, one which may explain why development market central bank liquidity "has suddenly stopped working." King's explanation starts by showing, in practical terms, where the world currently stands in terms of the only two metrics that matter in a Keynesian universe: real growth, and credit creation.
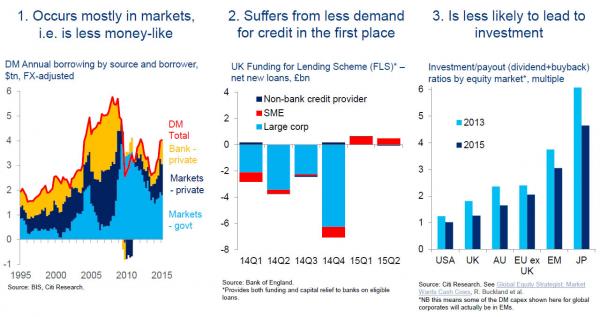
His summary: there has been plenty of credit, just not much growth. So the next logical question is where has this credit been created. Our readers will know the answer: the marginal credit creator ever since the financial crisis were not the DM central banks - they were merely trying to offset private sector deleveraging and defaults; all the credit growth came from Emerging Markets in general, and China in particular.
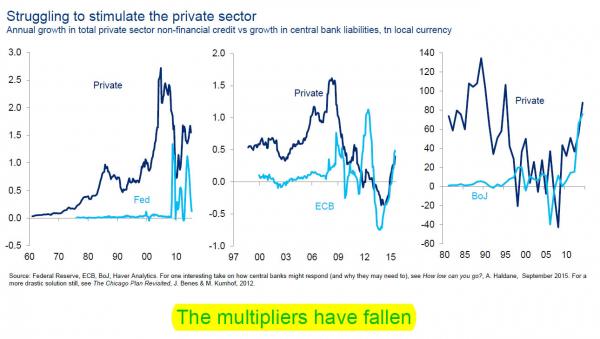
So while we now know that EMs were the source of credit creation, why care? Why does it matter if credit was mostly being created in EMs vs DMs, and isn't credit created anywhere essentially the same? The answer is a resounding no, as King further explains. First, looking at credit creation in the post-crisis developed markets reveals something troubling: because credit creation takes places mostly in markets and is locked in central bank "outside" money which does not enter the broad monetary system, as opposed to bank credit creation in which banks issue loans thereby creating both new loans and deposits, i.e., money, the direct impect of DM central bank liquidity injections has been to created asset-price inflation. However, the offset has been far lower broad money creation - as there is far less credit demand in the first place - leading to no incremental investment, and far lower economic multipliers.
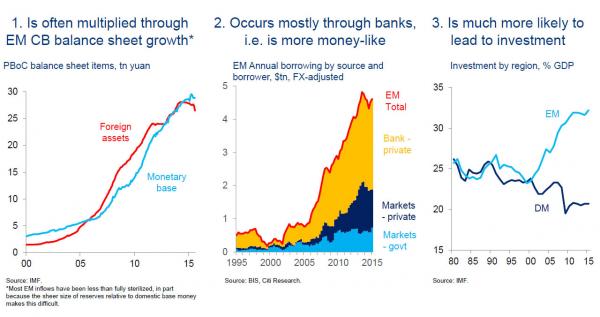
Alternatively, it should come as no surprise that credit creation in EMs is the opposite: here money creation took place in the conventional loan-deposit bank-intermediated pathway, with a side effect being the accumulation of foreign reserves boosting the monetary base. Most importantly, new money created in EMs, i.e., China led to new investment, even if that investment ultimately was massively mis-allocted toward ghost cities and unprecedented commodity accumulation. It also led to what many realize is the world's most dangerous credit bubble as it is held almost entirely on corporate balance sheets where non-performing loans are growing at an exponential pace.
The good news is that at least initially the EM credit multiplier is far higher than in the DM. The bad news, is that even the stimulative effect of the EM multiplier is now fading.
As a result, instead of going toward economic growth, even EM credit creation has been corrupted by the "western" bug, and is being allocated toward asset-price inflation... such as housing and markets.
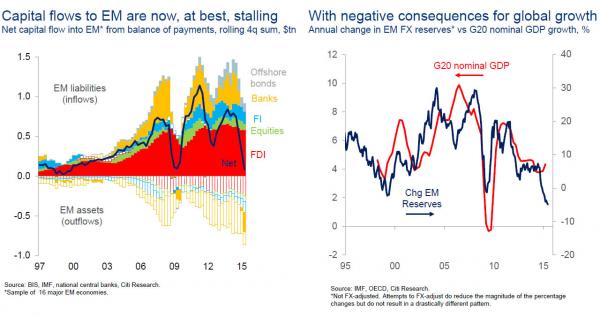
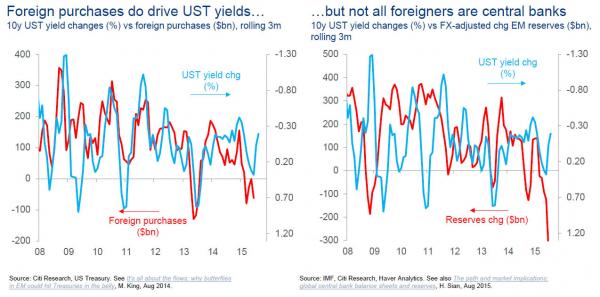
* * * The above lays out the market dynamic that took place largely uninterrupted from 2008 until the end of 2014. And then something changed dramatically. That something is what we said started taking place last November when we pointed out the "death of the petrodollar", when as a result of the collapse in oil prices oil exporters started doing something they have never done before: they dipped into their FX reserves and started selling. This reserve liquidation first among the oil exporting emerging market, is essentially what has since morphed into a full blown capital flight from the entire EM space, and has also resulted in China's own devaluation-driven reserve (i.e., Treasury) liquidation, which this website also noted first back in May. As King simply summarizes this most important kink in the story, after years of reserve accumulation, EMs have now shifted to reserve contraction which, in the simplest possible terms means, "money is being destroyed"which in turn is the source of the huge inflationary wave slowly but surely sweeping over the entire - both EM and DM - world.
Ok, EMs are selling. But where is the money going? And won't dumping of Treasurys push yields higher. Answering the second question first, we remind readers of a note from several weeks ago titled "Why China Liquidations May Not Spike US Treasury Yields" which is precisely what DB also said, and which Citi agrees with: while there may be upward pressure on yields it will likely be temporary, especially if there is an even greater risk-aversion reaction in risk assets. The result to EM TSY selling would be a selloff in stocks, which in turn would push investors into the "safety" of bonds, thus offsetting Chinese selling.
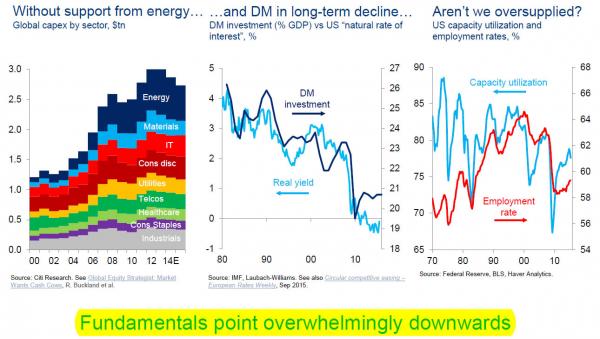
But while one can debate what the impact on money destruction would be on equities and treasurys, a far clearer picture emerges when evaluting the impact on the underlying economy. As King, correctly, summarizes without the capex boost from energy (which won't come as long as oil continues its downward trajectory), and DM investment continues to decline, there is an unprecedented build up in inventory, which in turn is pressuring both capacity utilization, the employment rate, and soon, GDP once the inevitable inventory liquidation takes place.
The take home is highlighted in the chart above, but just in case it is missed on anyone here it is again: the"fundamentals point overwhelmingly downwards." But wait, won't central banks react this time as they have on all those prior occasions (QE1, QE2, Operation Twist, QE3, BOE QE1, BOJ QQE1, ECB QE1, etc)? Well, they'll surely try... but even they know that every incremantal attempt to stimulate the private sector will have increasingly less impact. In other words, the CBs are not out of firepower, it is just that their ammo is almost nil. The reason for that: the "multiplier have fallen" because after 7 years of doing the same thing, this time it just may not work...
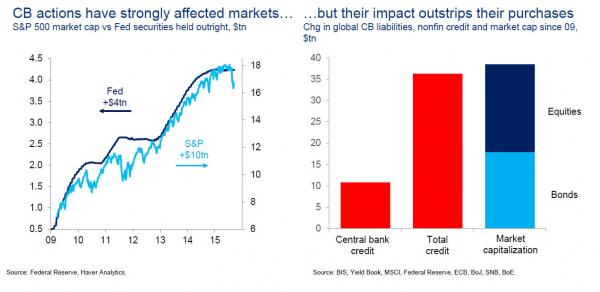
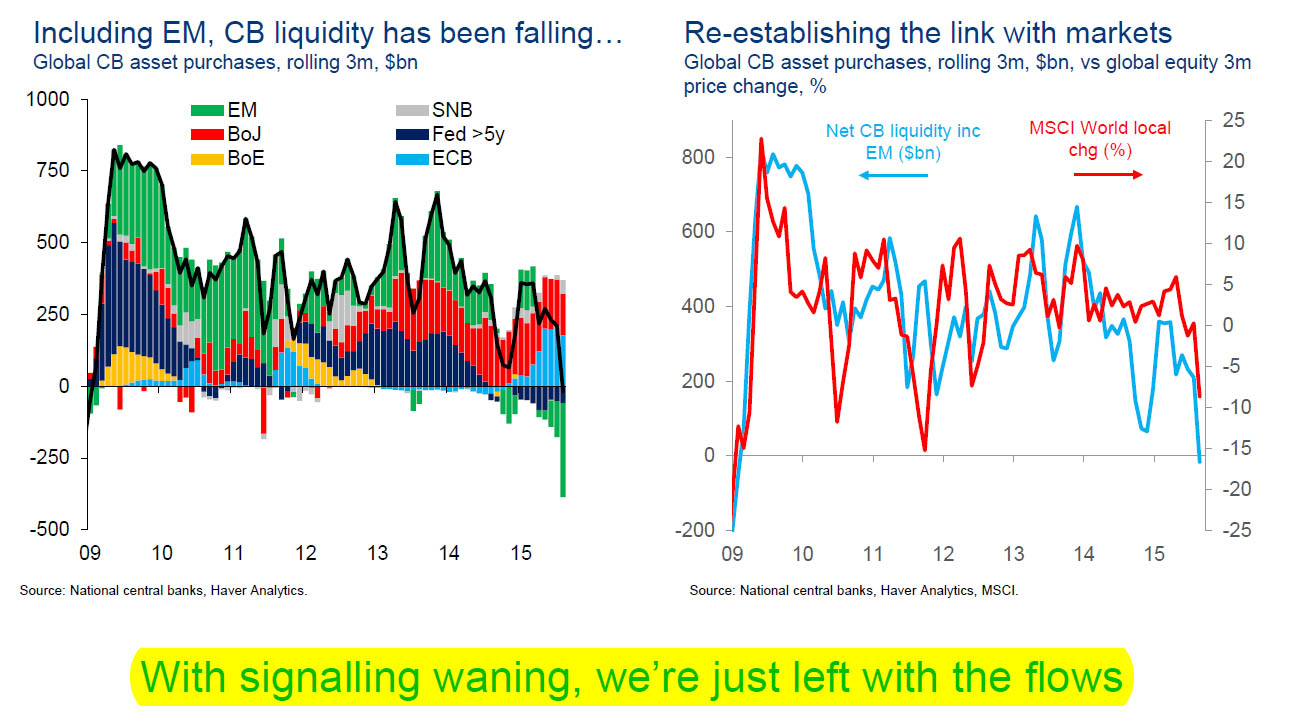
Furthermore, while we have listed the numerous direct interventions by central banks over the past 7 years, the reality is that an even more powerful central bank weapon has been central bank "signalling", i.e., speaking, threatening and cajoling. As Citi summarizes "The power of CBs’ actions has stemmed more from the signalling than from the portfolio balance effect."
So now that the "signalling" pathway is fading, all that's left are the flows - the same flows which, with very good reason, left David Tepper scratching his head. Flows, which, when one takes into account emerging market reserve liquidation to offset central bank purchases, paints a very ugly picture: one in which the central banks are for the first time since 2009, finally losing control as their inflows are unable to offset the EM outflows.
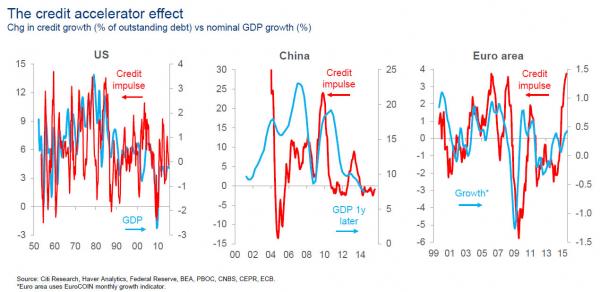
Where does that leave us? Well, all else equal, the New New Normal, the world in which central banks are no longer in control as a result of EM reserve liquidation, will be world in which slower credit growth translated into, you guessed it, slower overall growth, or as Citi states the conudnrum: "Even a deceleration in credit growth is negative for GDP growth." This is precisely the secular stagnation which we have been warning about since 2009.
* * * What is the conclusion? It's not a pretty one for either the central bankers, nor the Keynesian economists, nor those who believe asset prices can keep rising in perpetuity, because it means that payment for the free lunch from the past 7 years is finally coming due.
But at least it is a simple conclusion: we are now at the credit plateau, or as Citi puts it: "Credit growth requires willing borrowers as well as lenders; we may be nearing the limits for both."
|
|||
| CRACKUP BOOM - ASSET BUBBLE | THEME | ||
| SHADOW BANKING - LIQUIDITY / CREDIT ENGINE | M | THEME | |
| GENERAL INTEREST |
|
||
| STRATEGIC INVESTMENT INSIGHTS - Weekend Coverage | |||
|
SII | ||
|
SII | ||
|
SII | ||
|
SII | ||
Oil Price Forecast: 2015-2016 10-18-14 Forbes - Bill Conerly (dated but valuiable) The sharp drop in oil prices in the past few weeks confirms the oil price forecastthat I published back in May 2013, when West Texas crude sold for $94.50:
Before going into the forecast, it’s worth mentioning that price can change faster than the fundamentals of supply and demand. In a recent 30-day period the price of oil fell by 20 percent. There was no change in the demand or supply over that month to justify such a large change. What happened is that commodity traders look at expected future prices, based on long-term supply and long-term demand. When the traders’ expectations change, they buy or sell and the price changes. Traders’ expectations can change due to moods, “animal spirits,” fear, greed, drugs, family strife or lack of coffee. Or too much coffee. Thus, short-term price changes can happen quickly. My own guess is that hundreds of very influential traders suddenly slapped their foreheads and said, “That Bill Conerly is right.” Which triggered a large drop in oil prices. Economists have been slowly lowering their projections for global economic growth in the coming years, triggering lower expectations for oil demand. On the supply side, think of three distinct steps involved in getting oil to market: exploration, development, and production. Exploration is very sensitive to projected prices of crude oil. The price of oil had seemed stuck at $20 for many years, from roughly 1986 through 1997. Then prices started to rise, breaking through $60 in 2005. The price break, plus maybe talk about peak oil, lead to a surge in exploration around the world. With prices now dropping, new exploration activity will decline. Development is the process of sinking more wells in a field that has already been proven by exploratory drilling. Development also includes building the local pipelines and terminals required to get the oil to a transportation facility. Development expenses are often worthwhile even at lower prices. For example, suppose that the all-in cost of oil from a brand new field is $80, of which $30 per barrel constitutes exploration. That means that development and production only costs $50 a barrel extra. If the exploration costs have already been paid, then companies will continue with development even at today’s $60 price. Production is even cheaper. Traditionally, production costs were very small compared to exploration and development, but wells that are fracked have higher production costs that old-fashioned wells. Nonetheless, once the exploration and development have been paid for, it almost always makes sense to keep the wells pumping. The supply-side question for the future is not whether it’s profitable to find new oil at today’s low prices. The question is how long we can enjoy the new oil supply that has been discovered in the past ten years. I believe the answer is somewhere between five and ten years. Wells have a natural decline rate. For a particular well, the engineer might estimate that each year’s production would be 15 percent less than the previous year’s production, over the life of the well, asymptotically approaching zero. (I’ve never met a petroleum engineer willing to guess at an average decline rate, but I’ve seen figures such as ten percent and 15 percent cited as examples.) My price forecast is that today’s $60 price is likely to be the high end for the coming two years. There may be temporary market volatility higher, but don’t expect a higher price to be sustained. At the low end, $50 seems like a floor absent a global recession. However, it’s worth looking at the 1980s to recall how low things can go. Oil had sold for less than five dollars a barrel every year prior to 1973, when the price shot up past ten dollars. Then in 1979 the price zoomed into the high $30s. By 1986, though, global exploration had brought more oil to market. Energy conservation efforts had been triggered by the higher prices, and they limited demand. The price of oil plunged, sinking Texas into recession and causing the bankruptcy of many oil companies and banks. For the next few years, take our current $60 price as a ceiling, and consider the floor indeterminate. ========== Long-Term Oil Prices: Goldman Sachs Vs. OPEC 09-25-15 Forbes - Micahael Lynch Interestingly, two contradictory oil price forecasts have appeared in the past few days, Goldman Sachs predicting that prices would remain “low” for fifteen years, while OPEC has argued that the price should recover to $80 a barrel by 2020. This is interesting because a few years ago, Goldman was considered the greatest price bull (among respectable forecasters) and OPEC actually had one of the lowest long-term oil price projections. As a student of oil price forecasting, I can attest that this is somewhat surprising, but not shocking. First and foremost, there is a huge amount of uncertainty about many elements of the long-term market, such that diverse opinions should be expected. Twenty years ago, looking at computer models of the world oil market, I found that for the United States, the modelers had widely divergent estimates of the response of demand to price and economic growth (elasticities, as the economists say). Even now, the future demand trend with lower oil prices is highly debated. Beyond that, there are huge uncertainties about both fundamentals and geopolitical risk. Without a strong economic revival in China, it will be difficult to develop enough demand to absorb likely increases in OPEC production, and it still remains unclear if it will come roaring back or be stuck in a Japanese style long-term slump. The overhang in the real estate market looks impressive, but China still has large financial reserves and a labor force that should be able to show strong improvements in productivity. Also, the breakeven price of shale oil remains unclear; shale gas boomed at prices far below the estimated breakeven price, and shale oil may do the same, but the jury (and the bankruptcy court) is still out. Further, the question of resource access in countries like Iran, Mexico and Venezuela could be very bullish for supplies, but in no case is it clear that the sailing will be smooth. Mexico is the most likely to see significantly higher production, but it’s always good not to count your wells before they pump. Geopolitically, Libya, Iraq, and Nigeria all have some degree of threats to their oil supply, or actual disruptions, which could resolve or worsen in the next five years. Other countries, like Iran, Venezuela, and Algeria are all potentially unstable to some extent, and there still remains relatively small amounts of surplus capacity in the market to offset any large disruption. Alternatively, it is quite possible that Libya and Iran will add significant amounts of oil to the market, up to 2 mb/d, in the next couple of years, and Iraq (including Kurdistan) could meet as much as one-third of global demand growth for years to come. Even a moderately optimistic outlook for supply from these countries means pressure on the other members of OPEC to reduce their production, which could mean another price war. But what is interesting is that there is now a split between oil price bears and bulls concerning long-term price trends, when historically, oil price forecasters have “made sheep look like independent thinkers” in the words of one industry exec. As mentioned before, my long-term forecast of $60 has met with ridicule in the past few years. Last year’s DOE survey of price forecasts (page CP-2 in theAnnual Energy Outlook 2014) was not only the lowest, but only mine showed a declining trend, and only one other was lower than $100. (Okay, another one was $99.10 in 2025). Hopefully, the divergence amongst forecasters will continue, at least insomuch as it reflects real uncertainty. However, if history is any guide, I would not bet on it. More to come….
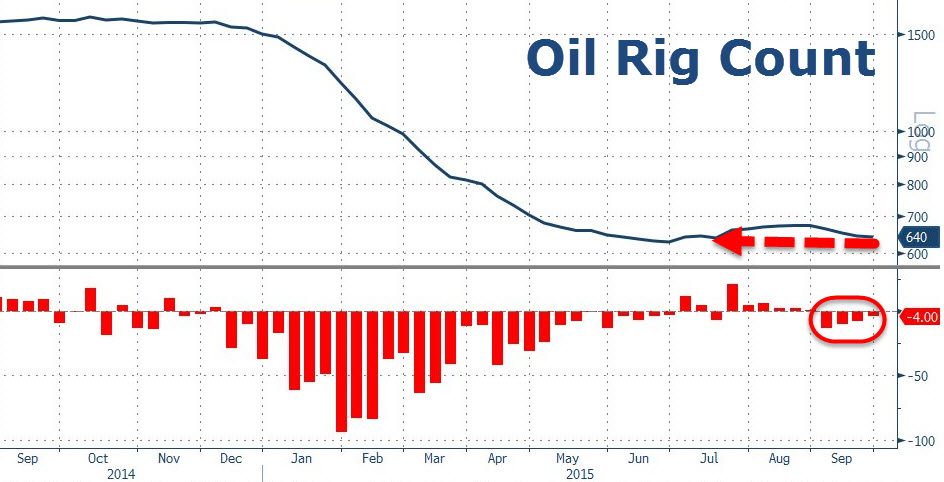
Crude Shrugs As US Oil Rig Count Declines For 4th Week To 10-Week Lows09-25-15 ZH For the 4th week in a row , US oil rig counts declined (down 4 to 640) leaving the count as 10-week lows. This is the largest 4-week decline since May. Crude prices are undecided on how to react for now with stop runs higher and lower so far...
The breakdown is as follows:
Charts: Bloomberg
|
|||
| TO TOP | |||
Read More - OUR RESEARCH - Articles Below

Tipping Points Life Cycle - Explained
Click on image to enlarge
TO TOP
 |
YOUR SOURCE FOR THE LATEST THINKING & RESEARCH
|
�
TO TOP